Abstract
Functionalization on microbubbles (MB) is a difficult issue due to their unstable nature. Here we report a fast and versatile method using strain promoted alkyne–azide cycloaddition (SPAAC) click reaction for microbubble functionalization. An azadibenzocyclooctyne (DBCO) group was first introduced to MB surface then an azide group to the desired ligand. Without any initiators or catalysts, essential click ligation occurred within 1 min and majority of reaction completed in 5 min under 37 °C. This fast ligation shortens the microbubble reaction time and preserves essential amounts of microbubbles for further in situ imaging and delivery of therapeutics.
Introduction
Microbubbles have been widely used in clinics as contrast agent for enhanced ultrasound imaging.1 MBs are also used as vessels for delivery of therapeutic drugs, genes, peptides and nanoparticles to diseased cells, tumors or breaching the blood–brain barrier.2–4 However, conjugate targeting ligand, antibodies, drugs and genes to the microbubbles, is a critical issue due to the instability of microbubbles. Currently, a common way to functionalize MBs is by biotin-streptavidin conjugation, which has limited clinical use due to the high immunogenicity of streptavidin to humans.5 Furthermore, the streptavidin-biotin conjugation is noncovalent bonding, a weaker type of linkage than covalent bonds, thus making the functionalization unstable and easy to detach from microbubbles.6 This non-covalent bonding also makes the linkage of larger components, e.g., nanoparticles and micelles, difficult to achieve due to the lack of sufficient binding force. In addition, the streptavidin-biotin conjugation is a slow process which requires about 1 hour of MB incubation for the functionalization to occur. Due to the short life and instability of MBs, long incubation time may cause an essential amount of MBs to burst or leak gas resulting in loss of imaging or drug delivery capabilities. Various of other routes were also explored for microbubble functionalization, e.g., hydrophobic attractions and electrostatic interactions,7, 8 with outcomes far from satisfactory. In recent years, researchers start to seek fast, self-reactive, and strong bonding reactions for microbubble functionalization and targeted imaging.9 For example, Yeh et al applied maleimide-thiol conjugation on liposome microbubbles for ultrasound imaging,5 and Wang et al applied trans-cyclooctene-tetrazine reaction for rapidly capture of liposome microbubbles to CD62p antibody pre-treated thrombus.10
Strain-promoted alkyne-azide cycloaddition is a type of metal-free click chemistry owning high conversion efficiency, orthogonality, and biocompatible properties.11–14 The reaction has received intense interests in recent years and been widely applied in cell imaging,15–17 tissue engineering,18 hydrogel fabrication,19 surfactant development,20–22 drug release23, 24 and preclinical applications.25 For example, dibenzocyclooctyne (DIBO) was reported for DNA ligation and the reaction was essentially completed within 1 min.26 In a hydrogel system using azadibenzocyclooctyne (DBCO), gel formulations started in less than 1 min and SPAAC crosslinking was completed within minutes.27 For cell imaging, biarylazacyclooctynone (BARAC) was reported to have 10-fold higher signal than DIBO after 1 min incubation, and cells showed robust surface fluorescence after 5 min incubation at room temperature.28
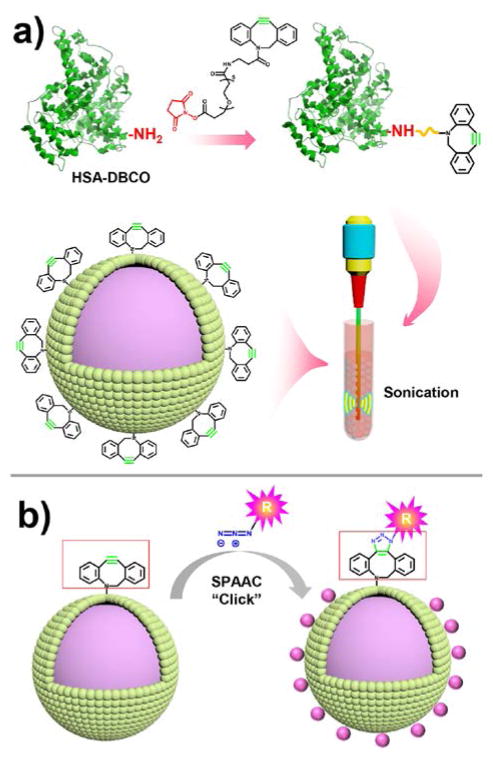
In this study, we developed the methodology using strain promoted alkyne–azide cycloaddition (SPAAC) click reaction for fast and facile functionalization of MBs. Human serum albumin (HSA) was used as a model system to demonstrate the functionalization process by grafting with DBCO groups then fabrication into MB-DBCO microbubbles (Fig. 1a). On the other side, a type of azide functional groups was introduced to the desired ligand that could link to the MBs by SPAAC click chemistry (Fig. 1b). The advantages of this SPAAC click system for MB functionalization include: i) avoiding the use of the high immunogenicity streptavidin; ii) fast reaction speed preserving MBs from burst and gas leakage; iii) strong covalent bonding allowing the linkage of large components, e.g., nanoparticles and micelles, to the MBs; iv) versatile method that could be used for linkage of a variety of components to MBs, including targeting ligand, fluorescent markers, proteins, drugs, genes or other potential compounds for research or clinical applications.
Fig. 1.
a) Synthesis of HSA-DBCO complex by reacting HSA protein with NHS-PEG-DBCO molecules and fabrication of MB-DBCO microbubbles filled with perfluorobutane (C4F10) gas by sonication method. b) Strain-promoted click chemistry allows fast and versatile incorporation of multiple components onto microbubbles.
2. Materials and Methods
2.1. Synthesis of HSA-DBCO protein
Albumin (Human) 5% solution (AlbuRx® 5) was obtained from CSL Behring LLC, Kankakee, IL, USA. A volume of 20 mL of 5% human serum albumin (HSA, 66.5 kDa) solution were adjusted to pH 8.0 at room temperature. NHS-PEG-DBCO was purchased from Click Chemistry Tools, Scottsdale, AZ. For reaction, 1 ml of adjusted HSA solution (0.05 g, 7.5 × 10⁻⁷ mol) was transferred to an Eppendorf tube and 4 mg of NHS-PEG-DBCO (693 g mol−1, 5.77 × 10⁻⁶ mol) was added. The mixture was incubated at 37 °C for 1 hour to allow the linkage of DBCO group to the albumin proteins. Obtained HSA-DBCO product was purified by overnight dialysis in a cellulose dialysis bag with molecular weight cut-off of 2000 g mol−1(MWCO 2000) against excess deionized water. Purified proteins were frozen at −80 °C, lyophilized for two days and stored at −20 °C prior to use.
2.2. Fabrication of HSA-DBCO microbubbles
MB-DBCO microbubbles were generated using a sonication method. Purified HSA-DBCO protein powder was dissolved in 1 mL of deionized water, mixed with 3 ml of 5% dextrose (Baxter, Deerfield, IL, USA) and 2 mL of perfluorobutane (C4F10) gas. The final mixture in a syringe tube was ultrasonicated by a probe model sonicator (Qsonica Q500) for 60 seconds and cooled down on ice. Approximately 6 mL of MB-DBCO microbubbles were obtained with DBCO functional group density of 9.6 × 10⁻⁴ mol L−1.
2.3. Characterization of MB and MB-DBCO microbubbles
The morphological properties and sizes of the fabricated HSA microbubbles (pure-MBs) and HSA-DBCO microbubbles (MB-DBCO microbubbles) were imaged using an inverted laser scanning confocal microscope (Carl Zeiss, Germany). Hydrodynamic sizes of microbubbles were characterized by dynamic light scattering (DLS) measurement using Zetasizer Nano ZS (Malvern Instruments) after diluting MBs (0.04 mL) 500 times in 5% dextrose solution (20 mL). After drying by lyophilization, the morphological structures of the microbubbles were examined by scanning electron microscopy (SEM; S-4700, Hitachi Instruments, Tokyo, Japan) and transmission electron microscope (TEM, 1200-EX II, JEOL Inc., Japan) at 80 kV voltage.
2.4. Reaction rate on MB surface
To explore the rate of reaction between DBCO on MB surface and azide group from ligation compound, we used TAMRA-biotin-azide (1174 g mol−1) with fluorescent marker as tracers. The fluorescence intensity changes as a function of incubation time were recorded and analyzed. Briefly, 0.1 mL of freshly prepared MB-DBCO microbubbles (DBCO functional group 9.6 × 10⁻⁸ mol) were diluted in 20 mL of prewarmed 5% HSA solution (37 °C) saturated with C4F10 gas. TAMRA-biotin-azide was diluted to 10 μg/μl and then 10 μl of TAMRA-biotin-azide (100 μg, 8.5 × 10⁻⁸ mol) were added. The reaction system was incubated at 37 °C under gentle shaking for various time lengths of 1 min, 3 min, 5 min, 10 min, and 30 min. Obtained microbubble product was purified using the centrifugation-flotation exchange of subnatant method, according to a previous study.5 Briefly, MBs after reaction were centrifuged at 500 rpm for 1 min and the subnatant (~18 mL) was discarded. Surficial bubble layer was then collected (~ 2 mL) and washed gently with the same volume (~18 mL) of cold degassed phosphate-buffered saline (PBS) once. The centrifugation-flotation process was repeated three times to fully remove unconjugated components and any bubble fragments. Purified MBs were then observed using an Axiovert 25 Zeiss light microscope (Carl Zeiss, Germany). The intensity of each bubble was analyzed using ImageJ software and normalized to background fluorescence (set as 1). For each time point, the fluorescence intensities of 150 microbubbles were recorded and averaged.
2.5. Ligation of TAMRA tracers and confocal imaging
Approximately 0.1 mL of freshly prepared MB-DBCO microbubbles (DBCO functional group 9.6 × 10⁻⁸ mol) were diluted in 20 mL of prewarmed 5% HSA solution (37 °C) saturated with C4F10 gas. TAMRA-biotin-azide (1174 g mol−1) was diluted to 10 μg/μl. Then 10 μl of TAMRA-biotin-azide (100 μg, 8.5 × 10⁻⁸ mol) were added and incubated for 5 min at 37 °C under gentle shaking. The obtained MB-TAMRA-biotin was purified using the centrifugation-flotation exchange of subnatant method, as described above. Because each TAMRA-biotin-azide molecule only has one azide group at the end, no crosslinking between MBs was observed during the ligation process. After reaction, MB-TAMRA-biotin microbubbles were imaged using an inverted laser scanning confocal microscope (Carl Zeiss, Germany).
2.6. Ultrasound imaging
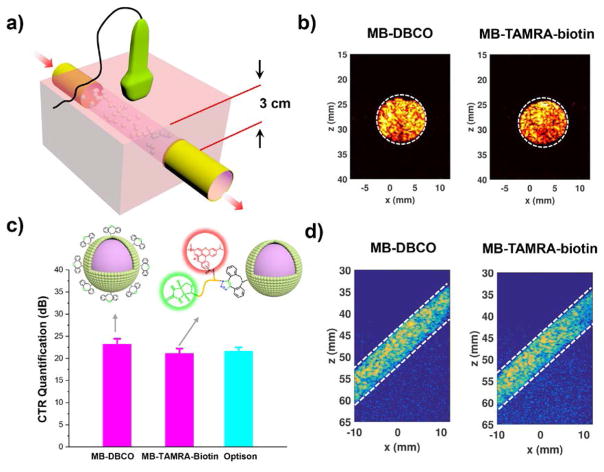
Ultrasound experiment was conducted to evaluate the imaging performance of different types of microbubbles. Commercially available microbubble Optison™ (GE Healthcare Inc., Princeton, NJ) was used as the positive control. Optison was selected for benchmarking because of Optison also comprises human serum albumin. Two phantom configurations were designed for this study29: phantom 1 had a horizontal wall-less flow channel at a constant depth of approximately 3 cm, and phantom 2 had an oblique flow channel that provided continuous imaging depths ranging from 3 cm to 6 cm. Phantom 1 was imaged with the transducer positioned perpendicular to the long-axis of the flow channel, and phantom 2 with the transducer positioned parallel to the long-axis of the channel. A Verasonics Vantage ultrasound system (Verasonics Inc., Kirkland, WA) with a linear array transducer L11-4v (Verasonics Inc., Kirkland, WA) was used throughout this study. For each type of microbubble, a suspension of microbubble agent was diluted in saline at a ratio of 0.6:1000. Controlled by a syringe pump (KD Scientific Inc. Holliston, MA, USA), each microbubble suspension was steadily flowed through the channels at an approximate flow speed of 60 ml/min, warranting replenished microbubbles (i.e., constant microbubble concentration) for each imaging measurement. All microbubbles were imaged with the same pulse-inversion (PI) ultrasound imaging sequence that is commonly used in contrast-enhanced ultrasound (CEUS).30 The PI sequence was combined with a coherent plane wave compounding sequence (four spatial compounding angles: −3°, −1°, 1°, 3°).31 The transmit center frequency was at 4.5 MHz. Ten imaging trials were performed over phantom 1 with each type of microbubbles. All acquisitions were obtained with low mechanical index (MI < 0.1) to avoid microbubble disruption.30
2.7 Cytotoxicity
After fabrication, all microbubbles used for cell study was operated in cell-culture hood with sterilized condition. Prior to cell study, microbubbles were irradiated by UV for 2 hours in cell culture hood to sterilize. HeLa cells (ATCC) were maintained in Dulbecco’s Modified Eagle’s medium (DMEM) supplemented with 100 U mL−1 penicillin, 2 mM L−1 glutamine, 0.1mg mL−1 streptomycin, and 10% heat-inactivated fetal bovine serum (FBS). Prior to in vitro study, cells were seeded with density of 10 000 cells cm−2 to 6-well tissue culture polystyrene (TCPS) plates. After 1-day culture for attachment, a trans-well chamber was immersed in each well. Sterilized microbubbles were added to the trans-well and incubated with cells at varied concentrations of 0.01, 0.1, 1.0 and 10.0 million microbubbles per mL. Wells with no microbubble added were applied as positive controls. After 3 days’ co-culture, cell numbers were detected by MTS assay (CellTiter 96 Aqueous One Solution, Promega, Madison, WI). The OD value in positive controls was set as 100% and cell viability (%) in each group was analyzed by comparing the OD value to the positive controls.
2.8 Cancer cell targeting
For microbubble targeting study, HeLa cancer cells were seeded to 12-well TCPS plates with density of 10 000 cells cm−2. After 1-day culture, cells were washed with sterilized PBS twice to remove unattached cells and replaced with fresh media. Ten million of MB-DBCO before functionalization and MB-TAMRA-Biotin after functionalized with a targeting biotin ligand were added. Cell-microbubble system was incubated at 37 C with constant shaking to prevent microbubble float to the surface and allow sufficient interaction of microbubbles with cancer cells. After 15 min co-culture, cells were imaged with inverted laser scanning confocal microscope (Carl Zeiss, Germany).
2.9 Statistical analysis
Statistical difference among groups was determined by one-way analysis of variance (ANOVA). Differences are considered significant when p-values are smaller than 0.05.
3. Results and Discussion
3.1 Protein Synthesis and MB-DBCO fabrication
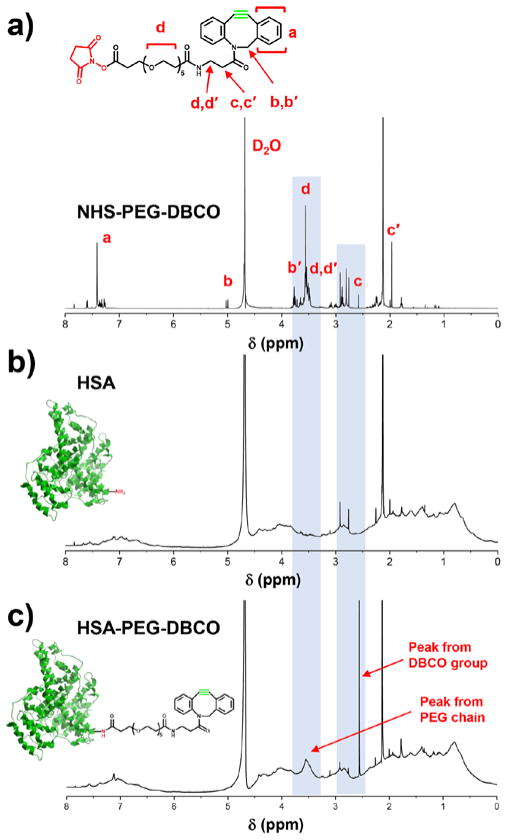
To fabricate MB-DBCO microbubbles, the HSA protein was first reacted with NHS-poly(ethylene glycol)-DBCO (NHS-PEG-DBCO) to generate HSA-DBCO protein (Fig. 1a). The synthesized products were characterized by 1H NMR. In order to make an effective comparison, both the HSA protein and the NHS-PEG-DBCO molecules were characterized, and presented in Fig. 2a–b. After reaction and purification, the obtained HSA-DBCO protein showing specific peaks (Fig. 2c) by 1H NMR that combined from both peaks from the HSA protein and the PEG-DBCO functional group. This indicates that the DBCO groups were successfully linked to the HSA.
Fig. 2.
1H NMR spectra of a) NHS-PEG-DBCO (in D2O); b) HSA protein (in D2O); c) purified HSA-DBCO protein (in D2O).
Dried HSA-DBCO powder was then dissolved in 1 mL of deionized water (5 wt%), mixed with 3 ml of 5% dextrose and 2 mL of perfluorobutane (C4F10) gas in a syringe tube, and sonicated by a probe model sonicator (Qsonica Q500) for 60 seconds (Fig. 1a) to fabricate MB-DBCO microbubbles. Confocal microscopy images as fluorescence tracer, which contains a fluorescent TAMRA group and an azide group which could link to MBs through SPAAC click chemistry (Fig. 4a). Fluorescence of MB-DBCO microbubbles and pure-MBs were obtained by confocal microscopy after incubation for 1, 3, 5, 10 and 60 min with TAMRA-biotin-azido tracer molecules. Relative fluorescent intensity change in response to time was calculated by setting background as 1. As demonstrated in Fig. demonstrated a regular bubble shape of the non-modified MBs (Fig. 3a). As comparison, the modified MB-DBCO showed similar morphological structures with the non-modified MBs (Fig. 3b). This indicates that the small DBCO group linked on the protein does not significantly alter the bubble fabrication process.
Fig. 4.
a) Ligation of fluorescent markers and targeting biotin to microbubbles using SPAAC click chemistry. b) Normalized fluorescence intensity of MB-DBCO microbubbles after varied incubation time with fluorescent tracer molecules. Confocal fluorescence microscopy images of c) HSA-MB and d) MB-DBCO microbubbles after ligation with TAMRA-biotin-azide molecules. Fluorescent intensity mapping of a typical image observed for e) HSA-MB and f) MB-DBCO microbubbles after ligation with TAMRA-biotin-azide molecules.
Fig. 3.
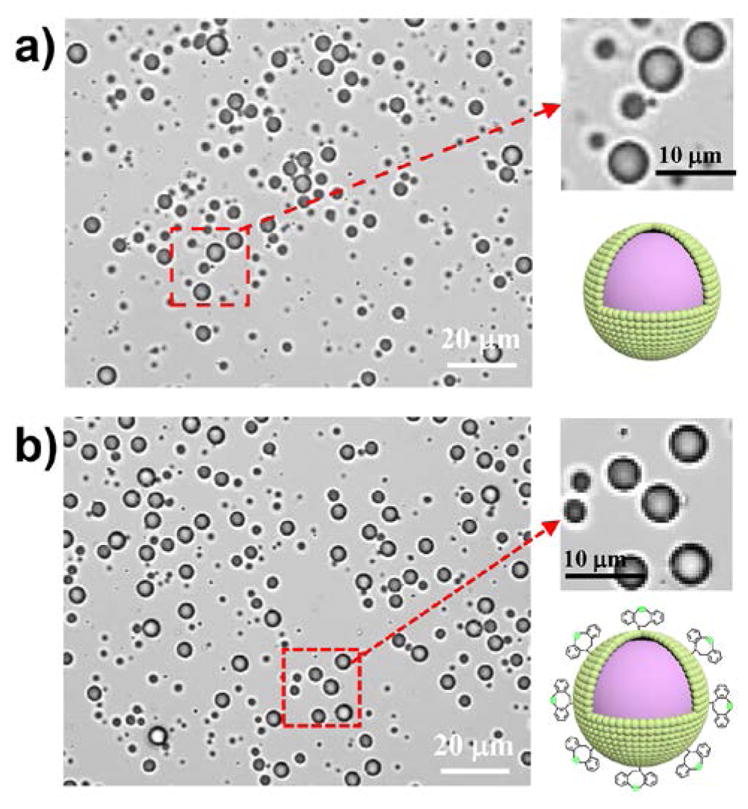
Confocal microscopy images of a) pure microbubbles and b) MB-DBCO microbubbles.
3.2 Reaction Kinetics and Fluorescent imaging
To explore whether external components could be successfully functionalized onto the MB surface, we used TAMRA-biotin-azide 4b, an essential part of the SPAAC click reaction occurred within 1 min by incubation at 37 °C. After 5 min incubation, fluorescence intensity reached a plateau region, indicating the click reaction was close to saturation within 5 minutes. These data indicated that external ligand could be successfully incorporated to the MB surface through click chemistry (Fig. 4a), and the reaction is fast in speed to be completed within minutes.
Fluorescent images of MB-DBCO microbubbles and pure-MBs after 5 min incubation with TAMRA-biotin-azido molecules were obtained by confocal microscopy and presented in Fig. 4c–d. As can be seen from Fig. 4c, the pure-MBs lacked noticeable fluorescence after the incubation. However, for MB-DBCO microbubbles with click group, there is intensified red fluorescence were observed (Fig. 4d). Whole image analysis could clearly display that no observable fluorescent intensities for pure MBs (Fig. 4e) while strong fluorescence intensities for MB-DBCO microbubbles (Fig. 4f).
3.3 Single bubble fluorescent intensity mapping
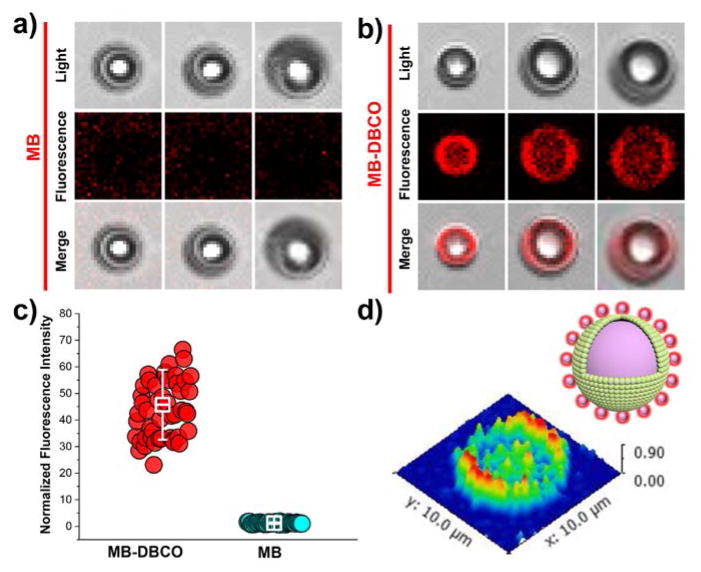
Fluorescent image for single MB and MB-DBCO microbubbles obtained in Fig. 4c–d were enlarged and presented in Fig. 5a–b. Fluorescence intensity on each bubble was calculated using ImageJ software and showed normalized values of 44.6 ± 11.9 and 1.2 ± 0.3 for MB-DBCO MICROBUBBLES and pure-MBs (Fig. 5c), respectively. Three-dimensional (3-D) mapping of the fluorescence intensities for single MB-DBCO bubble indicated strong fluorescence on the boundary of the DBCO modified microbubbles (Fig. 5d). These results clearly confirmed that SPAAC click chemistry is a rapid and efficient route to incorporate fluorescent markers and targeting ligands to microbubbles.
Fig. 5.
Enlarged single MBs from the above obtained confocal images for a) pure MB and b) MB-DBCO microbubbles after functionalization with TAMRA-biotin-azide molecules. c) Normalized fluorescence intensity of MB-DBCO microbubbles and pure-MBs after reaction with TAMRA-biotin-azide (with background intensity set as 1). d) Two-dimensional fluorescent intensity mapping of a functionalized MB-TAMRA-Biotin microbubble.
3.4 Size and density after reaction
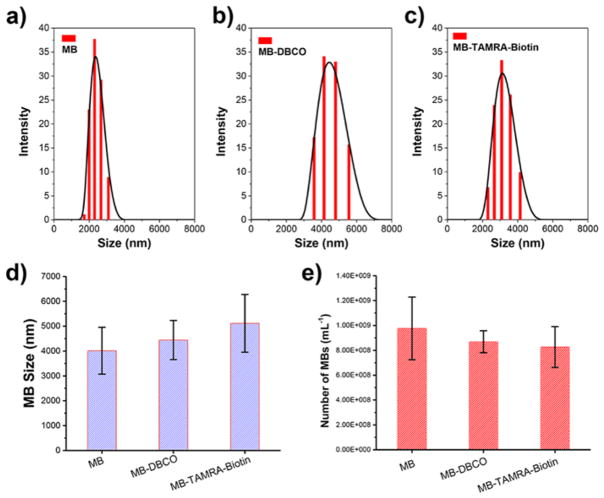
The size and density of MBs before and after SPAAC click reaction were characterized. As presented in Fig. 6a–b, the hydrodynamic size characterized by dynamic light scattering showed a distribution within 0.5 to 10 microns range with average value of 4.0 ± 0.9 μm and 4.4 ± 0.8 μm for MBs and MB-DBCO microbubbles, respectively. This indicates that the DBCO group may cause a slightly large hydrodynamic size for microbubbles, while no statistical difference was determined between the MB and MB-DBCO group. After reaction, the MB-TAMRA-biotin microbubbles were also distributing in the 1–10 microns size range (Fig. 6c), with average size of 5.1 ± 1.1 μm, slightly larger than the MB-DBCO microbubbles prior to SPAAC click reaction (Fig. 6d). This difference may be resulted by the TAMRA-biotin segment linked on the microbubble surface.
Fig. 6.
Size distributions of a) MB, b) MB-DBCO and c) MB-TAMRA-biotin. d) Average sizes of multiple microbubbles expressed as means ± standard deviations. e) The density of microbubbles (number of MBs in 1 mL) before and after ligation by SPAAC click chemistry.
The density of microbubbles per mL was counted under microscope using a cell counter. As presented in Fig. 6e, the MB and MB-DBCO showed densities of (9.8 ± 2.5) × 108 and (8.7 ± 0.9) × 108 microbubbles per mL, respectively. This indicates that the incorporated DBCO functional group does not alter the microbubble fabrication process and could result similar densities of microbubbles. After reaction with tracer molecule by SPAAC click chemistry, the MB-TAMRA-biotin bubbles showed density of (8.3 ± 1.6) × 108 microbubbles per mL, close to the value of MB-DBCO bubbles before functionalization. All these results demonstrated microbubbles maintained the similar size and density after functionalization by SPAAC click chemistry.
3.5 Ultrasound Imaging
The ultrasound imaging ability of these microbubbles before and after functionalization was determined using a gelatin phantom set imaging abilities of these MBs were evaluated using penetration imaging system in which microbubbles were imaged at different depth through the phantom. As demonstrated in Fig. 7d, comparable contrasts were obtained for all microbubbles at different imaging demonstrated in Fig. 7a. The representative 2-D images (i.e., B-mode images) acquired with different microbubble types were shown in Fig. 7b. As can be seen from these images, the functionalized microbubble had similar contrast as compared to the commercially available microbubble Optison™. Contrast-to-tissue ratio (CTR) was calculated as the ratio of average image intensity between the MB region inside the flow channel and the tissue background region outside the flow channel.32 As shown in Fig. 7c, the MB-DBCO and MB-TAMRA-biotin modified microbubbles achieved similar CTR value as compared to Optison. Further depths. These results demonstrated that surface modification using SPAAC click chemistry did not alter the imaging capability of the microbubbles.
Fig. 7.
a) Schematic plot of ultrasound experiment setup for the Horizontal wall-less flow channel. b) Representative B-mode 2-D images and c) contrast-to-tissue ratio (CTR) measurements of MBs. c) Penetration imaging for MBs obtained inn an oblique flow channel phantom.
3.6 Cytotoxicity
Varied types of microbubbles, i.e., pure MB, MB-DBCO before functionalization, and MB-TAMRA-Biotin after functionalization, were co-cultured with cells for 3 days and cell viability in each group were determined. As presented in Fig. 8, all microbubbles showed no noticeable cytotoxicity with cell viability approaching 100%, as compared to the positive controls without microbubble treatment. This indicates that the microbubble itself is non-toxic to cells. The good cell viability for MB-TAMRA-Biotin microbubbles illustrate that the purification was complete and no toxic components were left after purified MB-TAMRA-Biotin microbubbles.
Fig. 8.
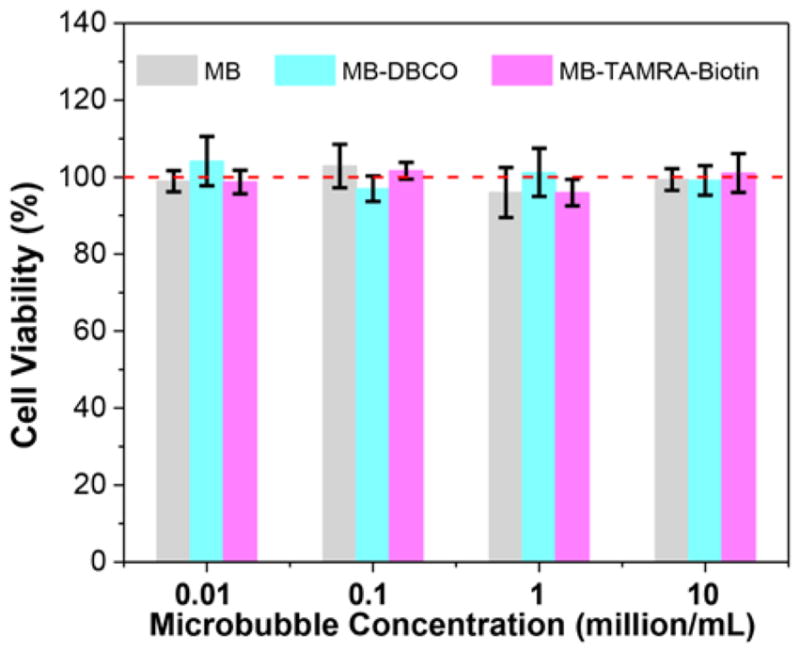
Cell viabilities after co-culture with the different types of microbubbles at varied concentrations.
3.7 Cancer Cell Targeting
Cancer cells usually proliferate expeditiously thus having voracious appetite for vitamins that could help their growth.33 A large variety of vitamins, e.g., biotin, folic acid, vitamin B12 and riboflavin, were widely studied taking advantage of their cancer targeting characteristics.34–36 Among these vitamins, biotin, i.e., vitamin H, attracts intensified interests in recent years with desirable characteristics of higher uptake by cancer cells than normal cells.37, 38 Chemical structure of biotin was consisted of a fused ureido ring with tetrahydrothiophene ring attached by valeric acid substituent. Biotin is widely acknowledged to be a cell growth promoter, functionalizing with carboxylases for the establishment of amino acids.39 Furthermore, biotin is reported to play a critical role for gene regulation and cellular signaling.39 The encapsulating of biotin molecules is mainly through a receptor that named sodium-dependent multi-vitamin transporter (SMVT), which is overexpressed in various cancer cells including lung, renal, breast, and ovarian cancer.40 In the past decade, biotin was used as a targeting ligand for the delivery of various anti-cancer drugs, e.g., platinum, ferrocene, paclitaxel and doxorubicin, to tumors.41–44
Here, the tumor-targeting biotin moiety was linked to microbubbles through SPAAC click chemistry for cancer targeted ultrasound imaging or therapeutics delivery. In order to evaluate the functionality of the biotin ligand conjugated to the microbubble surface, two types of microbubbles, i.e., MB-DBCO without biotin functionalization and MB-TAMRA-Biotin functionalized with biotin ligands, were incubated with the HeLa cancer cells for 15 min under constant shaking. As can be seen from the confocal images demonstrated in Fig. 9a, the MB-DBCO without biotin functionalization distributed evenly and randomly in the observing area and no obvious cancer cell targeting capabilities were displayed. For the MB-TAMRA-Biotin functionalized with biotin ligands, the fluorescence image showed high intensity of red fluorescence from TAMRA group, confirming the conjugate of TAMRA groups to the microbubbles (Fig. 9b). Since the biotin and TAMRA ligands were linked within the same molecule, this fluorescence also confirms the successful conjugate of biotin ligand to the microbubbles. The distribution profile showed a large number of the MB-TAMRA-Biotin microbubbles with biotin ligand were accumulated around the edge or on the top of the HeLa cancer cells, as displayed in Fig. 9b. An enlarged view was also presented to show a clearer view of the microbubble distribution on the cancer cells. This microbubble accumulation is believed to be resulted by the biotin-SMVT receptor conjugation on cancer cell surface, as schematically demonstrated in Fig. 9c. These results demonstrated that the cancer-targeting biotin ligand can be successfully linked to microbubble surface through SPAAC click chemistry and capable to functionalize for conjugating microbubbles to cancer cells.
Fig. 9.
Confocal images showing cancer cell targeting ability of the a) MB-DBCO before functionalization and b) MB-TAMRA-Biotin after functionalized with a targeting biotin ligand. c) Schematic demonstration of the targeting of microbubbles to cancer cells through biotin-receptor conjugation.
Conclusions
In this study, the strain-promoted click chemistry was explored as a fast and versatile tool to functionalize microbubbles. The click chemistry method developed in the current study does not involve toxic or immunogenicity reagents, has fast reaction speed, and is versatile for ligation of various desired compounds to the microbubbles. The use of human serum albumin as basic composition for ultrasound microbubbles eliminates potential immunogenicity and further facilitates applications toward clinical translation. All these advantages make this methodology promising for a wide range of biomedical research such as molecular imaging, real-time determination of inflammation, angiogenesis and thrombosis in heart, liver, kidney, and brain.
Acknowledgments
This work was supported by the Mayo Foundation and NIH grants R01 AR56212 and NIH K99CA214523.
References
- 1.Errico C, Pierre J, Pezet S, Desailly Y, Lenkei Z, Couture O, Tanter M. Nature. 2015;527:499. doi: 10.1038/nature16066. [DOI] [PubMed] [Google Scholar]
- 2.Ferrari M. Nature reviews Cancer. 2005;5:161. doi: 10.1038/nrc1566. [DOI] [PubMed] [Google Scholar]
- 3.Lindner JR. Nature Reviews Cardiology. 2009;6:475–481. doi: 10.1038/nrcardio.2009.77. [DOI] [PubMed] [Google Scholar]
- 4.Hernot S, Klibanov AL. Advanced drug delivery reviews. 2008;60:1153–1166. doi: 10.1016/j.addr.2008.03.005. [DOI] [PMC free article] [PubMed] [Google Scholar]
- 5.Yeh JSM, Sennoga CA, McConnell E, Eckersley R, Tang MX, Nourshargh S, Seddon JM, Haskard DO, Nihoyannopoulos P. PloS one. 2015;10:e0129681. doi: 10.1371/journal.pone.0129681. [DOI] [PMC free article] [PubMed] [Google Scholar]
- 6.Grandbois M, Beyer M, Rief M, Clausen-Schaumann H, Gaub HE. Science. 1999;283:1727–1730. doi: 10.1126/science.283.5408.1727. [DOI] [PubMed] [Google Scholar]
- 7.Aw MS, Paniwnyk L, Losic D. Expert opinion on drug delivery. 2016;13:1383–1396. doi: 10.1080/17425247.2016.1192123. [DOI] [PubMed] [Google Scholar]
- 8.Lee M, Lee EY, Lee D, Park BJ. Soft Matter. 2015;11:2067–2079. doi: 10.1039/c5sm00113g. [DOI] [PubMed] [Google Scholar]
- 9.Wang H, Gauthier M, Kelly JR, Miller RJ, Xu M, O’Brien WD, Cheng J. Angewandte Chemie. 2016;128:5542–5546. doi: 10.1002/anie.201509601. [DOI] [PMC free article] [PubMed] [Google Scholar]
- 10.Wang T, Yuan C, Dai B, Liu Y, Li M, Feng Z, Jiang Q, Xu Z, Zhao N, Gu N. Chem Bio Chem. 2017 [Google Scholar]
- 11.DeForest CA, Anseth KS. Nat Chem. 2011;3:925–931. doi: 10.1038/nchem.1174. [DOI] [PMC free article] [PubMed] [Google Scholar]
- 12.Sletten EM, Bertozzi CR. Acc Chem Res. 2011;44:666–676. doi: 10.1021/ar200148z. [DOI] [PMC free article] [PubMed] [Google Scholar]
- 13.Deforest CA, Sims EA, Anseth KS. Chem Mater. 2010;22:4783–4790. doi: 10.1021/cm101391y. [DOI] [PMC free article] [PubMed] [Google Scholar]
- 14.DeForest CA, Polizzotti BD, Anseth KS. Nat Mater. 2009;8:659–664. doi: 10.1038/nmat2473. [DOI] [PMC free article] [PubMed] [Google Scholar]
- 15.Ning X, Guo J, Wolfert MA, Boons GJ. Angew Chem Int Ed Engl. 2008;47:2253–2255. doi: 10.1002/anie.200705456. [DOI] [PMC free article] [PubMed] [Google Scholar]
- 16.Chang PV, Prescher JA, Sletten EM, Baskin JM, Miller IA, Agard NJ, Lo A, Bertozzi CR. Proc Natl Acad Sci U S A. 2010;107:1821–1826. doi: 10.1073/pnas.0911116107. [DOI] [PMC free article] [PubMed] [Google Scholar]
- 17.Wang H, Wang R, Cai K, He H, Liu Y, Yen J, Wang Z, Xu M, Sun Y, Zhou X. Nature Chemical Biology. 2017;13:415–424. doi: 10.1038/nchembio.2297. [DOI] [PMC free article] [PubMed] [Google Scholar]
- 18.Liu X, Miller AL, Fundora KA, Yaszemski MJ, Lu L. Acs Macro Lett. 2016;5:1261–1265. doi: 10.1021/acsmacrolett.6b00736. [DOI] [PMC free article] [PubMed] [Google Scholar]
- 19.Zheng JK, Callahan LAS, Hao JK, Guo K, Wesdemiotis C, Weiss RA, Becker ML. Acs Macro Lett. 2012;1:1071–1073. doi: 10.1021/mz3003775. [DOI] [PMC free article] [PubMed] [Google Scholar]
- 20.Li YW, Wang Z, Zheng JK, Su H, Lin F, Guo K, Feng XY, Wesdemiotis C, Becker ML, Cheng SZD, Zhang WB. Acs Macro Lett. 2013;2:1026–1032. doi: 10.1021/mz400519c. [DOI] [PubMed] [Google Scholar]
- 21.Su H, Li YW, Yue K, Wang Z, Lu PT, Feng XY, Dong XH, Zhang S, Cheng SZD, Zhang WB. Polym Chem-Uk. 2014;5:3697–3706. [Google Scholar]
- 22.Li YW, Su H, Feng XY, Yue K, Wang Z, Lin ZW, Zhu XL, Fu Q, Zhang ZB, Cheng SZD, Zhang WB. Polym Chem-Uk. 2015;6:827–837. [Google Scholar]
- 23.Ono RJ, Lee AL, Voo ZX, Venkataraman S, Koh BW, Yang YY, Hedrick JL. Biomacromolecules. 2017;18:2277–2285. doi: 10.1021/acs.biomac.7b00377. [DOI] [PubMed] [Google Scholar]
- 24.Zhang Y, Chan JW, Moretti A, Uhrich KE. J Control Release. 2015;219:355–368. doi: 10.1016/j.jconrel.2015.09.053. [DOI] [PMC free article] [PubMed] [Google Scholar]
- 25.Tyler DS, Vappiani J, Cañeque T, Lam EY, Ward A, Gilan O, Chan Y-C, Hienzsch A, Rutkowska A, Werner T. Science. 2017:eaal2066. doi: 10.1126/science.aal2066. [DOI] [PMC free article] [PubMed] [Google Scholar]
- 26.Shelbourne M, Chen X, Brown T, El-Sagheer AH. Chem Commun. 2011;47:6257–6259. doi: 10.1039/c1cc10743g. [DOI] [PubMed] [Google Scholar]
- 27.Xu J, Filion TM, Prifti F, Song J. Chemistry–An Asian Journal. 2011;6:2730–2737. doi: 10.1002/asia.201100411. [DOI] [PMC free article] [PubMed] [Google Scholar]
- 28.Jewett JC, Sletten EM, Bertozzi CR. J Am Chem Soc. 2010;132:3688–3690. doi: 10.1021/ja100014q. [DOI] [PMC free article] [PubMed] [Google Scholar]
- 29.Farrer AI, Odéen H, de Bever J, Coats B, Parker DL, Payne A, Christensen DA. Journal of Therapeutic Ultrasound. 2015;3:9. doi: 10.1186/s40349-015-0030-y. [DOI] [PMC free article] [PubMed] [Google Scholar]
- 30.Simpson DH, Chin CT, Burns PN. IEEE Trans Ultrason Ferroelectr Freq Control. 1999;46:372–382. doi: 10.1109/58.753026. [DOI] [PubMed] [Google Scholar]
- 31.Montaldo G, Tanter M, Bercoff J, Benech N, Fink M. Ieee Transactions on Ultrasonics Ferroelectrics and Frequency Control. 2009;56:489–506. doi: 10.1109/TUFFC.2009.1067. [DOI] [PubMed] [Google Scholar]
- 32.Shen C-C, Shi T-Y. IEEE transactions on ultrasonics, ferroelectrics, and frequency control. 2011:58. doi: 10.1109/TUFFC.2011.1812. [DOI] [PubMed] [Google Scholar]
- 33.Russell-Jones G, McTavish K, McEwan J, Rice J, Nowotnik D. Journal of inorganic biochemistry. 2004;98:1625–1633. doi: 10.1016/j.jinorgbio.2004.07.009. [DOI] [PubMed] [Google Scholar]
- 34.Liu X, Miller AL, II, Waletzki BE, Mamo TK, Yaszemski MJ, Lu L. New J Chem. 2015;39:8840–8847. doi: 10.1039/C5NJ01404B. [DOI] [PMC free article] [PubMed] [Google Scholar]
- 35.Allen TM. Nature Reviews Cancer. 2002;2:750–763. doi: 10.1038/nrc903. [DOI] [PubMed] [Google Scholar]
- 36.Liu X, Miller AL, II, Yaszemski MJ, Lu L. RSC Advances. 2015;5:33275–33282. doi: 10.1039/c5ra04096e. [DOI] [PMC free article] [PubMed] [Google Scholar]
- 37.Bildstein L, Dubernet C, Couvreur P. Advanced drug delivery reviews. 2011;63:3–23. doi: 10.1016/j.addr.2010.12.005. [DOI] [PubMed] [Google Scholar]
- 38.Yang W, Cheng Y, Xu T, Wang X, Wen L-p. European journal of medicinal chemistry. 2009;44:862–868. doi: 10.1016/j.ejmech.2008.04.021. [DOI] [PubMed] [Google Scholar]
- 39.Ren WX, Han J, Uhm S, Jang YJ, Kang C, Kim JH, Kim JS. Chem Commun. 2015;51:10403–10418. doi: 10.1039/c5cc03075g. [DOI] [PubMed] [Google Scholar]
- 40.Tripodo G, Mandracchia D, Collina S, Rui M, Rossi D. Med Chem. 2014;8:1–4. [Google Scholar]
- 41.Muhammad N, Sadia N, Zhu C, Luo C, Guo Z, Wang X. Chem Commun. 2017;53:9971–9974. doi: 10.1039/c7cc05311h. [DOI] [PubMed] [Google Scholar]
- 42.Plazuk D, Zakrzewski J, Salmain M, Błauż A, Rychlik Be, Strzelczyk P, Bujacz A, Bujacz G. Organometallics. 2013;32:5774–5783. [Google Scholar]
- 43.Heo DN, Yang DH, Moon HJ, Lee JB, Bae MS, Lee SC, Lee WJ, Sun IC, Kwon IK. Biomaterials. 2012;33:856–866. doi: 10.1016/j.biomaterials.2011.09.064. [DOI] [PubMed] [Google Scholar]
- 44.Singh Y, Durga Rao Viswanadham K, Kumar Jajoriya A, Meher JG, Raval K, Jaiswal S, Dewangan J, Bora H, Rath SK, Lal J. Molecular pharmaceutics. 2017;14:2749–2765. doi: 10.1021/acs.molpharmaceut.7b00310. [DOI] [PubMed] [Google Scholar]


