Abstract
Auditory steady state response (ASSR) and inhibitory gating (IG) are electrophysiological examinations commonly used to evaluate the sensory and cognitive functions of the brain. In some clinic examinations and animal experiments, general anesthesia is necessary to conduct electrophysiological recordings. However, the effects of anesthesia on ASSR and IG remain unclear. For this reason, we recorded local field potentials though electrodes implanted in different brain areas of rats: the auditory cortex (AC), hippocampus (HC), amygdala (AMY), and prefrontal cortex (PFC), and compared the characteristics of ASSR and IG under anesthetized and conscious conditions. We found that ASSR signals were the strongest in the AC, and decreased sequentially in the HP, AMY, and PFC. Chloral hydrate anesthesia significantly reduced the power and phase-locking of ASSR in the AC, HP, and AMY. In contrast, the extent of IG in the AC was weakest and it increased sequentially in the HP, AMY, and PFC. Anesthesia had less effect on the extent of IG. Our results suggest that ASSR and IG may originate from different neural circuits and that IG is more resistant to general anesthesia and therefore better suited to examining the functioning of non-auditory brain regions.
Introduction
Auditory steady state response (ASSR) and inhibitory gating (IG) are commonly used to evaluate the sensory and cognitive functions of the central nervous system. Electroencephalographic (EEG) signals entrained to periodic auditory stimuli (a train of clicks) are often referred to as the ASSR. The power (magnitude) and phase locking ability (phase consistency across trials) of the ASSR can reflect the functional integrity of the neural circuits that support synchronization across frequencies1,2. EEG measurement of ASSR, particularly in the gamma frequency range (30–80 Hz), has been commonly used in the clinical examination of mental illness3–8 and in neuropharmacological experiments in animal models9,10.
IG is experimentally characterized by a reduced responsiveness to redundant stimuli. IG is estimated using evoked response potential (ERP) techniques in which identical pairs of auditory stimuli (tones, white noises or clicks) are presented and ERP responses to the stimuli are elicited and then compared. The first stimulus in a pair is commonly identified as the conditioning stimulus (C) and the second one is called the test stimulus (T). The C and T stimuli are separated by an inter-trial interval of 0.5 s, and trial pairs are typically separated by 8–10 s11–14. In general, the amplitude of the response to T stimuli is lower than that to C stimuli15, the ratio of responses to T and C theoretically represents IG16. IG has been proposed as a pre-attentional mechanism involved in sensory information processing and the modulation of responses to stimuli15,17. Healthy IG function is thought to promote the filtering of irrelevant information from important sensory stimuli18,19. Examination of IG may reveal some dysfunctions of brain11,19–22.
Though ASSR and IG have been widely used, some methodological issues remain unclear. Because general anesthesia is required in some cases of clinical examination and animal experimentation, the effects of anesthesia on ASSR and IG warrant investigation. Furthermore, the exact anatomical sites involved in mediating ASSR and IG in humans have not yet been established due to the limitations of performing studies using intra-cerebral electrodes. Studies in animals can provide more insight into the areas of the brain involved in ASSR and IG. Therefore, we designed this study to examine the effects of anesthesia on ASSR and IG recorded from different brain regions. We implanted microelectrodes in the auditory cortex (AC), hippocampus (HC), amygdala (AMY), and prefrontal cortex (PFC) of rats and recorded the local field potentials (LFPs) evoked by auditory stimuli (click-trains and noise pairs) under conscious and chloral hydrate anesthetized conditions. We selected the HP, AMY, and PFC because they play vital roles in advanced brain functions (memory, emotion, and motivation). By comparing the LFPs recorded from the auditory and non-auditory regions, we found different anatomical distributions of ASSR and IG, and different effects of anesthesia on ASSR and IG.
Materials and Methods
Animals
All experimental protocols were approved by the China Medical University Animal Care and Use Committee and were in strict accordance with the National Institutes of Health Guide for the Care and Use of Laboratory Animals (NIH Publications No. 80-23) revised in 1996. All surgeries were conducted under anesthesia and maximum efforts were taken to ameliorate animal suffering. Adult male Wistar rats weighing 250–300 g (8–10 weeks old) were used for the experiments. Animals came from our own colony housed in a humidity-controlled (50–55%) and temperature-controlled (22–24 °C) facility and were on a 12-h light/dark cycle (lights on at 7:30 A.M.) with ad libitum access to food and water.
Surgical preparation and electrode implantation
The animal was anesthetized by an intraperitoneal injection of urethane (1.5 g/kg). Supplementary doses (0.5 g/kg) were given as needed. Atropine sulfate (0.1 mg/kg) was used to reduce the viscosity of bronchial secretions. Temperature was monitored rectally and maintained at 37 °C using a feedback-controlled blanket. After placing the animal in a stereotaxic frame (SR-5R, Narishige, Tokyo, Japan), the cranium was exposed. Four stainless steel guide tubes (27 G) were separately inserted into the left hemisphere of the AC (A −4.0, M +3.0, D −1.5), HP (A −5.2, M +5.4, D −3.8), AMY (A −3.0, M +4.9, D −8.5), and PFC (A +4.8, M +0.5, D −4.0) according to the standard rat stereotaxic atlas23. After fixing the tubes using dental acrylic, we lowered a Teflon-coated sliver microwire (#78550, A-M Systems, USA) into each tube and kept the tip of the microwire at the level of 0.5 mm below the opening of the tube. The other end of the microwire was soldered to a pin connector, which was secured onto the cranium of the right hemisphere using dental cement. The stainless guide tubes implanted in the AC, HP, AMY, and PFC served as references.
Sound presentation system and auditory stimulus
Sound stimuli were generated by custom-built programs in the MATLAB (The Mathworks, Nantic, MA, USA) environment and delivered via an earphone (NW-STUDIO PRO W; Ninewave, Japan), which was attached to the cement platform implanted on the rat’s skull during the surgery. The placement of the earphone was adjusted to 1 cm from the ear canal contralateral to the recording side. We used a train of click sounds to assess ASSR. The waveform of each click was a rectangular pulse of a 0.2-ms duration, which repeated at a rate of 40 cycles/s and continued for a 0.5-s duration. In each session, the click-trains were presented 120 times with inter-train-intervals of 2–4 s. After the recording of ASSR, 120 pairs of sounds were presented to the rats to evaluate IG. The sound pairs consisted of two 80-ms sounds of white noise (5-ms rising/falling time), presented at a fixed interval of 500 ms. The first sound in a sound pair was identified as the conditioning sound (C) and the second one was called the testing sound (T). There was an 8–10-s interval between the pairs of sounds. The peak of all the sound waves was adjusted to the level of a 4k-Hz pure-tone at a 55-dB sound pressure level, measured by placing a sound pressure meter (Brüel & Kjaer, 1/2-inch condenser microphone with a pre-amplifier 2669) 1 cm in front of the earphone.
Recording procedure
Electrophysiological recording was conducted in an electrically shielded, soundproof box. Before the recording experiments, the rats were acclimated to handling and to the laboratory for 5 days. The rats were habituated to the recording box and sound stimuli for 30 min on day 5. On the recording day, a flexible, low noise cable was connected to the pin connector implanted on the skull of the rat. The microwire output was delivered to a multi-channel preamplifier (RA16PA; TDT, Alachua, FL, USA), then to a digital signal processing module (RZ-2; TDT). The waveforms of the field potentials were obtained by applying a bandpass filter (1–300 Hz). The field potentials were imported into Matlab for further analysis. First, we recorded the LFPs evoked by click-trains and sound pairs when the rats were free (conscious condition). The recording session lasted about 30 min. Then, the rats were anesthetized with chloral hydrate (330–350 mg/kg, 5%, i.p.). Twenty minutes later, when the rats were under general anesthesia indicated by the disappearance of nociceptive reflex (anesthetized condition), the LFPs evoked by click-trains and sound pairs were recorded again. The recording procedure was repeated 2–4 times on each rat with an interval of at least 3 days.
Analysis of LFP
LFPs evoked by a 40-Hz click-train were analyzed using a wavelet-based analysis algorithm, implemented in custom written Matlab scripts, to obtain their mean trial power (MTP) and phase-locking factor (PLF)24. MTP was computed by averaging the LFP power in the spectral-temporal domain across the 120 trials from one session. PFL measures the synchronization of the LFP phase across individual trials at particular frequencies and time intervals.
LFPs evoked by sound pairs were quantified through amplitude measurements for certain negative and positive peaks in the waveform averaged across the 120 recording trials. The peaks were identified according to the local maxima (or minima) in predefined time windows, and the peaks were measured according to the difference in peak amplitude (positive or negative) from the baseline amplitude at the time of stimulus onset. With sliding-window t-tests, the LFP peaks were compared with activity during a 1-s control period 3 s before each C stimulus. Only the LFP peaks that differed from the control period at the 0.01 level of significance were used for further analysis. The responses that differed significantly from the control period were designated as C-amp or T-amp, respectively, for the amplitude of response to C or T. The ratio of T-amp/C-amp (T/C) served as a crucial comparison for IG.
Data availability
The datasets generated during and analyzed during the current study are available from the corresponding author on reasonable request.
Results
We implanted the microwires on the left-brain hemisphere of 34 rats and conducted 98 recording sessions. In total, we successfully acquired 93 sound-evoked LFP data sets in the AC, 74 in the HP, 68 in the AMY, and 64 in the PFC.
Effect of anesthesia on ASSR
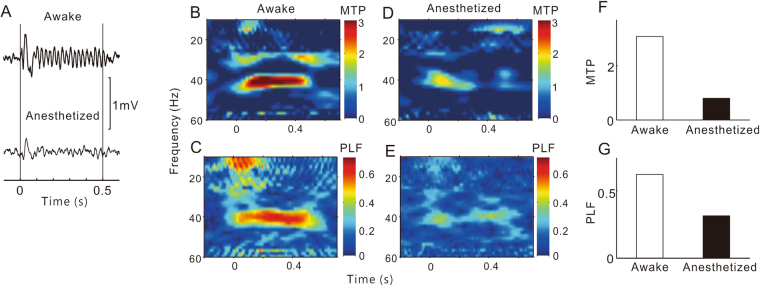
Under conscious conditions, click-train stimulation evoked robust and time-locked oscillatory changes in the LFP of the AC, as shown by the example in Fig. 1A. We used time-frequency analysis to quantitatively evaluate the MTP and PLF. MTP reveals the amplitude of the evoked LFP, and PLF examines the trial-to-trial dynamics of the phase-locked response. The time-frequency plots of MTP and PLF in response to a 40-Hz stimulation are shown in Fig. 1B and C. It is clear that the LPF of this site showed strong MTP and PLF at 40 Hz. Under anesthetized conditions, the oscillation of the LFP waveform and the strength of the MTP and PLF became smaller (Fig. 1D,E). The mean MTP (averaged across a 35–45-Hz frequency range and a 50–550-ms time window) and PLF of the conscious and anesthetized conditions are presented in Fig. 1F and G, and indicate that the MTP and PLF were obviously reduced by anesthesia.
Figure 1.
A representative example of ASSR in AC sites. (A) LFPs evoked by click-train stimulation. Vertical lines mark the onset and offset of the click-trains. (B) and (C) Time-frequency plot of MTP and PLF under conscious conditions. (D) and (E) Time-frequency plot of MTP and PLF under anesthetized conditions. (F) and (G) the value of MTP and PLF at 40 Hz under conscious and anesthetized conditions.
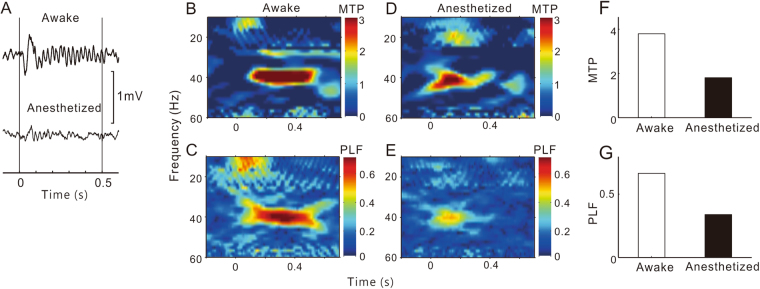
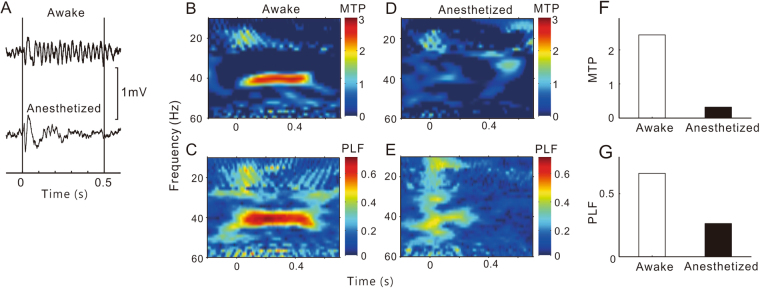
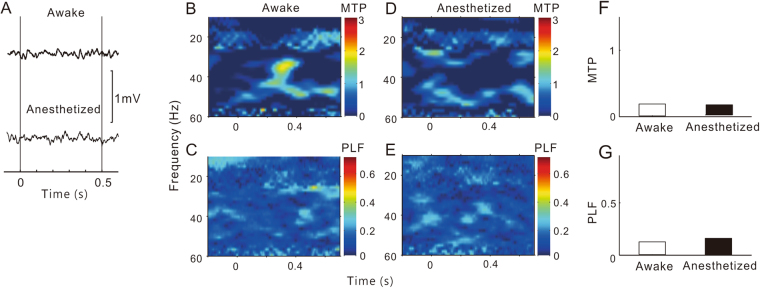
The representative results for the HP, AMY, and PFC sites are presented in Figs 2, 3 and 4, respectively. The LFPs in the HP and AMY showed a clear ASSR under conscious conditions, which was largely suppressed under anesthetized conditions. In the PFC site, we could not record a robust ASSR under any conditions.
Figure 2.
A representative example of ASSR in HP sites. Same format as Fig. 1.
Figure 3.
A representative example of ASSR in AMY sites. Same format as Fig. 1.
Figure 4.
A representative example of ASSR in PFC sites. Same format as Fig. 1.
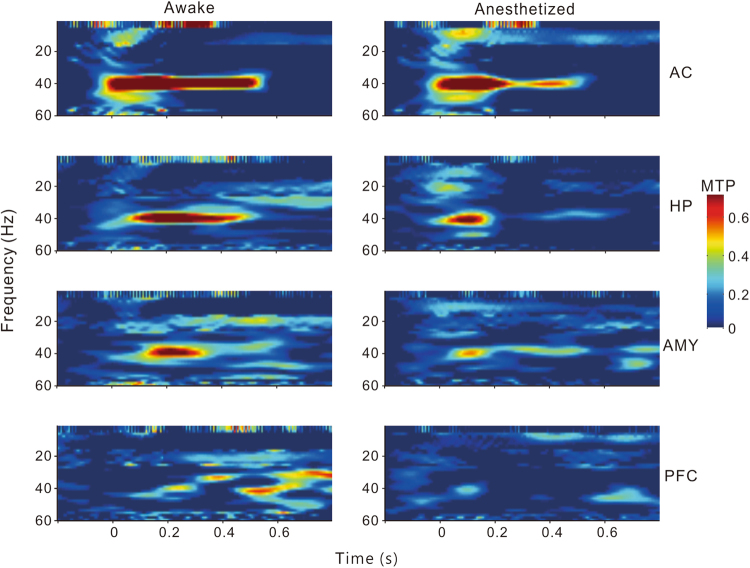
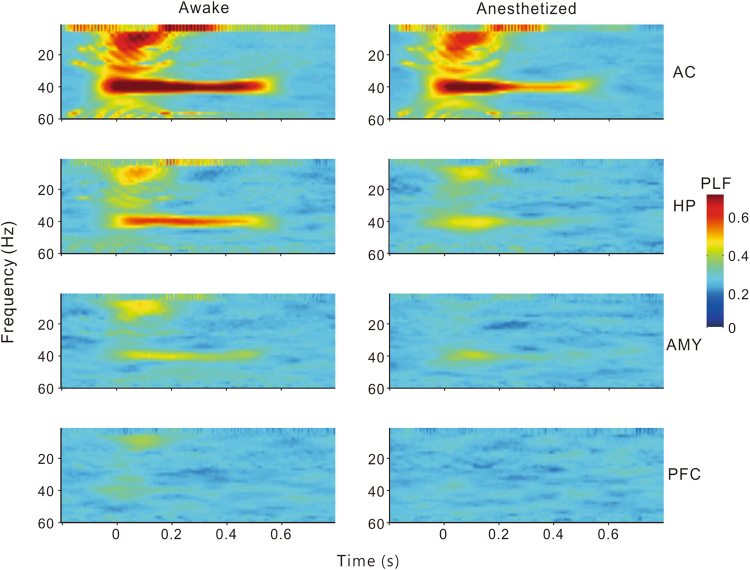
To compare the population results of different brain regions, we constructed mean time-frequency plots of MTP and PLF averaged across all the individual sites in the AC, HP, AMY, and PFC (Figs 5 and 6). It is clear that under conscious conditions the MTP and PLF were strongest in the AC, gradually decreasing in the HP and AMY, and disappearing in the PFC. Under anesthetized conditions, the MTP and PLF reduced correspondingly. Statistical analysis of the 40-Hz MTP and PLF revealed a significant difference between different brain regions (ANOVA and Tukey’s multiple comparison, p < 0.05, Fig. 7) and between the conscious and anesthetized conditions (paired t-test, p < 0.05, Fig. 7). In summary, different brain regions showed different degrees of ASSR, all of which were reduced by anesthesia.
Figure 5.
Time-frequency plot of MTP averaged across each brain region.
Figure 6.
Time-frequency plot of PLF averaged across each brain region.
Figure 7.
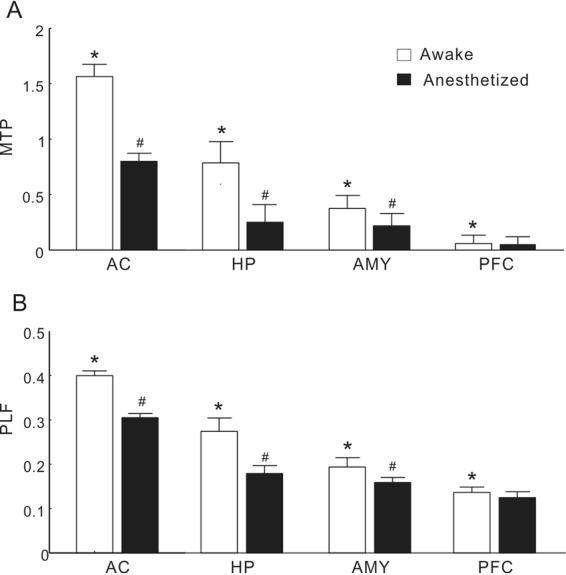
MTP (A) and PLF (B) under conscious and anesthetized conditions in different brain regions. The data are expressed as the mean ± SE. *Represents a significant difference comparing to any other brain regions under conscious conditions (P < 0.05, ANOVA with Tukey’s post hoc tests). #Represents a significant difference between conscious and anesthetized conditions in each brain region (P < 0.05, paired t-test).
Effect of anesthesia on IG
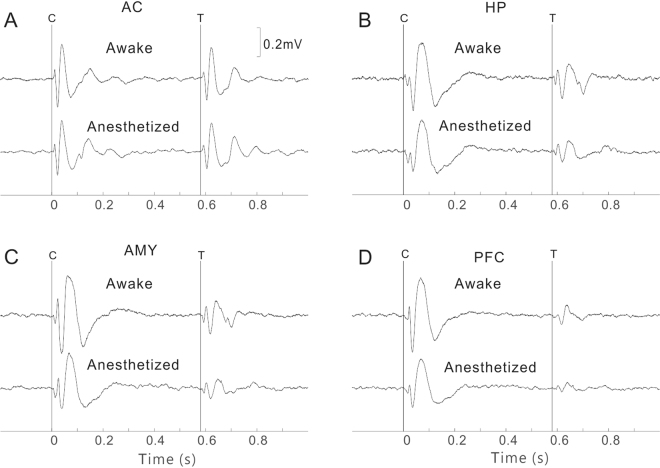
Figure 8A shows an example of the LFP evoked by sound pairs in the AC. Under conscious conditions, the amplitude of LFP evoked by T stimulus was smaller than that evoked by C stimulus, indicating an IG effect. We quantified the LFP by measuring the mean negative deflection at about 25 ms (N25) after the stimulus onset, and the mean positive deflection at about 40 ms (P40). The T/C ratio of N25 was 0.75 and that of P40 was 0.90. A T/C ratio < 1.0 reflects an IG effect. Under anesthetized conditions, the absolute amplitudes of LFP evoked by both C and T stimulus were reduced a little, but the T/C ratio of N25 and P40 remained similar (0.72 and 0.92). Examples of LFP in the HP, AMY, and PFC are presented in Fig. 8B,C and D, respectively. Under conscious conditions, the T-amp (the amplitude of T-evoked deflection) showed a remarkable tendency to decrease progressively as the recording site moved from the AC to the PFC. Another noteworthy result is that the latencies of evoked deflection were longer in the HP, AMY, and PFC than in the AC. The main negative deflection occurred at 39, 37, and 35 ms in the HP, AMY, and PFC, respectively, and the main positive deflection was at 65, 65, and 75 ms. We then calculated the T/C ratio of the main negative deflection (N35) and positive deflection (P70). The T/C ratios of N35 were 0.61, 0.50, and 0.25 in the HP, AMY, and PFC, respectively, and the T/C ratios of P70 were 0.51, 0.35, and 0.28, respectively. The decrease in the T/C ratio reflected an increase in IG effect. However, none of the T/C ratios were obviously changed by anesthesia (0.58, 0.52, and 0.21 for N35; 0.45, 0.30, and 0.23 for P70).
Figure 8.
LFPs evoked by sound pairs under conscious and anesthetized conditions in the AC (A), HP (B), AMY (C), and PFC (D). Vertical lines represent the onset of C and T stimuli.
The mean and SE of the T/C ratios in each brain region are illustrated in Fig. 9. Consistent with the observation from the individual examples, the T/C ratio gradually decreased from the AC, to the HP, AMY, and PFC. There was a significant difference between different brain regions (ANOVA and Tukey’s multiple comparison, p < 0.05). However, no significant difference between the conscious and anesthetized conditions (paired t-test, p > 0.05) could be found in any brain regions.
Figure 9.
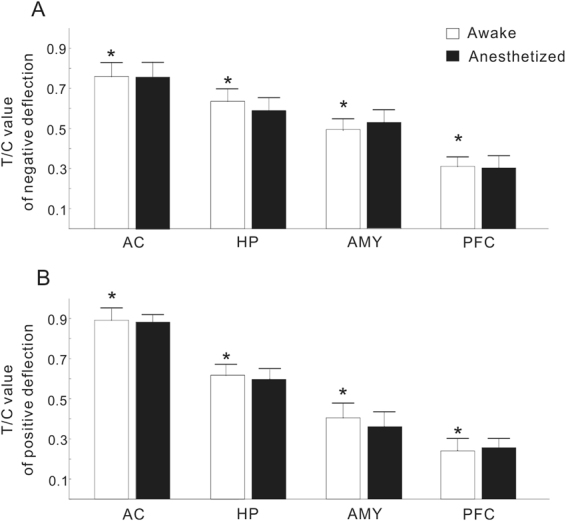
T/C values of negative (A) and positive deflection (B) under conscious and anesthetized conditions in different brain regions. The data indicate that the degrees of IG are different among different brain regions, but similar between conscious and anesthetized conditions. The data are expressed as the mean ± SE; *Represents a significant difference between any pairs of comparison of T/C values under conscious conditions (P < 0.05, ANOVA with Tukey’s post hoc test).
Discussion
The primary goal of this study was to investigate the effects of general anesthesia on the widely used electrophysiological examinations: ASSR and IG. We used microwires implanted into different brain areas to record sound-evoked LFPs, which can provide more accurate information from distinct functional areas. Our results showed that the degree of ASSR and IG varied among the AC, HP, AMY, and PFC. More importantly, we found that anesthesia had different effects on ASSR and IG.
ASSR in different brain areas
ASSR can serve as a useful tool in testing the functional state of the networks supporting neural synchrony1,2. The MTP and PLF of 40-Hz ASSR are well used in clinical examinations5,8,25. However, the generation source of ASSRs remains unclear, because most ASSRs in clinic are recorded from the human scalp using electrodes for EEG recording. The results of previous PET and fMRI studies suggest that ASSR may be generated by a widely distributed network of sources, located in cortical as well as subcortical regions25,26. In this study, we used electrodes which directly penetrated into the brain, and recorded the LFPs in both auditory and non-auditory centers. We selected the HP, AMY, and PFC because they play vital roles in advanced brain functions (memory, emotion, and motivation) and are involved in mental disorders. We found that the AC, as the primary center receiving auditory input, showed the strongest ASSR, the HP and AMY also showed a robust ASSR, but the PFC had no ASSR. This result indicates that the neural network from the auditory system also participates in ASSR. Further studies are needed to clarify whether the HP and AMY directly contribute to the generation of ASSR or just receive the ASSR spread from the auditory pathway.
Anesthetic effect on ASSR
Previous studies on surgical patients reported that the amplitude of the 40-Hz ASSR was attenuated or possibly abolished with a loss of consciousness after the application of anesthetics (thiopental, fentanyl, and isoflurane)27–30. Thus, it was proposed that the amplitude of the ASSR may be a reliable indicator of the level of consciousness28. Furthermore, studies on the effects of subanesthetic ketamine demonstrated that the amplitude of the 40-Hz ASSR was augmented by administering a low dose of ketamine, which could not cause a loss of consciousness in most human and animal subjects31,32. In this study, we used chloral hydrate to produce a general anesthesia in the rats. We only recorded the LFPs when the rats were completely unconscious, because hyperactivity during light anesthesia and the recovery period made it difficult to stably record the LFPs. Consistent with previous reports, we found that both the MTP and PLF of 40-Hz ASSR were significantly reduced by chloral hydrate induced anesthesia.
Regarding underlying mechanisms, many reports have documented that chloral hydrate potentiates the function of GABAA receptors33,34. Parvalbumin inhibitory interneurons expressing GABAA receptors have been proven to play an important role in neural synchronization in the gamma frequency range (30–80 Hz)35. Thus, the reduction in the 40-Hz ASSR may be due to the potentiation of inhibitory GABAA function induced by chloral hydrate. Alternately, chloral hydrate may also suppress the transmission of NMDA receptor-mediated glutamate34,36, which is expressed on principal excitatory neurons and critical for ASSR. The detailed cellular mechanisms are worthy of further investigation.
IG in different brain regions
In this study, we found an obvious IG effect in both the AC and in non-auditory regions. When two auditory stimuli were delivered 500 ms apart, at least some reduction in the amplitude of the response to the second stimulus was observed at all sites. However, there were clear differences in the amount of this suppression, or gating, between brain regions. The HP, AMY, and PFC, all components of the non-auditory circuit, showed significantly greater gating than did the AC. Previous electrophysiological studies on rats reported robust auditory-evoked potentials and IG in the HP37, AMY38, and PFC11. The exact anatomical sites involved in mediating sensory gating in humans have not yet been established due to the limitations in performing studies using invasive intra-cerebral electrodes. However, several studies using intracranial electrodes in patients undergoing invasive pre-surgical evaluation have showed that the HP and PFC contribute to the generation of IG39–41. Functional imaging studies on humans have also suggested involvement of the HP and PFC in the IG process42. All these results support the hypothesis that IG of auditory-evoked responses originates in the non-auditory circuit and not in the AC. In contrast, ASSR may mainly originate from the auditory pathway. Thus, our findings suggest that IG is more suited to examining the function of non-auditory regions related to high order functions (memory, emotion, and cognition).
Anesthetic effect on IG
The most surprising result of this study is that IG in all the tested regions was little affected by chloral hydrate anesthesia. The exact neural mechanism responsible for IG is not fully understood, but was proposed to be regulated by recurrent inhibitory and excitatory circuits involving multiple neurotransmitter systems43–46. GABAergic neurotransmitter systems, as primary inhibitory mechanisms, are thought to modulate the reduction in the excitatory response to the T stimulus47,48. Though chloral hydrate has an enhancive effect on the GABAergic inhibitory mechanism33,34, it can also suppress glutamatergic transmission34,36, which is postulated to produce the excitatory responses to the C stimulus45,46. Thus, as both T-amp and C-amp were reduced by chloral hydrate, the T/C ratio was less changed. It should be noted that other neurotransmitters, such as serotonin49,50, noradrenaline51,52, and acetylcholine53,54 are also expected to play a part in the IG process. The interactions between chloral hydrate and these neurotransmitter systems remains unknown. Furthermore, whether other anesthetics have similar effects on IG warrants future investigation.
In conclusion, we found that ASSR was more prominent in the auditory region, while IG was more obvious in the non-auditory regions. ASSR was obviously reduced by general anesthesia, while IG was not. These findings provide a valuable reference for the choice of electrophysiological examinations used in clinical settings.
Acknowledgements
This work was supported by the following grants: National Nature Science Foundation of China under grant (31471057 and 31671080 to LQ), Research project of Liaoning Provincial Department of Education (LK201631 to LM).
Author Contributions
Y.W. was primarily responsible for experiment procedures, data collection, and analysis; L.M. and X.W. assisted with data collection and analysis; L.Q. was primarily responsible for experimental design, data analysis, and manuscript preparation. All authors contributed to and approved of the final version of the manuscript.
Competing Interests
The authors declare no competing interests.
Footnotes
Publisher's note: Springer Nature remains neutral with regard to jurisdictional claims in published maps and institutional affiliations.
References
- 1.Lins OG, Picton TW. Auditory steady-state responses to multiple simultaneous stimuli. Electroencephalogr. Clin. Neurophysiol. 1995;96:420–32. doi: 10.1016/0168-5597(95)00048-W. [DOI] [PubMed] [Google Scholar]
- 2.Picton TW, John MS, Dimitrijevic A, Purcell D. Human auditory steady-state responses. Int. J. Audiol. 2003;42:177–219. doi: 10.3109/14992020309101316. [DOI] [PubMed] [Google Scholar]
- 3.Brenner CA, et al. Steady state responses: electrophysiological assessment of sensory function in schizophrenia. Schizophr. Bull. 2009;35:1065–77. doi: 10.1093/schbul/sbp091. [DOI] [PMC free article] [PubMed] [Google Scholar]
- 4.Brenner CA, Sporns O, Lysaker PH, O’Donnell BF. EEG synchronization to modulated auditory tones in schizophrenia, schizoaffective disorder, and schizotypal personality disorder. Am. J. Psychiatry. 2003;160:2238–40. doi: 10.1176/appi.ajp.160.12.2238. [DOI] [PubMed] [Google Scholar]
- 5.Javitt DC, Sweet RA. Auditory dysfunction in schizophrenia: integrating clinical and basic features. Nat. Rev. Neurosci. 2015;16:535–550. doi: 10.1038/nrn4002. [DOI] [PMC free article] [PubMed] [Google Scholar]
- 6.Light GA, et al. Gamma band oscillations reveal neural network cortical coherence dysfunction in schizophrenia patients. Biol. Psychiatry. 2006;60:1231–40. doi: 10.1016/j.biopsych.2006.03.055. [DOI] [PubMed] [Google Scholar]
- 7.Krishnan GP, et al. Steady state and induced auditory gamma deficits in schizophrenia. Neuroimage. 2009;47:1711–9. doi: 10.1016/j.neuroimage.2009.03.085. [DOI] [PMC free article] [PubMed] [Google Scholar]
- 8.O’Donnell BF, et al. The auditory steady-state response (ASSR): a translational biomarker for schizophrenia. Suppl. Clin. Neurophysiol. 2013;62:101–12. doi: 10.1016/B978-0-7020-5307-8.00006-5. [DOI] [PMC free article] [PubMed] [Google Scholar]
- 9.Sullivan EM, Timi P, Hong LE, O’Donnell P. Effects of NMDA and GABA-A Receptor Antagonism on Auditory Steady-State Synchronization in Awake Behaving Rats. Int. J. Neuropsychopharmacol. 2015;18:pyu118–pyu118. doi: 10.1093/ijnp/pyu118. [DOI] [PMC free article] [PubMed] [Google Scholar]
- 10.Leishman E, et al. Phencyclidine Disrupts the Auditory Steady State Response in Rats. PLoS One. 2015;10:e0134979. doi: 10.1371/journal.pone.0134979. [DOI] [PMC free article] [PubMed] [Google Scholar]
- 11.Mears RP. Klein, a C. & Cromwell, H. C. Auditory inhibitory gating in medial prefrontal cortex: Single unit and local field potential analysis. Neuroscience. 2006;141:47–65. doi: 10.1016/j.neuroscience.2006.03.040. [DOI] [PubMed] [Google Scholar]
- 12.Dolu N, Süer C, Özesmi Ç. A comparison of the different interpair intervals in the conditioning–testing P50 paradigms. Int. J. Psychophysiol. 2001;41:265–270. doi: 10.1016/S0167-8760(01)00134-9. [DOI] [PubMed] [Google Scholar]
- 13.Zouridakis G, Boutros NN. Stimulus parameter effects on the P50 evoked response. Biol. Psychiatry. 1992;32:839. doi: 10.1016/0006-3223(92)90088-H. [DOI] [PubMed] [Google Scholar]
- 14.Yee CM, White PM. Experimental modification of P50 suppression. Psychophysiology. 2001;38:531–9. doi: 10.1017/S0048577201981454. [DOI] [PubMed] [Google Scholar]
- 15.Boutros NN, Belger A. Midlatency evoked potentials attenuation and augmentation reflect different aspects of sensory gating. Biol. Psychiatry. 1999;45:917–922. doi: 10.1016/S0006-3223(98)00253-4. [DOI] [PubMed] [Google Scholar]
- 16.Boutros NN, Korzyukov O, Jansen B, Feingold A, Bell M. Sensory gating deficits during the mid-latency phase of information processing in medicated schizophrenia patients. Psychiatry Res. 2004;126:203–215. doi: 10.1016/j.psychres.2004.01.007. [DOI] [PubMed] [Google Scholar]
- 17.Gjini K, Arfken C, Boutros NN. Relationships between sensory ‘gating out’ and sensory ‘gating in’ of auditory evoked potentials in schizophrenia: a pilot study. Schizophr. Res. 2010;121:139–145. doi: 10.1016/j.schres.2010.04.020. [DOI] [PMC free article] [PubMed] [Google Scholar]
- 18.Vlcek P, Bob P, Raboch J, Press D. Sensory disturbances, inhibitory deficits, and the P50 wave in schizophrenia. Neuropsychiatr. Dis. Treat. 2014;10:1309–1315. doi: 10.2147/NDT.S64219. [DOI] [PMC free article] [PubMed] [Google Scholar]
- 19.Patterson JV, et al. P50 sensory gating ratios in schizophrenics and controls: A review and data analysis. Psychiatry Res. 2008;158:226. doi: 10.1016/j.psychres.2007.02.009. [DOI] [PubMed] [Google Scholar]
- 20.Rossi S, et al. Hypofunctioning of sensory gating mechanisms in patients with obsessive-compulsive disorder. Biol. Psychiatry. 2005;57:16–20. doi: 10.1016/j.biopsych.2004.09.023. [DOI] [PubMed] [Google Scholar]
- 21.Gjini K, et al. Evoked potential correlates of Post-Traumatic Stress Disorder in refugees with history of exposure to torture. J. Psychiatr. Res. 2013;47:1492–1498. doi: 10.1016/j.jpsychires.2013.06.007. [DOI] [PubMed] [Google Scholar]
- 22.Thomas C, et al. P50 gating deficit in Alzheimer dementia correlates to frontal neuropsychological function. Neurobiol. Aging. 2010;31:416–424. doi: 10.1016/j.neurobiolaging.2008.05.002. [DOI] [PubMed] [Google Scholar]
- 23.Paxinos, G. & Watson, C. The rat brain in stereotaxic coordinates. (Academic Press, 1986).
- 24.Roach BJ, Mathalon DH. Event-related EEG time-frequency analysis: An overview of measures and an analysis of early gamma band phase locking in schizophrenia. Schizophr. Bull. 2008;34:907–926. doi: 10.1093/schbul/sbn093. [DOI] [PMC free article] [PubMed] [Google Scholar]
- 25.Farahani ED, Goossens T, Wouters J, Wieringen A. Van. NeuroImage Spatiotemporal reconstruction of auditory steady-state responses to acoustic amplitude modulations: Potential sources beyond the auditory pathway. Neuroimage. 2017;148:240–253. doi: 10.1016/j.neuroimage.2017.01.032. [DOI] [PubMed] [Google Scholar]
- 26.Reyes SA, Lockwood AH, Salvi RJ. Mapping the 40-Hz auditory steady-state response using current density reconstructions. 2005;204:1–15. doi: 10.1016/j.heares.2004.11.016. [DOI] [PubMed] [Google Scholar]
- 27.Plourde G, Villemure C, Fiset P, Bonhomme V, Backman SB. Effect of isoflurane on the auditory steady-state response and on consciousness in human volunteers. Anesthesiology. 1998;89:844–851. doi: 10.1097/00000542-199810000-00008. [DOI] [PubMed] [Google Scholar]
- 28.Plourde G, Picton TW. Human auditory steady-state response during general anesthesia. Anesth. Analg. 1990;71:460–468. doi: 10.1213/00000539-199011000-00002. [DOI] [PubMed] [Google Scholar]
- 29.Plourde G, Boylan JF. The auditory steady state response during sufentanil anaesthesia. Br. J. Anaesth. 1991;66:683–691. doi: 10.1093/bja/66.6.683. [DOI] [PubMed] [Google Scholar]
- 30.Plourde G, Villemure C. Comparison of the effects of enflurane/N2O on the 40-Hz auditory steady-state response versus the auditory middle-latency response. Anesth. Analg. 1996;82:75. doi: 10.1097/00000539-199601000-00013. [DOI] [PubMed] [Google Scholar]
- 31.Plourde G, Baribeau J, Bonhomme V. Ketamine increases the amplitude of the 40-Hz auditory steady-state response in humans. Br J Anaesth. 1997;78:524–529. doi: 10.1093/bja/78.5.524. [DOI] [PubMed] [Google Scholar]
- 32.Sivarao DV, et al. 40 Hz Auditory Steady-State Response Is a Pharmacodynamic Biomarker for Cortical NMDA Receptors. Neuropsychopharmacology. 2016;41:2232–2240. doi: 10.1038/npp.2016.17. [DOI] [PMC free article] [PubMed] [Google Scholar]
- 33.Garrett K, Gan J. Enhancement of gamma-aminobutyric acidA receptor activity by alpha-chloralose. J. Pharmacol. Exp. Ther. 1998;285:680–686. [PubMed] [Google Scholar]
- 34.Lovinger DM, Zimmerman SA, Levitin M, Jones MV, Harrison NL. Trichloroethanol potentiates synaptic transmission mediated by gamma-aminobutyric acidA receptors in hippocampal neurons. J. Pharmacol. Exp. Ther. 1993;264:1097. [PubMed] [Google Scholar]
- 35.Sohal VS, Zhang F, Yizhar O, Deisseroth K. Parvalbumin neurons and gamma rhythms enhance cortical circuit performance. Nature. 2009;459:698–702. doi: 10.1038/nature07991. [DOI] [PMC free article] [PubMed] [Google Scholar]
- 36.Kreuter JD, Mattson BJ, Wang B, You ZB, Hope BT. Cocaine-induced Fos expression in rat striatum is blocked by chloral hydrate or urethane. Neuroscience. 2004;127:233. doi: 10.1016/j.neuroscience.2004.04.047. [DOI] [PubMed] [Google Scholar]
- 37.Moxon KA, et al. Multiple single units and population responses during inhibitory gating of hippocampal auditory response in freely-moving rats. Brain Res. 1999;825:75–85. doi: 10.1016/S0006-8993(99)01187-7. [DOI] [PubMed] [Google Scholar]
- 38.T HCC, Anstrom K, Azarov A, Woodward DJ, Cromwell HC. Auditory inhibitory gating in the amygdala: single-unit analysis in the behaving rat. Brain Res. 2005;1043:12–23. doi: 10.1016/j.brainres.2005.01.106. [DOI] [PubMed] [Google Scholar]
- 39.Boutros NN, et al. Sensory gating in the human hippocampal and rhinal regions. Clin. Neurophysiol. 2005;116:1967–1974. doi: 10.1016/j.clinph.2005.04.017. [DOI] [PubMed] [Google Scholar]
- 40.Grunwald T, et al. Neuronal substrates of sensory gating within the human brain. Biol. Psychiatry. 2003;53:511–9. doi: 10.1016/S0006-3223(02)01673-6. [DOI] [PubMed] [Google Scholar]
- 41.Korzyukov O, et al. Generators of the intracranial P50 response in auditory sensory gating. Neuroimage. 2007;35:814–26. doi: 10.1016/j.neuroimage.2006.12.011. [DOI] [PMC free article] [PubMed] [Google Scholar]
- 42.Tregellas JR, et al. Increased hemodynamic response in the hippocampus, thalamus and prefrontal cortex during abnormal sensory gating in schizophrenia. Schizophr Res. 2007;92:262–272. doi: 10.1016/j.schres.2006.12.033. [DOI] [PMC free article] [PubMed] [Google Scholar]
- 43.Miller CL, Freedman R. Medial septal neuron activity in relation to an auditory sensory gating paradigm. Neuroscience. 1993;55:373. doi: 10.1016/0306-4522(93)90506-B. [DOI] [PubMed] [Google Scholar]
- 44.Ruyter KW, Førde R, Norheim OF. The activity of hippocampal interneurons and pyramidal cells during the response of the hippocampus to repeated auditory stimuli. Neuroscience. 1995;69:371. doi: 10.1016/0306-4522(95)00249-I. [DOI] [PubMed] [Google Scholar]
- 45.Moxon KA, Gerhardt GA, Adler LE. Dopaminergic modulation of the P50 auditory-evoked potential in a computer model of the CA3 region of the hippocampus: its relationship to sensory gating in schizophrenia. Biol. Cybern. 2003;88:265–275. doi: 10.1007/s00422-002-0372-8. [DOI] [PubMed] [Google Scholar]
- 46.Flach KA, et al. Sensory gating in a computer model of the CA3 neural network of the hippocampus. Biol. Psychiatry. 1996;40:1230–1245. doi: 10.1016/0006-3223(95)00624-9. [DOI] [PubMed] [Google Scholar]
- 47.Ma J, Leung LS. GABA B receptor blockade in the hippocampus affects sensory and sensorimotor gating in Long-Evans rats. Psychopharmacology (Berl). 2011;217:167. doi: 10.1007/s00213-011-2274-8. [DOI] [PubMed] [Google Scholar]
- 48.Tsai ML, et al. Long-lasting auditory gating deficit accompanied by GABA(B) receptor dysfunction in the hippocampus after early-life limbic seizures in rats. Physiol. Behav. 2012;106:534–541. doi: 10.1016/j.physbeh.2012.03.033. [DOI] [PubMed] [Google Scholar]
- 49.Adler LE, et al. Improved P50 Auditory Gating With Ondansetron in Medicated Schizophrenia Patients. Am. J. Psychiatry. 2005;162:386–388. doi: 10.1176/appi.ajp.162.2.386. [DOI] [PubMed] [Google Scholar]
- 50.Mann C, et al. Differential effects of acute serotonin and dopamine depletion on prepulse inhibition and p50 suppression measures of sensorimotor and sensory gating in humans. Neuropsychopharmacology. 2008;33:1653–1666. doi: 10.1038/sj.npp.1301556. [DOI] [PubMed] [Google Scholar]
- 51.Adler LE, et al. Yohimbine impairs P50 auditory sensory gating in normal subjects. Neuropsychopharmacol. Off. Publ. Am. Coll. Neuropsychopharmacol. 1994;10:249. doi: 10.1038/npp.1994.28. [DOI] [PubMed] [Google Scholar]
- 52.Stevens KE, Meltzer J, Rose GM. Disruption of sensory gating by the alpha 2 selective noradrenergic antagonist yohimbine. Biol. Psychiatry. 1993;33:130–132. doi: 10.1016/0006-3223(93)90313-3. [DOI] [PubMed] [Google Scholar]
- 53.Hori Y, Murata A, Takahashi R, Suzuki S. Effects of nicotine on the amplitude and gating of the auditory P50 and its influence by dopamine D2 receptor gene polymorphism. Neuroscience. 2010;166:145. doi: 10.1016/j.neuroscience.2009.11.053. [DOI] [PubMed] [Google Scholar]
- 54.Adler LE, et al. Schizophrenia, sensory gating, and nicotinic receptors. Schizophr. Bull. 1998;24:189–202. doi: 10.1093/oxfordjournals.schbul.a033320. [DOI] [PubMed] [Google Scholar]
Associated Data
This section collects any data citations, data availability statements, or supplementary materials included in this article.
Data Availability Statement
The datasets generated during and analyzed during the current study are available from the corresponding author on reasonable request.


