Abstract
Multiple patterns and intraspecific polymorphism should not persist in mutualistic Müllerian systems due to purifying and frequency-dependent selection, but they are commonly identified in nature. We analysed molecular phylogeny and reconstructed dispersal history of 58 species of Dilophotes (Coleoptera: Lycidae) in Asia. Dilophotes colonized the Great Sundas and Malay Peninsula where they joined extensive mimetic communities of net-winged beetles. We identified the brightly bi-coloured males and females which adverged on five occasions to different autochthonous models. This is the first described case of Müllerian sexual dimorphism based on sex-specific body size. We propose that the constraint, i.e. the conservative sexual size dimorphism, forced the unprofitable prey to such complex adaptation in a multi-pattern environment. Although mimetic sexual dimorphism has frequently evolved in Dilophotes, a single pattern has been maintained by both sexes in multiple closely related, sympatrically occurring species. Some patterns may be suboptimal because they are rare, crudely resemble co-mimics, or are newly evolved, but they persist in Müllerian communities for a long time. We assume that failure to closely resemble the most common model can increase the diversity of large Müllerian communities and produce mimetic dimorphism.
Introduction
The Müllerian mimicry model describes an anti-predatory strategy of unprofitable prey, which expresses a warning signal to potential predators1. Numerous studies predicted the mutualistic evolution of a single warning pattern and strong selection against rare forms in Müllerian systems1–5. In contrast with the simplicity of Müller’s original model, common deviations can be identified in nature. Müllerian systems contain multiple aposematic patterns2, imperfect mimics6–8, and intraspecific polymorphism9–13. Many adaptive processes have been proposed to explain the unpredicted phenomena, among them the selection for a general pattern7,14, relaxed selection due to the cognitive capacity of predators8,14,15, and the high costs of error preventing attacks on all crudely matched individuals8,14. Further, the existence of Müllerian multi-pattern complexes can be explained by locally relaxed predation due to the absence of predators16, adaptive neophobia17, and micro-habitat partition of both predator and prey populations18–20. These adaptive factors can explain survival of imperfect mimics as well as presence of multiple patterns in a single locality due to relaxed negative selection. The non-adaptive hypotheses include drift and constraints including an evolutionary time-lag8,21,22, but without any further evidence. These non-adaptive factors are responsible for the continuous origins of new, divergent and imperfect mimics and they define time needed for the exclusion of some aposematic patterns. Even under strong purifying selection, some co-mimics remain only crudely similar and imperfect mimicry is often observed6–8, possibly due to the interplay between all above described factors.
As an additional factor in the evolution of mimicry, we need to consider if all unprofitable prey develop the common aposematic pattern through convergence as originally hypothesized1 or advergence23. Advergence assumes that a new, usually rare aposematically coloured prey unilaterally adopts a previously established Müllerian aposematic signal. Advergence can start with the dispersal of the originally allopatric unprofitable prey, represented by a low number of individuals, to an area with an extensive autochthonous Müllerian system. The additional member joins the ring with a time delay which depends on selection against rare forms24–26 and the capability to adopt locally dominant aposematic pattern24–26. We may suppose that dynamic changes of distribution can lead to the contact between two unpalatable preys with different aposematic signal. The mathematical models and laboratory experiments1,27 have not considered the constraints in evolution of multi-pattern Müllerian mimetic communities. Dated phylogenies can potentially identify the delayed evolution of pigments and mimetic patterns and identify the gradual increase in numbers of species sharing individual mimetic patterns. Such phylogenies have been constructed for some clades of Müllerian mimics28,29, but never for net-winged beetles (Coleoptera: Lycidae).
Here, we study the phylogeny of Dilophotes, one of several dozens of aposematically coloured net-winged beetle genera occurring in eastern and southeastern Asia30,31. All net-winged beetles are unprofitable32 and their protection can be easily identified in the field as they pungently smell and spontaneously bleed when disturbed (Fig. S1E). These unprofitable beetles form complex multi-pattern Müllerian systems, especially in the tropical rainforest of South East Asia, where hundreds of aposematically coloured net-winged beetles occur. Dilophotes represents a promising model group for the study of mimicry. Its origin was dated to the Upper Cretaceous30, the genus is widespread, and currently there are 61 formally described species (Fig. S2). Due to limited sclerotization of their body, all net-winged beetles are poor dispersers and they only slowly expand their ranges33. The net-winged beetle fauna shows high turnover in individual mountain ranges and volcanoes and most species are known only from a single mountain range34. Additionally, net-winged beetles are common only in humid mountain habitats. As a consequence, highly diverse communities typically occur within a very small altitudinal span, usually from 1000–1800 m above sea level, and the turnover among individual mountain ranges and volcanoes is almost complete11,35. The communities of net-winged beetles are composed of a relatively high number of species, which supposedly share a long common evolutionary history30. The co-mimics of Dilophotes include Libnetis (Libnetini; ~300 species in the Great Sundas and the Malay peninsula), Plateros (Platerodini; ~500 spp.), Cautires, Xylobanus (Metriorrhynchini; ~600 spp.), and several smaller genera with ~300 species in total. Most of them are more common than Dilophotes and occur in high numbers over the entire region.
We set the origins of mimetic patterns of Dilophotes in a phylogenetic context and investigated the adoption process of various patterns and the variability of evolutionary strategies. Specifically, we focused on the absence of some colour patterns in subclades of Dilophotes and dated the origins of distinct colour patterns. Our study identifies the multiple origins of unique sexual colour dimorphism and sexual size dimorphism as a factor potentially responsible for the evolution of such a complex mimetic system.
Results and Discussion
Our dataset of unprofitable aposematic Dilophotes (Coleoptera: Lycidae; Fig. 1) contains 58 species from continental Asia, the Sunda Islands, and the Philippines (Table S1, Figs 2, S2). The origin of the Dilophotes clade is estimated to have been in Indo-Burma ~79 million years ago (mya) with dispersals to the south several times in the last 35 my (Figs 3A–5A). All species have geographically restricted ranges, typically a single island or a mountain system on the continent with several endemic species syntopically occurring in each locality (Fig. S1B). Dispersal events are rare and species coexist in the same area for long periods.
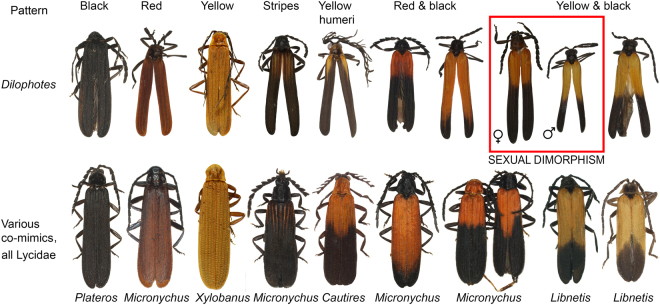
Figure 1.
Aposematically coloured net-winged beetles. Photographs © Authors.
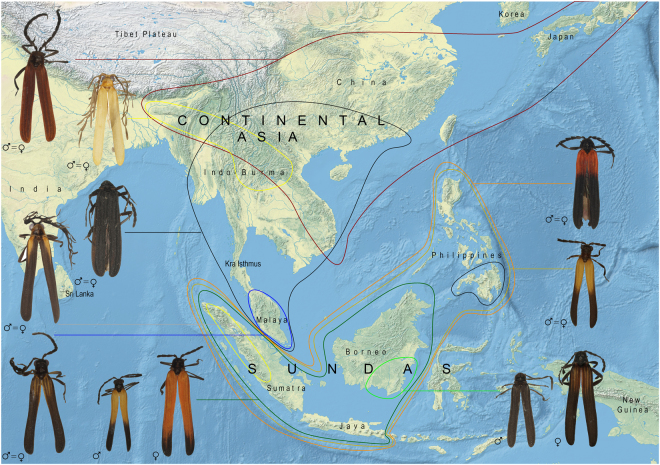
Figure 2.
Distribution of mimetic patterns of Dilophotes. The map was downloaded from Natural Earth server (http://www.naturalearthdata.com) and edited using Adobe Photoshop CS6 (http://www.adobe.com/products/photoshop.html).
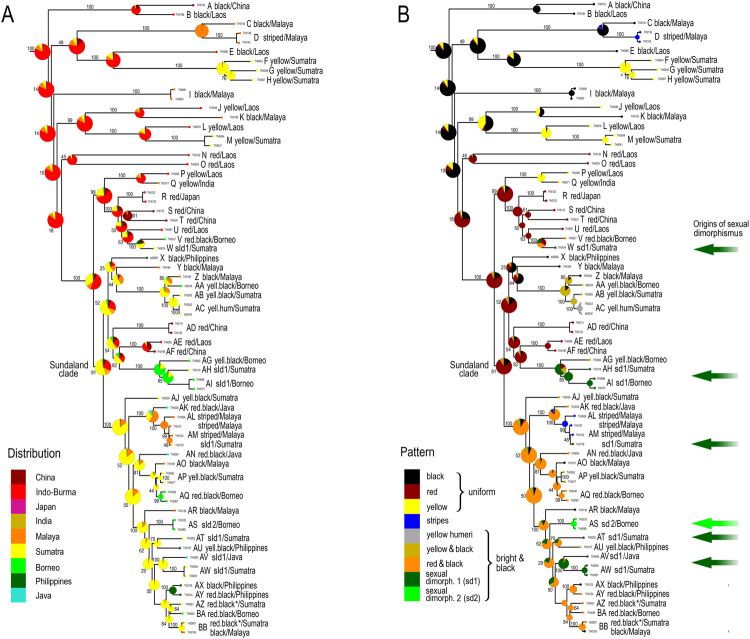
Figure 3.
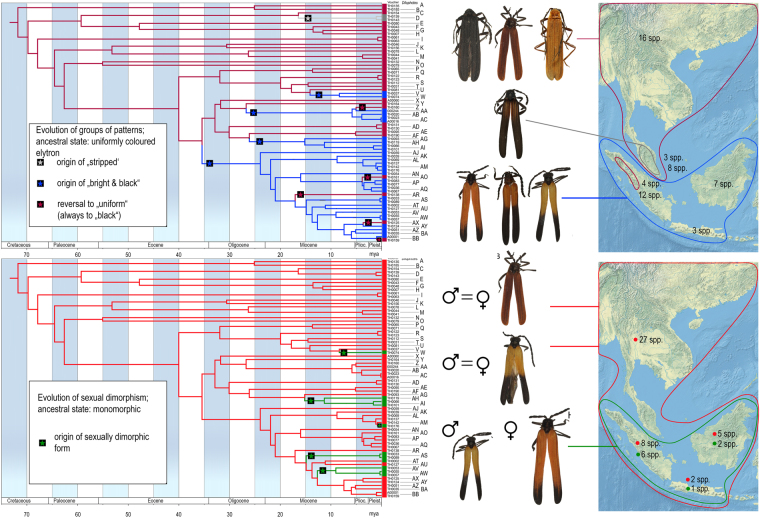
Phylogenetic reconstruction of ancestral states: (A) geographic origin; (B) colour patterns.
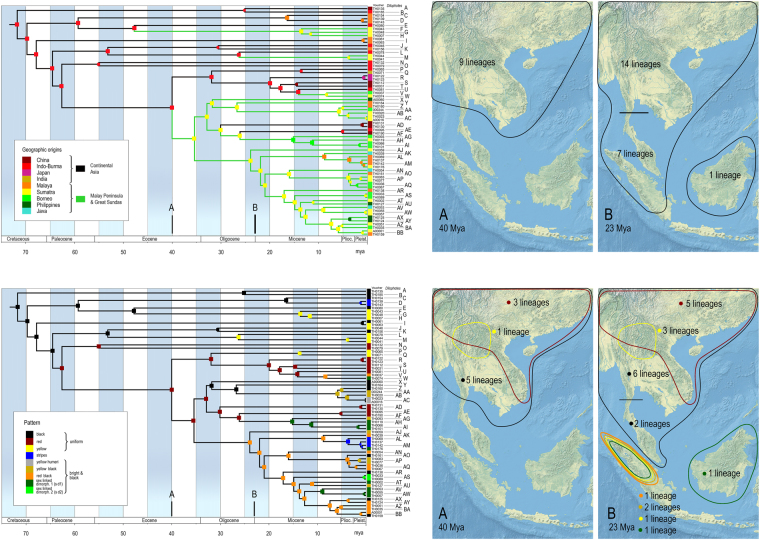
Figure 5.
(A) Distribution of Dilophotes in the Upper Eocene and at the Oligocene/Miocene boundary; (B) Presence and distribution of aposematic patterns in the Upper Eocene and at the Oligocene/Miocene boundary. The map was downloaded from Natural Earth server (http://www.naturalearthdata.com) and edited using Adobe Photoshop CS6 (http://www.adobe.com/products/photoshop.html).
Diversity and origins of patterns in Müllerian rings
The observed colour patterns were classified into seven discrete types shared by both sexes: the patterns ‘black’, ‘red’, and ‘yellow’ have uniformly coloured upper sides of the body, i.e. pronotum and elytra. Further, we identified ‘striped’, ‘yellow humeri’, ‘yellow & black’, and ‘red & black’ patterns, which have bi-coloured elytra (Figs 1 and 2). Surprisingly, we identified two combinations of different patterns in conspecific males and females. These sexually dimorphic patterns are represented by ‘yellow & black’ males and ‘red & black’ females (sexual dimorphism type 1, ‘sd1’) or ‘black’ males and ‘striped’ females (‘sd2’). There are multiple syntopically occurring aposematically coloured species of other net-winged beetles. They belong to several different subfamilies and tribes and are distantly related30 (Fig. 1).
The colouration of Dilophotes is diverse. Up to five pattern shifts were inferred in an ancestor-descendent lineage, i.e., the sequence of splits from the deepest diversification event to the splits between extant species (Fig. 3). The number of patterns increased steadily over time; almost half of the species pairs contains terminals belonging to different mimetic patterns (as species pair we consider two extant species which share a single most common recent ancestor which is not shared by any other extant species in the analysis; most species pairs represent very closely related species, see Figs 3, S4; it is possible that some additional species will be discovered which will be more related to one of considered species than to the other, see Fig. S1A for comparison of formally described and analysed diversity).
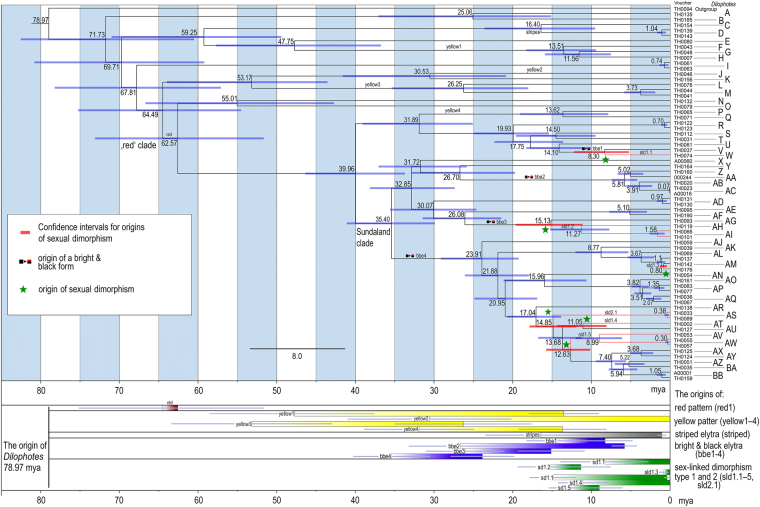
Mimetic patterns evolved gradually. The reconstruction of colour patterns shows that a black colouration was already present in Indo-Burma ~79 mya (Figs 3–6). The ‘black’ type does not represent a typical aposematic pattern as many palatable insects are black-coloured and most unprofitable insects are brightly coloured. We suppose that the body shape and size presumably are the salient optical warning signals27 (compare the body shape of the Zygaenidae moth and Lyropaeus net-winged beetle in Fig. S1A,B). We assume that distinctiveness has an aposematic function when prey is observed against a clear sky because the high contrast makes it easily recognisable36,37 (Fig. S3E). The ancestrally ‘black’ clades gave rise to the ‘yellow’ pattern in Indo-Burma and Sumatra. The distinctiveness of the ‘yellow’ pattern is conditional38: these beetles are very conspicuous if sitting on the upper side of a leaf due to the high contrast37 with dark green leaves under the tropical forest canopy. Conversely, they are much less conspicuous, at least to a human observer, if an individual sits on the bottom side and is observed against a clear sky (unpublished field observation). This pattern is displayed by all brightly uniformly coloured Dilophotes south of the Kra Isthmus. The single origin of a red pigment occurred ~63 mya in Indo-Burma, 16 mya after the origin of Dilophotes (Fig. 3). Red-coloured Dictyopterinae, an old cosmopolitan lineage31 with the stem age of the clade of red-coloured taxa inferred at 90.1 ± 2.2 mya30, could be considered a potential model for uniformly ‘red’ Dilophotes. The ‘red’ pattern is currently limited to its ancestral area and was lost by all lineages dispersing to the south, i.e. to the Malay Peninsula and the Great Sundas. The first origin of the ‘bright & black’ forms was dated to 35.4 mya, long after the origin of the ‘red’ pattern and three other origins are substantially younger (8.3–14.1 mya, Figs 4–6). The ‘bright & black’ pattern is dominant in the Sundaland net-winged beetles (Fig. 1, the dominance is based on the proportion of ‘bright & black’ individuals in the studied sample and on the observation in the field, see Fig. S1B and Table S4). The bi-coloured pattern never evolved in the ancestral area of the “red” pattern and we suppose that its evolution was forced by the presence of many species of bi-coloured net-winged beetles in the Greater Sunda Islands where Dilophotes dispersed (Fig. 2A).
Figure 6.
(A) Evolution of ‘uniform’ and ‘bright & black’ patterns; (B) Evolution of sexually dimorphic patterns. The map was downloaded from Natural Earth server (http://www.naturalearthdata.com) and edited using Adobe Photoshop CS6 (http://www.adobe.com/products/photoshop.html).
Figure 4.
Dated tree with mean times of origin and 95% confidence intervals.
Information about the pigments of elateroid beetles is scarce39, but we may hypothesize, based on information from other beetles, that melanins are responsible for black and yellow and pterins for red colouration. The ‘yellow’ pattern can be easily produced when the concentration of melanins is decreased and four origins of the ‘yellow’ pattern were identified (Fig. 3). Conversely, the acquisition of a different pigment is necessary for red colouration and we identified a single origin of the ‘red’ pattern (Fig. 3).
The ‘bright & black’ pattern evolved four times, always within the ancestrally ‘red’ clade, and never in two other deeply rooted ancestrally ‘black’ lineages also occurring in Sumatra (Fig. 2). The number of analysed species is low, therefore the scenario of gradual acquisition of aposematic patterns should be demonstrated in further lineages. The evolution of a bright and contrasting patterns, generally considered as more effective40–44 and easily memorable45,46, seems to be a hurdle on the trajectory to an effective signal. Although field experiments testing the effectiveness of individual pattern signalling unpalatability are not available for Dilophotes, or any other net-winged beetle, we can compare the observed evolution of aposematic patterns with suggestions from experiments with artificial prey47. If similar processes are hypothesised, then the ‘uniform’ patterns are weaker, i.e. less conspicuous or less memorable, than ‘bright & black’ patterns36,37,44,47–49.
Origin of sexual dimorphism
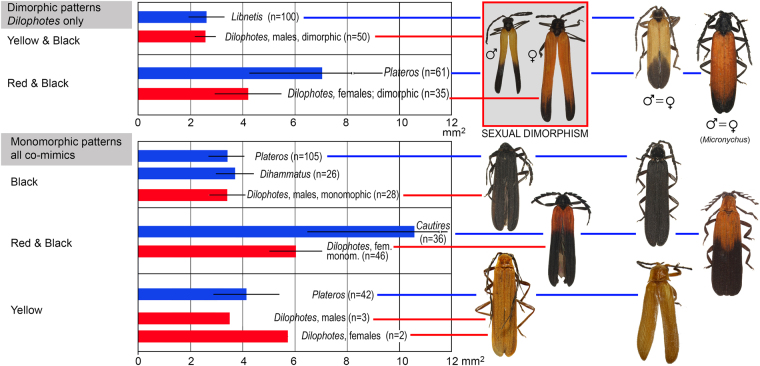
The theory predicts monomorphism for unprofitable mimetic prey, and the known cases of intraspecific polymorphism have involved geographical and micro-habitat forms9 as in the cases of polymorphic syntopically occurring Müllerian mimics in butterflies10 and also in recently reported net-winged beetles11–13. In Dilophotes, we report intraspecific sexual dimorphism with males and females resembling different syntopically occurring models (Fig. 1). The sex-dimorphic form ‘sd1’ evolved five times (15.0–0.8 mya) within the ancestrally ‘bright & black’ clades in the Sundas (Figs 2, 3). The complexity of copying different models by each sex is indicated by the close similarity of males, but only the crude similarity of females to all putative models (Fig. 1). The small-bodied males (elytron, 5.02 ± 0.80 mm2) closely resemble the body size of Libnetis and Plateros, most of which are yellow and black if brightly coloured (Fig. 1). The females of Dilophotes are larger (6.31 ± 1.02 mm2, Table S2) and resemble ‘red & black’ Micronychus, Cautires, Plateros etc., but their similarity is imperfect, as they are regularly smaller than their models (Fig. 7). This system shows that Dilophotes has constrained body size and both sexes cannot closely copy the large body size of the dominant ‘bright & black’ syntopically occurring net-winged beetles. Nevertheless, Dilophotes never adopted a general pattern14,15, i.e. an intermediate imperfect pattern which can be assigned to several distinct sympatric patterns and we observe the incentive of males to be closely similar to a local model1,5 (Figs 1, 7). Additionally, similar intraspecific sexual dimorphism ‘sd2’ was identified in a single species from southern Borneo. Only a few individuals are available from a single area, therefore, these divergent male and female phenotypes cannot be studied in detail (Figs 2, 3B).
Figure 7.
Average body size of Dilophotes and their co-mimics (n = number of measured individuals).
We inferred advergence as the principal mode of building Müllerian rings with the roles of a ‘mimic’ and a ‘model’, despite both being equally protected23. Such a process is robustly supported in sexually dimorphic species. The alternative explanation is simultaneous convergence of three species which are not brightly coloured and as a result the first species adopts ‘red & black’ pattern, the second species adopts ‘yellow & black’ pattern and the third species becomes dimorphic with ‘red & black’ females and ‘yellow & black’ males. We consider such process improbable. Comparing a low proportion of Dilophotes in mimetic communities and their age with the diversity, age, and distribution of putative models31, we assume that the first dispersing Dilophotes already met aposematically coloured autochthonous models and were selected for similarity with them50–52.
Diversity of aposematic patterns in Müllerian rings of Dilophotes
We noted that closely related lineages of aposematically coloured Dilophotes (Fig. 2) often belong to different mimetic rings even when they are the members of a single community. We assumed that all these species were in close interaction with other unprofitable net-winged beetles in their communities. As stated above, the net-winged beetles are common in Asia only in lower montane forests; they have small ranges limited to mountain ranges and individual volcanoes, and the turnover among localities is almost complete (Fig. S2). Additionally, the different mimicry patterns were commonly recorded together in net-winged beetle aggregations in the field (e.g. the aggregation described in the Supplementary Text). Although we cannot exclude some microhabitat fragmentation as in butterflies18–20, all individuals included in this study were collected together with other syntopically occurring net-winged beetles displaying various aposematic patterns.
As an example we can describe origins and distribution of monomorphic and dimorphic species. We identified seven sex-dimorphic species (Fig. 2) and thirteen monomorphic species ‘bright & black’ species in the Greater Sundas. All these species are closely related (Fig. 3) and belong to the Sundaland clade of morphologically uniform species. The recorded aposematic patterns include: (A) Both sexes adverged to the small-bodied ‘yellow & black’ pattern. The model, i.e. Libnetis spp., is small-bodied (Fig. 7) and we assumed that only males and small-bodied females of Dilophotes are perfect mimics. As net-winged beetles do not feed in the adult stage31, small-bodied females may produce a lower mass of eggs53 and advergence to small-bodied co-mimics may incur costs14. (B) Both sexes adopted the ‘red & black’ pattern. All males and even the largest females are much smaller than their ‘red & black’ co-mimics and they are imperfect mimics (Fig. 7). Therefore, both sexes will potentially suffer a higher predation rate5. (C) The males adverged to the ‘yellow & black’ pattern and the females to the ‘red & black’ pattern (body-size defined sexual dimorphism). The females can increase their body size, i.e. avoid lower fecundity predicted under scenario A; the male is a perfect mimic and does not experience a negative effect on fitness. Such a strategy, although not perfect due to the imperfect similarity of females, evolved on five occasions (Fig. 7).
The delayed evolution or inaccessibility of a local pattern in Müllerian systems has not been considered in theoretical models nor has it been shown by experiments, although such factors can substantially affect the structure of Müllerian communities. The adoption of the ‘red’ pattern took millions of years; most ancestrally black clades never evolved the contrasting ‘bright & black’ pattern which evolved only in ancestrally ‘red’ subclades (bce1–4, Fig. 3). Similarly, sexual dimorphism evolved only in the ancestrally ‘bright & black’ clade with a 10–20 my delay after the colonization of the Sundas. Five origins of ‘sd1’ in the last 15 mya, including one very recent, support the continual adoption of sexual dimorphism (Figs 3–6). Conversely, many ancestrally ‘bright & black’ Dilophotes have remained monomorphic, despite their presence in an area with ‘bright & black’ co-mimics for about 13 my and undoubtedly being at least periodically exposed to a similar selective pressure. We suppose that they were following a suboptimal strategy being unable to closely resemble the most common syntopic mimicry model or having lower fecundity due to small female body size. Further, one species evolved a new, unique colour pattern, ‘yellow humeri’, which does not match any co-mimic (Fig. 1), probably profiting only from some level of protection in a multi-pattern community43,54 or due to some level of neophobia among predators55. One species evolved the sex-dimorphic pattern ‘sd2’ (Fig. 3B). Hence, a large part of Dilophotes missed the opportunity to join the dominant ‘red & black’ Müllerian ring containing hundreds of species, which should provide the strongest protection56. The described distribution of aposematic pattern opens the question why closely related species living within a single community follow different strategies. We might consider the mosaic structure of the environment and dynamic changes of the environment and niche structure (climate, altitudinal changes, stochastic fluctuations in abundance of co-mimetics, etc.). These factors are adaptive. Similarly, non-adaptive constraints may affect the structure of Müllerian communities: e.g., the delayed origin of colour pigments or different body size resulting in imperfect resemblance. We assume that these processes might be responsible for the high number of aposematic patterns in a single community. Our study is limited by Dilophotes as a model, a single geographical region and rareness of these Müllerian mimics. Our hypotheses are based on empirical observation and should be tested by theoretical models which should include a high number of interacting species forming extensive networks57,58 affected by dynamically changing selective processes due to fluctuating abundance of individual members. The models should also consider different rates of evolution of at least several traits important in signalling unpalatability, e.g., the body size, shape, and colouration.
Conclusion
Sexual dimorphism has never been predicted by theoretical models of Müllerian mimicry, which do not consider constraints or the long-term character of adaptive processes. In some Dilophotes, both sexes are aposematically coloured, but they follow different models. The described system supports the adaptive character of Müllerian mimicry2, but instead of coevolution suggests dominant advergence in the gradually expanding multi-pattern communities. Under such conditions, the described evolution of the unique sexual dimorphism is strong evidence for the role of different male and female body sizes during the adoption of syntopically occurring mimicry patterns. The inferred delayed evolution of individual mimetic patterns (Figs 4, 5B, 6A,B), adoptions of uncommon and weak mimetic signals37,47,48,58,59, the evolution of a new pattern1, and their persistence (Figs 2, 4) suggest the possibility that multiple factors affect the coexistence of aposematic patterns in Müllerian communities.
Methods
Sampling and morphology
Over 700 adult Dilophotes were collected from 28 localities across continental Asia, the Great Sundas, and the Philippines from 1991–2012 (Fig. S2). The species were identified algorithmically using DNA data and tested using morphological divergence (putative species are marked with uppercase codes and merged putative species, i.e. which did not differ morphologically, with lowercase codes added). Altogether 196 individuals representing all colour patterns and 58 species (Table S3) from the sampled localities were analysed using previously reported protocols30 (Table S4); 29 additional samples represented outgroups (Table S1). The length of the elytron (EL) and width at humeri (WH) were measured and the surface of the elytron (EL*WH) was counted for all analysed specimens and sympatrically occurring lycid co-mimics to estimate sexual size dimorphism. The surface was used as a proxy for the size-dependent strength of an aposematic signal (Table S2, Fig. 3B). Colouration of the pronotum and elytra was recorded and colour patterns were grouped into nine arbitrary categories further used in the reconstruction of ancestral states (Table S2, Figs 1, 2 and S3).
Phylogenetic analyses
The sequences of three mtDNA fragments were produced: 780 bp of the large subunit ribosomal mtDNA (rrnL) with tRNA-Leu and a fragment of NADH dehydrogenase 1 (nad1); 1100 bp fragment of cytochrome oxidase 1 mtDNA (cox1), tRNA-Leu gene, and cytochrome oxidase 2 (cox2); and 1180 bp of NADH dehydrogenase 5 mtDNA (nad5) and adjacent tRNAs (fragments are referred as rrnL, cox1, and nad5 further, Table S5).
The fragments were aligned using MAFFT 7.2 (Q-INS-I algorithm)60 under default parameters and the protein coding fragments were checked for reading frames. The concatenated matrices were analysed under the likelihood criterion using RAXML 7.2.361,62 with the model identified by jModelTest 263 using the AIC criterion. The dataset was partitioned by genes and codon positions (Table S5) and analysed with 1,000 bootstrap replicates under the GTRCAT substitution model61. The dataset was also analysed using MrBayes 3.1.264. The MCMC was set with independent parameters for the same partitions as above, under the general time reversible model with a category of invariant sites and gamma distributed rates (GTR + I + G). Four chains were run simultaneously for 6 × 10⁷ generations, with trees being sampled every 10,000 generations; all fragments were partitioned and unlinked. The pre-stationary phase was identified using Tracer 1.665.
Due to the poor taxonomic state, species were identified algorithmically using the general mixed Yule-coalescent (GMYC) model66 and the results were evaluated using the morphology of the male genitalia. The GMYC approach applies the threshold time to separate species determined from an ultrametric tree. We used the algorithm implemented in the SPLITS package for R (http://r-forge.r-project.org/projects/splits/; 2009)66. The ultrametric tree was produced using the all-data matrix (Table S1) and the same settings as in the BEAST analysis of the pruned dataset (below).
Estimation of divergence times
The pruned and complete trees were dated using a Bayesian approach implemented in BEAST 1.8.267. The first analysis was performed with one representative per species and population (Table S1) and set to HKY + I + G proposed as the second-best model (the analyses using the GTR + I + G model did not converge)63, Relaxed Clock: Uncorrelated Lognormal, the Tree Model to a Speciation: Birth-Death Process and were set to 50 million generations with sampling every 2,500 generations with the first 25% of trees discarded as burn-in. The genes and codon positions were partitioned (Table S5) and each partition was provided with its own parameters. Because the fossil record is poor for net-winged beetles, we used information on the mtDNA rate in Coleoptera to calibrate topology. We used a mean rate of 0.0115 substitutions per site per million years per lineage, subs/s/my/l) for cox168, 0.0167 subs/s/my/l for nadh569, and 0.0054 subs/s/my/l for rrnL70. The conclusions depend more on the inference of the gradual evolution of the individual mimicry patterns than on detailed timing, therefore we considered the calibration sufficient for the purposes of this study. We set the ucld.mean with a normal distribution. The best topology recovered from the ML analysis (Fig. S1) was fixed by the guiding tree and switching off trees operators during analysis67. Convergence was assessed in Tracer 1.665 and the first 1.25 × 10⁷ generations were set as burn-in.
Ancestral area and colour pattern reconstructions
Discrete phylogeographic reconstructions were performed using the ‘Discrete traits’ function in BEAST 1.8.268 on the pruned dataset. To reconstruct the ‘Ancestral area’ character, each species was assigned to one of the following states: China, Laos/Thailand, Japan, Northern India, Malay Peninsula, Sumatra, Borneo, the Philippines, or Java. Three reconstructions of colour pattern evolution were performed in the same way with (A) ‘elytral colouration’ states: ‘uniform’, ‘striped’, and ‘bright & black’, (B) ‘mimetic pattern’: monomorphic and dimorphic; and (C) ‘colouration pattern’: ‘black’, ‘red’, ‘yellow’, ‘stripes’, ‘yellow humeri’, ‘yellow & black’, ‘red & black’, ‘sexual dimorphic type 1’ (‘sd1’), and ‘sexual dimorphic type 2’ (‘sd2’) (Fig. 1A–J). All analyses were run under settings described at https://beast-classic.googlecode.com/files/ARv2.0.1.pdf for 50 million generations with sampling every 2,500 generations and the first 25% of trees discarded as burn-in. The ESS values were checked in Tracer 1.665 and the maximum credibility tree was generated in TREEANNOTATOR 1.8.1 when a minimum 500 ESS value was obtained68.
Electronic supplementary material
Acknowledgements
This work was supported by the Czech Science Foundation (18-14942S) and an Internal Grant from the Faculty of Science UP (MM, PrF2018). The Malaysian Ministry of Environment awarded a collecting permit. We are obliged to many colleagues for discussions and specimens, M. Masek for maps, R. Bilkova and K. Sklenarova for technical assistance, and T. C. Bray for proofreading of the manuscript.
Author Contributions
L.B. conceived the idea for this study. M.M. and L.B. performed the analyses, L.K. did laboratory work, L.B. and M.M. performed the literature search, and M.M. and L.B. wrote the manuscript.
Competing Interests
The authors declare no competing interests.
Footnotes
Electronic supplementary material
Supplementary information accompanies this paper at 10.1038/s41598-018-22155-6.
Publisher's note: Springer Nature remains neutral with regard to jurisdictional claims in published maps and institutional affiliations.
References
- 1.Müller F. Ituna and Thyridia: a remarkable case of mimicry in butterflies. Proc. Entomol. Soc. Lond. 1879;1879:xx–xxiv. [Google Scholar]
- 2.Mallet J, Joron M. Evolution of diversity in warning colour and mimicry: polymorphisms, shifting balance and speciation. Ann. Rev. Ecol. Syst. 1999;30:201–233. doi: 10.1146/annurev.ecolsys.30.1.201. [DOI] [Google Scholar]
- 3.Sherratt TN. The evolution of Müllerian mimicry. Naturwissenschaften. 2008;95:681–695. doi: 10.1007/s00114-008-0403-y. [DOI] [PMC free article] [PubMed] [Google Scholar]
- 4.Chouteau M, Arias M, Joron M. Warning signals are under positive frequency-dependent selection in nature. Proc. Nat. Acad. Sci. USA. 2016;113:2164–2169. doi: 10.1073/pnas.1519216113. [DOI] [PMC free article] [PubMed] [Google Scholar]
- 5.Rojas B, Endler JA. Sexual dimorphism and intra-populational colour pattern variation in the aposematic frog Dendrobates tinctorius. Evol. Ecol. 2013;27:739–753. doi: 10.1007/s10682-013-9640-4. [DOI] [Google Scholar]
- 6.Sherratt TN. The evolution of imperfect mimicry. Behav. Ecol. 2002;13:821–826. doi: 10.1093/beheco/13.6.821. [DOI] [Google Scholar]
- 7.Penney HD, Hassall C, Skevington JH, Abbott KR, Sherratt TN. A comparative analysis of the evolution of imperfect mimicry. Nature. 2012;483:461–464. doi: 10.1038/nature10961. [DOI] [PubMed] [Google Scholar]
- 8.Kikuchi DW, Pfennig DW. Imperfect mimicry and the limits of natural selection. Quart. Rev. Biol. 2013;88:297–315. doi: 10.1086/673758. [DOI] [PubMed] [Google Scholar]
- 9.Mallet, J. Speciation, raciation, and color pattern evolution in Heliconius butterflies: evidence from hybrid zones in Hybrid Zones and the Evolutionary Process (ed. Harrison, R. G.) 226–260 (Oxford University Press, 1993).
- 10.Brown KS, Benson WW. Adaptive polymorphism associated with multiple Müllerian mimicry in Heliconius numata (Lepid.: Nymph.) Biotropica. 1974;6:205–228. doi: 10.2307/2989666. [DOI] [Google Scholar]
- 11.Bocek M, Bocak L. Species limits in polymorphic mimetic Eniclases net-winged beetles from New Guinean mountains (Coleoptera: Lycidae) ZooKeys. 2016;593:15–35. doi: 10.3897/zookeys.593.7728. [DOI] [PMC free article] [PubMed] [Google Scholar]
- 12.Kusy, D., Sklenarova, K. & Bocak, L. The effectiveness of DNA-based delimitation in Synchonnus net-winged beetles (Coleoptera: Lycidae) assessed, and description of 11 new species, Austral Entomology, early view, 10.1111/aen.12266 (2017)
- 13.Kalousova, R. & Bocak, L. Species delimitation of colour polymorphic Cladophorus (Coleoptera: Lycidae) from New Guinea. Zootaxa, in press, (2017).
- 14.Edmunds M. Why there are good and poor mimics? Biol. J. Linn. Soc. 2000;70:459–466. doi: 10.1111/j.1095-8312.2000.tb01234.x. [DOI] [Google Scholar]
- 15.Richards-Zawacki CL, Yeager J, Bart HPS. No evidence for differential survival or predation between sympatric color morphs of an aposematic poison frog. Evol. Ecol. 2013;27:783–795. doi: 10.1007/s10682-013-9636-0. [DOI] [Google Scholar]
- 16.Chouteau M, Angers B. Wright’s shifting balance theory and the diversification of aposematic signals. PLoS One. 2012;7(3):e34028. doi: 10.1371/journal.pone.0034028. [DOI] [PMC free article] [PubMed] [Google Scholar]
- 17.Aubier TG, Sherratt TN. Diversity in Müllerian mimicry: the optimal predator sampling strategy explains both local and regional polymorphism in prey. Evolution. 2015;69:2831–2845. doi: 10.1111/evo.12790. [DOI] [PubMed] [Google Scholar]
- 18.Willmott KR, Mallet J. Correlations between adult mimicry and larval host plants in ithomiine butterflies. Proc. R. Soc. Lond. B (Suppl.) 2004;271:S266–S269. doi: 10.1098/rsbl.2004.0184. [DOI] [PMC free article] [PubMed] [Google Scholar]
- 19.Gompert Z, Willmott KR, Elias M. Heterogeneity in predator micro-habitat use and the maintenance of Müllerian mimetic diversity. J. Theor. Biol. 2011;281:39–46. doi: 10.1016/j.jtbi.2011.04.024. [DOI] [PubMed] [Google Scholar]
- 20.Willmott KR, Willmott JCR, Elias M, Jiggins CD. Maintaining mimicry diversity: optimal warning colour patterns differ among microhabitats in Amazonian clearwing butterflies. Proc. R. Soc. B. 2017;284:20170744. doi: 10.1098/rspb.2017.0744. [DOI] [PMC free article] [PubMed] [Google Scholar]
- 21.Holen ØH, Johnstone RA. The evolution of mimicry under constraints. Am. Nat. 2004;164:598–613. doi: 10.1086/424972. [DOI] [PubMed] [Google Scholar]
- 22.Speed MP, Ruxton GD. Imperfect Batesian mimicry and the conspicuousness costs of mimetic resemblance. Am. Nat. 2004;176:E1–E14. doi: 10.1086/652990. [DOI] [PubMed] [Google Scholar]
- 23.Brower LP, Brower JVZ. Parallelism, convergence, divergence, and the new concept of advergence in the evolution of mimicry. Trans. Conn. Acad. Arts Sci. 1972;44:59–67. [Google Scholar]
- 24.Bocak L, Yagi T. Evolution of mimicry patterns in Metriorrhynchus (Coleoptera: Lycidae): The history of dispersal and speciation in Southeast Asia. Evolution. 2010;64:39–52. doi: 10.1111/j.1558-5646.2009.00812.x. [DOI] [PubMed] [Google Scholar]
- 25.Mallet J. Causes and consequences of a lack of coevolution in Müllerian mimicry. Evol. Ecol. 1999;13:777–806. doi: 10.1023/A:1011060330515. [DOI] [Google Scholar]
- 26.Rowe C, Lindström L, Lyytinen A. The importance of pattern similarity between Müllerian mimics in predator avoidance learning. Proc. R. Soc. Lond. B. 2004;271:407–413. doi: 10.1098/rspb.2003.2615. [DOI] [PMC free article] [PubMed] [Google Scholar]
- 27.Kazemi B, Gamberale-Stille G, Tullberg BS, Leimar O. Stimulus salience as an explanation for imperfect mimicry. Curr. Biol. 2014;24:965–969. doi: 10.1016/j.cub.2014.02.061. [DOI] [PubMed] [Google Scholar]
- 28.Jiggins CD, Mallarino R, Willmott KR, Bermingham E. The phylogenetic pattern of speciation and wing pattern change in Neotropical Ithomia butterflies (Lepidoptera: Nymphalidae) Evolution. 2006;60:1454–1466. doi: 10.1111/j.0014-3820.2006.tb01224.x. [DOI] [PubMed] [Google Scholar]
- 29.Wilson JS, Williams KA, Forister ML, von Dohlen CD, Pitts JP. Repeated evolution in overlapping mimicry rings among North American velvet ants. Nat. Commun. 2012;3:1272. doi: 10.1038/ncomms2275. [DOI] [PubMed] [Google Scholar]
- 30.Bocak L, Bocakova M, Hunt T, Vogler AP. Multiple ancient origins of neoteny in Lycidae (Coleoptera): consequences for ecology and macroevolution. Proc. R. Soc. B-Biol. Sci. 2008;275:2015–2023. doi: 10.1098/rspb.2008.0476. [DOI] [PMC free article] [PubMed] [Google Scholar]
- 31.Bocak L, Bocakova M. Phylogeny and classification of the family Lycidae (Insecta: Coleoptera) Ann. Zool. 2008;58:695–720. doi: 10.3161/000345408X396639. [DOI] [Google Scholar]
- 32.Eisner T, et al. Defensive chemistry of lycid beetles and of mimetic cerambycid beetles that feed on them. Chemoecology. 2008;18:109–119. doi: 10.1007/s00049-007-0398-4. [DOI] [PMC free article] [PubMed] [Google Scholar]
- 33.Sklenarova K, Chesters D, Bocak L. Phylogeography of poorly dispersing net-winged beetles: A role of drifting India in the origin of Afrotropical and Oriental fauna. Plos One. 2013;8(6):e67957. doi: 10.1371/journal.pone.0067957. [DOI] [PMC free article] [PubMed] [Google Scholar]
- 34.Masek M, Palata V, Bray TC, Bocak L. Molecular phylogeny reveals high diversity and geographic structure in Asian neotenic net-winged beetles Platerodrilus (Coleoptera: Lycidae) PlosOne. 2015;10(4):e0123855. doi: 10.1371/journal.pone.0123855. [DOI] [PMC free article] [PubMed] [Google Scholar]
- 35.Li Y, Gunter N, Pang H, Bocak L. DNA-based species delimitation separates highly divergent populations within morphologically coherent clades of poorly dispersing beetles. Zool. J. Linn. Soc. 2015;175:59–72. doi: 10.1111/zoj.12262. [DOI] [Google Scholar]
- 36.Guilford T. How do ‘warning colours’ work? Conspicuousness may reduce recognition errors in experienced predators. Anim. Behav. 1986;34:286–288. doi: 10.1016/0003-3472(86)90034-5. [DOI] [Google Scholar]
- 37.Gamberale-Stille G. Benefit by contrast: an experiment with live aposematic prey. Behav. Ecol. 2001;12:768–772. doi: 10.1093/beheco/12.6.768. [DOI] [Google Scholar]
- 38.Rojas B, Rautiala P, Mappes J. Differential detectability of polymorphic warning signal under varying light environment. Behav. Proc. 2014;109:164–172. doi: 10.1016/j.beproc.2014.08.014. [DOI] [PubMed] [Google Scholar]
- 39.Shamim G, Ranjan SK, Pandey DM, Ramani R. Biochemistry and biosynthesis of insect pigments. Eur. J. Entomol. 2014;111:149–164. [Google Scholar]
- 40.Endler JA, Théry M. Interacting effects of lek placement, display behavior, ambient light, and color patterns in three neotropical forest-dwelling birds. Am. Nat. 1996;148:421–452. doi: 10.1086/285934. [DOI] [Google Scholar]
- 41.Lindsted C, Lindstroem L, Mappes J. Hairiness and warning colours as components of antipredator defence: additive or interactive benefits? Anim. Behav. 2008;75:1703–1713. doi: 10.1016/j.anbehav.2007.10.024. [DOI] [Google Scholar]
- 42.Lindstroem L, Alatalo RV, Mappes J, Riipi M, Vertainen L. Can aposematic signals evolve by gradual change? Nature. 1999;397:249–251. doi: 10.1038/16692. [DOI] [Google Scholar]
- 43.Riipi M, Alatalo RV, Lindstroem L, Mappes J. Multiple benefits of gregariousness cover detectability costs in aposematic aggregations. Nature. 2001;413:512–514. doi: 10.1038/35097061. [DOI] [PubMed] [Google Scholar]
- 44.Arenas LM, Troscianko J, Stevens M. Color contrast and stability as key elements for effective warning signals. Front. Ecol. Evol. 2014;2:1–12. doi: 10.3389/fevo.2014.00025. [DOI] [Google Scholar]
- 45.Roper TJ, Redston S. Conspicuousness of distasteful prey affects the strength and durability of one-trial avoidance learning. Anim. Behav. 1987;35:739–747. doi: 10.1016/S0003-3472(87)80110-0. [DOI] [Google Scholar]
- 46.Marples NM, Roper TJ. Effects of novel colour and smell on the response of naive chicks towards food and water. Anim. Behav. 1969;51:1417–1424. doi: 10.1006/anbe.1996.0145. [DOI] [Google Scholar]
- 47.Aronsson M, Gamberale-Stille G. Evidence of signaling benefits to contrasting internal color boundaries in warning coloration. Behav. Ecol. 2013;24:349–354. doi: 10.1093/beheco/ars170. [DOI] [Google Scholar]
- 48.Aronsson M, Gamberale-Stille G. Importance of internal pattern contrast and contrast against the background in aposematic signals. Behav. Ecol. 2009;20:1356–1362. doi: 10.1093/beheco/arp141. [DOI] [Google Scholar]
- 49.Arenas LM, Walter D, Stevens M. Signal honesty and predation risk among a closely related group of aposematic species. Sci. Rep. 2015;5:11021. doi: 10.1038/srep11021. [DOI] [PMC free article] [PubMed] [Google Scholar]
- 50.Harper GR, Jr, Pfennig DW. Selection overrides gene flow to break down maladaptive mimicry. Nature. 2008;451:1103–1106. doi: 10.1038/nature06532. [DOI] [PubMed] [Google Scholar]
- 51.Mallet L, Barton NH. 1989. Strong natural selection in a warning colour hybrid zone. Evolution. 1989;43:421–431. doi: 10.1111/j.1558-5646.1989.tb04237.x. [DOI] [PubMed] [Google Scholar]
- 52.Ruxton GD, Franks DW, Balogh ACV, Leimar O. Evolutionary implications of the form of predator generalization for aposematic signal and mimicry in prey. Evolution. 2008;62:2913–2921. doi: 10.1111/j.1558-5646.2008.00485.x. [DOI] [PubMed] [Google Scholar]
- 53.Kato K, Yamada H, Shibata E. Role of female adult size in reproductive fitness of Semanotus japonicus (Coleoptera: Cerambycidae) Appl. Entomol. Zool. 2000;35:327–331. doi: 10.1303/aez.2000.327. [DOI] [Google Scholar]
- 54.Beaty C, Beirinckx K, Sherratt TN. The evolution of Müllerian mimicry in multispecies communities. Nature. 2004;431:63–66. doi: 10.1038/nature02818. [DOI] [PubMed] [Google Scholar]
- 55.Marples NM, Kelly DJ. Neophobia and dietary conservatism: two distinct processes. Evol. Evol. 1999;13:641–653. doi: 10.1023/A:1011077731153. [DOI] [Google Scholar]
- 56.Alatalo RV, Mappes J. Tracking the evolution of warning signals. Nature. 1996;382:708–710. doi: 10.1038/382708a0. [DOI] [Google Scholar]
- 57.Thompson JN, Schwind C, Guimarães PR, Jr, Friberg M. Diversi cation through multitrait evolution in a coevolving interaction. Proc. Natl Acad. Sci. USA. 2013;110:11487–11492. doi: 10.1073/pnas.1307451110. [DOI] [PMC free article] [PubMed] [Google Scholar]
- 58.Thompson, J. N. The Geographic Mosaic of Coevolution (Univ. Chicago Press, 2005).
- 59.Borer M, Van Noort T, Rahier M, Naisbit RE. Positive frequency-dependent selection on warning color in alpine leaf beetles. Evolution. 2010;64:3629–3633. doi: 10.1111/j.1558-5646.2010.01137.x. [DOI] [PubMed] [Google Scholar]
- 60.Katoh K, Misawa K, Kuma K, Miyata T. MAFFT: a novel method for rapid multiple sequence alignment based on fast Fourier transform. Nucl. Acids Res. 2002;30:3059–3066. doi: 10.1093/nar/gkf436. [DOI] [PMC free article] [PubMed] [Google Scholar]
- 61.Stamatakis A. RAxML-VI-HPC: Maximum likelihood-based phylogenetic analyses with thousands of taxa and mixed models. Bioinformatics. 2006;22:2688–2690. doi: 10.1093/bioinformatics/btl446. [DOI] [PubMed] [Google Scholar]
- 62.Stamatakis A, Hoover P, Rougemont J. A rapid bootstrap algorithm for the RAxML web servers. Syst. Biol. 2008;57:758–771. doi: 10.1080/10635150802429642. [DOI] [PubMed] [Google Scholar]
- 63.Darriba D, Taboada GL, Doallo R, Posada D. jModelTest 2: more models, new heuristics and parallel computing. Nature Meth. 2012;9:772. doi: 10.1038/nmeth.2109. [DOI] [PMC free article] [PubMed] [Google Scholar]
- 64.Huelsenbeck JP, Ronquist F. MRBAYES: Bayesian inference of phylogeny. Bioinformatics. 2001;17:754–755. doi: 10.1093/bioinformatics/17.8.754. [DOI] [PubMed] [Google Scholar]
- 65.Rambaut, A., Suchard, M. A., Xie, D. & Drummond, A. J. Tracer 1.6. Available from http://beast.bio.ed.ac.uk/Tracer (2014).
- 66.Ezard, T., Fujisawa, T. & Barraclough, T. Splits: SPecies’ LImits by Threshold Statistics. R package version 1.0-11/r29. Available from http://R-Forge.R-project.org/projects/splits (2009).
- 67.Drummond. AJ, Suchard MA, Xie D, Rambaut A. Bayesian phylogenetics with BEAUti and the BEAST 1.7. Mol. Biol. Evol. 2012;29:1969–1973. doi: 10.1093/molbev/mss075. [DOI] [PMC free article] [PubMed] [Google Scholar]
- 68.Brower AVZ. Rapid morphological radiation and convergence among races of the butterfly Heliconius erato inferred from patterns of mitochondrial-DNA evolution. Proc. Natl Acad. Sci. USA. 1994;91:6491–6495. doi: 10.1073/pnas.91.14.6491. [DOI] [PMC free article] [PubMed] [Google Scholar]
- 69.Pons J, Ribera I, Bertranpetit J, Balke M. Nucleotide substitution rates for the full set of mitochondrial protein-coding genes in Coleoptera. Mol. Phyl. Evol. 2010;56:796–807. doi: 10.1016/j.ympev.2010.02.007. [DOI] [PubMed] [Google Scholar]
- 70.Papadopoulou A, Anastasiou I, Vogler AP. Revisiting the insect mitochondrial molecular clock: The mid-Aegean trench calibration. Mol. Biol. Evol. 2010;27:1659–1672. doi: 10.1093/molbev/msq051. [DOI] [PubMed] [Google Scholar]
Associated Data
This section collects any data citations, data availability statements, or supplementary materials included in this article.


