


Abstract
Large genomic rearrangements involve inversions, deletions and other structural changes that span Megabase segments of the human genome. This category of genetic aberration is the cause of many hereditary genetic disorders and contributes to pathogenesis of diseases like cancer. We developed a new algorithm called ZoomX for analysing barcode-linked sequence reads—these sequences can be traced to individual high molecular weight DNA molecules (>50 kb). To generate barcode linked sequence reads, we employ a library preparation technology (10X Genomics) that uses droplets to partition and barcode DNA molecules. Using linked read data from whole genome sequencing, we identify large genomic rearrangements, typically greater than 200kb, even when they are only present in low allelic fractions. Our algorithm uses a Poisson scan statistic to identify genomic rearrangement junctions, determine counts of junction-spanning molecules and calculate a Fisher's exact test for determining statistical significance for somatic aberrations. Utilizing a well-characterized human genome, we benchmarked this approach to accurately identify large rearrangement. Subsequently, we demonstrated that our algorithm identifies somatic rearrangements when present in lower allelic fractions as occurs in tumors. We characterized a set of complex cancer rearrangements with multiple classes of structural aberrations and with possible roles in oncogenesis.
INTRODUCTION
Genomic rearrangements are composed of structural variations (SVs), such as deletions, insertions, inversions, duplications, translocations (transpositions) and others (1). Genomic rearrangements contribute towards the increased susceptibility and development of many human diseases (2,3). Some rearrangements produce gene fusions with oncogenic activity (4), alter gene dosage, dysregulate cell function and change the context of regulatory elements (1,2). Over 9000 gene fusions have been identified (5). A classic example is the Philadelphia chromosome that arises from a translocation between chromosome 9 and chromosome 22. This event leads to a fused BCR/ABL1 protein which is a principle driver of chronic myeloid leukemia (4). For this study, we focused on the size category of genomic rearrangements that have breakpoints >200 kb or more apart. Structural aberrations in this range account for >85% of curated cancer gene fusions (6).
Many methods have been used to characterize this class of large cancer rearrangements across the genome. Karyotyping, fluorescent in-situ hybridization (FISH) and microarrays that measure copy number have been used to characterize these events at low resolution and without breakpoint information. More recently, whole-genome sequencing (WGS) using next-generation sequencing (NGS) technologies (i.e. Illumina), and sophisticated bioinformatics tools have been developed that identify structural variants in such data (7–14). However, current WGS approaches are geared towards identifying small- to mid-scale structural variants under 200 kb in size (15). In addition, most WGS data is generated from sequencing libraries with short DNA fragments under 0.5 kb. The use of short DNA inserts results in loss of genomic contiguity that adversely affects the calling of rearrangements generally (16).
As an added challenge, resolving large, complex somatic rearrangements is difficult when both germline alleles are involved. Moreover, complex somatic rearrangements sometimes involve multiple SV types and this further prevents a detailed characterization. Accurate detection of these events is limited by overall base coverage of the genome, the methodology and ultimately by the sequencing cost. The repetitive nature of rearranged regions also complicates detection of these events – genomic regions with a high density of repeat elements reduce the mapping quality locally around breakpoints. Overall, short sequence reads generated from short DNA inserts represent a significant handicap for identifying SVs in these regions.
Some sequencing technologies generate long reads (i.e. Oxford Nanopore and Pacific Biosciences) using high molecular weight (HMW) DNA (e.g. 5 kb of more). These long reads are useful for identifying rearrangements (17–19). However, for SV analysis, current long read sequencers are more costly than conventional short insert sequencing (i.e. Illumina). As added challenges, long read sequencers have lower base quality, unevenness in genome coverage, or very high DNA input requirement, thus making them less suitable for high efficiency analysis and side-by-side SNV calling. For example, long-read sequencers have high DNA requirements that can be greater than microgram amounts of starting material, and this can be a significant issue for clinical tumor samples where the amount of nucleic acid may be limited. In addition, clinical samples pose challenges because the content of cancer cells relative to normal cells may be low, thus diluting out the number of molecules containing a genetic aberration.
Recent technology developments include synthetic long-read sequencing (SLRS) to determine variant haplotypes and structural variants (20,21). These technologies maintain high weight molecules rather than relying on physical fragmentation to small DNA inserts, use barcodes to delineate specific molecules and thus provide long-range information based on short-read sequencing. These methods offer high resolution (sequencing-based) and improved detection of structural variants and related distal breakpoint junctions. These methods leverage the high fidelity, low cost, high throughput of short read sequencers such as the Illumina system. As a result, this approach has great potential for characterizing large-scale rearrangements that are not recognized using conventional short read sequencing.
In this study, we used one existing SLRS technology termed linked-read sequencing that employs the 10X Genomics Chromium system (21). By requiring only nanogram level input, this approach is particularly useful for analyzing tumor samples with low cellularity. WGS libraries were prepared on a 10X Genomics Chromium system (Pleasanton, CA, USA). This technology uses a microfluidic process to generate up to 106 droplet partitions if not more per experiment sample. HMW DNA molecules (>50kb) are distributed across these droplet partitions. This preparative method uses one nanogram of genomic DNA, representing approximately 300 haploid genome equivalents and no pre-amplification is required. After the library is completed, one uses an Illumina sequencer to generate reads with an integrated barcode—this information enables one to trace paired-end reads back to the originating HMW DNA molecule (22,23).
There are a limited number of methods available for analyzing linked-read sequencing data (22–26). Up to this date, Long Ranger is the standard tool to phase haplotypes and detect structural variations based on linked reads (21). The underlying statistical framework involves a binomial test of linked-read barcode counts. Long Ranger was used by Collins et al. to characterize germline SVs in several human genomes (22). Spies et al. developed a local assembly approach to reconstruct contigs with structural alterations from linked-read data, which used a binomial test similar to Long Ranger's for detecting SVs (23,26). These individual-read based approaches were prone to errors such as incorrect read mapping due to repeats or erroneous barcode reads due to sequencing errors.
To identify large rearrangements (>200 kb), we leverage a statistical property of linked-reads data. Namely, the likelihood of two DNA molecules with the same sequence composition occurring in each droplet is extremely low. We estimated this probability to be on the order of  per droplet or <1 per experiment with tens of millions of droplets (see Supplementary Results), which enables us to characterize individual molecules present in each portion. The molecule-based approach incorporates information from multiple linked-reads distributed along a molecule. This information is less prone to both mapping and barcode errors. Based on this property, we developed the ZoomX tool, embedding a Poisson-based statistic in a scalable grid scan algorithm. ZoomX systematically identifies novel genomic junctions. We demonstrate that ZoomX performs better at calling large rearrangements compared to the currently available SV calling method Long Ranger (21) for linked reads. As a demonstration of our approach, we conducted a benchmark analysis of the NA12878 genome for germline SVs. Subsequently, we identified a series of somatic rearrangements among several gastrointestinal cancers, sequencing primary tissue samples.
MATERIALS AND METHODS
Sequencing data for NA12878
Linked read data for NA12878 is publically available from 10X Genomics. The data is also available from the Genome-in-a-Bottle Project (27). The original DNA sample was obtained from the Coriell Institute, and 1.25 ng of DNA were extracted for sequencing. High molecular weight (HMW) genomic DNA on the order of 50 kb or higher was selected. A barcoded library was prepared using the Chromium assay (10X Genomics). Sequencing was performed using the Illumina XTens. Sequence data processing relied on Long Ranger software package.
Samples
The Institutional Review Board (IRB) of Stanford University School of Medicine approved the study protocol. We obtained informed consent for all patients prior to obtaining the samples. The tissue samples were collected at the time of surgical resection and fresh frozen as available from the Stanford Tissue Bank. The samples included a primary colorectal adenocarcinoma (labelled as MetB7175) and matched normal colorectal tissue (labelled as Norm7176). This sample had a mixed cellularity with at least 50% tumor fraction. Also, we obtained matched normal gastric tissue (labeled as Norm2386) and gastric metastatic tumors (labeled as MetR2721 and MetL2725, respectively). Based on histopathological examination, the tumor purity was estimated to be 20% for the MetR2721 sample and 50% for the MetL2725 sample. Genomic DNA extraction was performed with a Maxwell 16 Tissue DNA purification kit according to the manufacturer's recommended protocols (Promega, Madison, WI, USA). The genomic DNA did not require further size selection or processing. DNA was quantified with Life Technologies Qubit.
Generating and sequencing linked read libraries
Using 1.0 nanogram of genomic DNA, from each of the tissue samples, we prepared barcode libraries using the Chromium Gel Bead and Library Kit (10X Genomics, Pleasanton, CA, USA). No preamplification was used. We performed sequencing runs on an Illumina HiSeq 2500 or X10 sequencer with 2 × 151 paired-end reads and achieved ∼30× coverage for all tumor and normal samples (Supplementary Table S1B). All resulting read pairs contain a 16-base barcode. We used bclprocessor (v2.0.0) to demultiplex and convert the resulting BCL files to FASTQ files. We used Long Ranger (v2.0.0) to align the barcoded reads in the FASTQ files to the human genome reference build GRCH37.1. Sequence data was deposited in dbGAP under the accession numbers phs001362.v1.p1 and phs001400.
Identifying rearrangements from barcode linked reads
The workflow for data generation and application of our algorithm is shown in Figure 1. Our statistical algorithm is implemented in the ZoomX software package that consists of Python and R scripts that call up Samtools (28) and Bedtools (29) (Supplementary Figure S1). For visual display of the results from ZoomX, we leveraged the 10X Loupe visualizer to show our results with barcode-sharing heatmaps. In the following, we summarize the steps of ZoomX algorithms. Complete statistical details are provided in the Supplementary Methods. ZoomX is open source software available in the Bitbucket repository (https://bitbucket.org/charade/zoomx).
Figure 1.

Identifying rearrangements from linked reads. The workflow is illustrated in steps (A) to (D): (A) 1 nanogram of high molecule weight (HMW) DNA is extracted from the sample; (B) the extraction was partitioned to > 106 droplets, where in average only a few DNA molecules enter each droplet and get the same barcode; The barcode, uniquely colored, is linked to random primers which sparsely prime on the HMW DNA; (C) the primed DNA undergoes several rounds of displacement amplification to generate short fragment within the droplet, which will be released into one sequencing library pool; (D) the linked-read sequencing is performed and ZoomX infers single molecules based on aligned barcode linked reads; ZoomX scans genome coordinate pairs to detect if there is any rearrangement junction in between based on single molecule coverage. In the plot: Each DNA molecule (fragment) is represented by a gray curved (linear) segment; each color represents a unique barcode. In (B); each short segment represents a random primer with barcode. In (D): Each colored long stretch is an inferred linked-read molecule; Each colored vertical short bar is a linked-read pair, which is interspersed along the inferred molecule; We depict the single molecule coverage against the base pair coverage given the shown molecules. The single molecule coverage is higher and more consistent across the genome.
We use aligned, linked reads to identify individual HMW DNA molecules based on barcodes that distinguish different droplet partitions (21). Our statistic involves a two-dimensional Poisson scan for determining significant levels of barcode-sharing molecule counts between two genomic regions. Given two distal genomic regions, the event of distinct molecules originating separately from the two regions occurring in the same droplet is negligible. Therefore, distal genomic junctions can be detected by screening for region grid pairs. We also found overall linked-read sequencing metrics were consistent across all analysed samples, where the distributions of individual molecules were well approximated by Poisson distributions (Figure 2A, Supplementary Figure S2 and Supplementary Results). The range of metric values consistently allows for well-separated null and alternative distributions in our model. By simulations, we estimated the detection power of the statistic is >90%, for junction allele fractions as low as 10% (Supplementary Figure S3 and Supplementary Results).
Figure 2.

Sequencing statistics from the linked-read, whole genome analysis of NA12878. (A) Observed genome-wide molecule coverage density represents a Poisson distribution, as fitted by maximum likelihood (NA12878_Fit). (B) Individual molecule coverage (NA12878_molecule) is significantly higher than paired-end fragment coverage (NA12878_PEfrag) over the entire genome; (C) Individual molecule coverage (NA12878_molecule) is higher than paired-end fragment coverage (NA12878_PEfrag) over the entire genome.
The initial input to the algorithm are the BAM alignments of linked-reads. Given the sparsity of molecules per a droplet partition, typically from three to five, ZoomX uses the associated barcode and aligned sequences to determine the identity and characteristics of each partitioned molecule. ZoomX then computes molecule statistics across the genome, such as effective molecule coverage (as defined in Supplementary Methods) for a given genomic segment, and stores the coordinates of individual DNA molecules into a BED file with annotations. In this parser step, ZoomX also finds all mapped read pairs in unusual positions (i.e. not contiguous from the same genomic region or chromosome) and saves these read pairs into BEDPE files.
In the next step, ZoomX conducts a genome-wide grid scan (Supplementary Figure S4 and Supplementary Methods). ZoomX identifies high frequency barcode sharing between two regions by applying the Poisson statistic to the molecule BED file defined in the previous step. If a genomic junction  exists between regions
  and
and  , then one expects a substantial number of molecules to span such junction and be captured and sequenced with the same barcodes. As already noted, the probability of barcode collision, that is, the event of two molecules with sequence overlap in the library sharing the same barcode, is extremely small. Therefore, two linked-read molecules from
  and
and  sharing the same barcode are likely to have originated from the same individual HMW DNA molecule. One has the option to mask the liked-read molecules mapping to regions of aberrant coverage. This step reduces potential false discoveries resulting from abrupt coverage spikes. The required input of this optional step is a bed file containing the base coverage values in each grid region. The scanning step produces a list of candidate junctions in BEDPE format as represented by grid pairs, which become the input to the refinement step.
The next position refinement step clusters junctions into groups and identifies additional short insert read pairs that support for each junction group. We use the Bedtools’ pairtopair function to create a connection graph of all identified candidate grid pairs, in which each candidate grid pair is a node. A connecting edge is defined only if two grid pairs overlap at both ends, ignoring strand direction. Then, we use an efficient graph algorithm as implemented in Scipy to find all connected components in the resulting connection graph. The node set of each connected component is the group of grid pairs representing the same junction. We output the refined candidate list by taking the unions of the group of grid pairs within each component.
Finally, we delineate the breakpoints by overlapping short read pairs saved in the parser steps with refined candidate junctions using the Bedtools’ pairtopair function. We require overlap of both ends and ignore strand context. We report the indices of overlapping read pairs as additional annotations in our output, which can be used to derive exact breakpoints. The final output is a BEDPE file in which each junction is recorded with the confidence regions for its two breakpoints in the genome, along with annotations such as the number of supporting molecules and the indices of all supporting read pairs. As an optional step, we align and plot all supporting molecules spanning each junction. Subsequently, we derive base pair breakpoint as the consensus of molecules with flushing ending positions. The algorithm generates sequence contigs encapsulating the breakpoints and computing the Fisher's exact test statistic based on matched sample molecule data.
In this work, we analysed the barcode linked read datasets using ZoomX with a scan grid length of 10kb, aiming to detect large-scale transpositions/translocations, inversions and more complex types (breakpoints at least 200kb apart) where previous analysis encountered difficulties. We excluded any genomic regions within 1 Mb of a centromere, a telomere or a large gap from our analysis to avoid alignment errors related to the genome reference. Call set differentiation was done by the Bedtools pairtopair function to remove any potential germline events from tumour call set if they were also found in matched normal call set. The pairtopair overlap was used to remove any event in the matched normal call set. Resulting somatic junctions were denoted in BEDPE format and were visualized by the 10X Genomics Loupe program. We used ZoomX’s molecule plotting functions to illustrate rearrangement junctions and single-molecule support.
Fisher's exact test for identifying statistical significance of SV junctions
ZoomX uses a Fisher's exact test for identifying statistically significant somatic events from matched normal tumor pairs. We denote the normal control genome as  and tumor genome as
  . Any junction to be tested has following data acquired from the genome-wide scan: all molecules covering the junction breakpoints
  and
and  , respectively for control and tumor samples, and barcode-sharing molecules supporting the proposed junction
  and
and  , respectively. The data can be summarized in a two-way contingency table:
 |
A one-sided Fisher's exact test is directly applicable to determine if there is significant evidence for more junction-supporting molecules in the tumor sample. The test was done by R’s fisher.test function. The reported P-value P were Bonferroni-corrected Fisher's test P-values  , such that
  . A standard cut-off
  <0.05 was used to determine statistical significance.
RESULTS
Defining molecule coverage based on barcode linked reads
First, we developed the concept of ‘molecule coverage’ that improves rearrangement calling compared to the Long Ranger SV caller. This concept is based on the identification of the molecules and their genomic characteristics from each droplet partition as denoted by the barcodes. The barcode linked reads are used to extrapolate the genomic position of the partition contents. There is little overlap among the molecules’ genomic positions given that there are only three to five molecules per each droplet, as defined by a Poisson distribution from the 300 genome equivalents originally used. With this information, several features proved very useful. As noted in the step (D) in Figure 1, the molecule coverage or depth is based on counting the number of separate DNA molecules that span a given genomic region. The partition barcode information is crucial for enumerating molecule coverage for any given genomic region. In a typical barcode library preparation, linked-read sequencing generates tens of millions of separate molecules with a mean molecule length around tens of kb (Supplementary Table S1). With this level of partitioning one achieves ∼100× effective coverage of the whole genome by individual molecules when the actual sequenced base pair coverage is only around 30x. The increased coverage was fully observed in all of samples including the tumor samples (Figure 2B and Supplementary Figure S5).
Second, a molecule's map position, based on linked reads, is less constrained by mapping individual reads in the repetitive sequences that are likely directly adjacent to SV breakpoints. It is well known that such breakpoint mappings are error prone and confuse conventional SV callers. In contrast, a linked-read molecule's map position is based on multiple mapped read pairs per a given barcode. Namely, the HMW DNA source molecule provides extended genomic contiguity, thus providing a fundamental advantage for SV analysis compared to short DNA insert sequencing libraries. With this scheme, SV junctions are no less evident based on reads mapping distal to the breakpoint. The probability of two extrapolated DNA molecules with the same sequence present in the same partition droplet is very low (<0.01). This feature insures that the mapping and identification of HMW species is accurate. Therefore, the detection of structural variant junctions no longer relies on short read mapping close to the breakpoint—this short read process is more error-prone owing to the enrichment of repetitive sequences next to structural variations (30–32). As a result, we consistently see a better evenness of genome wide molecule coverage as compared to read pair coverage in all samples (Figure 2C and Supplementary Figure S5).
Whole genome performance metrics from barcode linked reads
As an initial test of our method, we processed the linked read data available from the whole genome sequencing of NA12878 (Materials and Methods). This genome has been extensively sequenced across multiple platforms including with linked reads. First, we demonstrated a significant increase of molecule coverage that enables the sensitive detection of SV junctions. Figure 2B shows the cumulative molecule coverage from barcode linked-reads versus the fragment coverage based on short-insert, paired-end reads for the NA12878 genome. Molecules identified by linked reads provide higher extrapolated molecule coverage for any genomic interval compared to paired-end sequencing fragments. The molecule coverage for the NA12878 sample is 176× for >50% of the genome and 160× for >80% of the genome. In comparison, the average coverage of paired-end sequences (also linked reads) was 33× for >50% of the genome and 24× for >90% of the genome, and the base pair coverage was 27× for >50% of the genome and 19× for >80% of the genome. The molecule coverage has significantly less coverage variance than what one encounters from standard sequence coverage using short insert paired-end fragments. We normalized the cumulative molecule coverage, a step that requires aligning the curves for the two different methods at the point where 50% of the genome is covered (Figure 2C). The normalized curve for extrapolated molecule coverage has a much steeper transition that translates into improved evenness. Thus, 55% of the genome had extrapolated molecule coverage ranging from minus to plus one standard deviation from the mean as compared to just 40% for coverage computed using the paired-end short-insert fragments. The same conclusion was drawn based on all other samples (Supplementary Figure S5).
Identifying large rearrangements from NA12878 linked reads
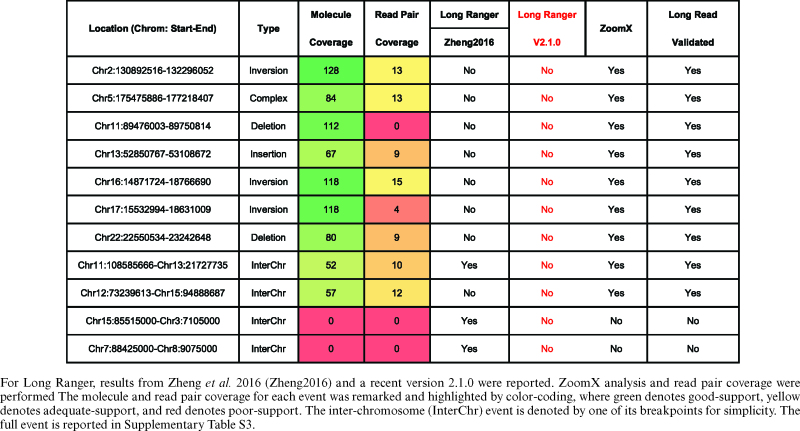
Our analysis focused on discovery of large-scale events that were 200 kb in size or greater. We used the linked read data to identify individual DNA molecules that define the SV structure. Using our approach, we identified a series of rearrangements that included multiple SV elements not detected with the 10X Long Ranger SV caller. In total, we found seven intra- and two inter-chromosomal large-scale structural variations in the NA12878 genome (Supplementary Table S2). All the SVs were orthogonally corroborated by examining sequence data from Pacific Bioscience's long sequence reads and/or Illumina Moleculo synthetic long reads using split read analysis provided by Layer et al. (10). In comparison, the Long Ranger caller (10X Genomics) did not detect eight out of the nine validated ZoomX rearrangements (21). Long Ranger detected one intra-chromosome event that was not validated by any orthogonal data set (Supplementary Table S2)—ZoomX did not detect this SV. Long Ranger detected three inter-chromosome events where only one was validated (Supplementary Table S2). In comparison, ZoomX identified the single validated Long Ranger SV, which is a transposition located at Chr11:108 585 666–Chr13:21 727 735 (Table 1). We also validated many of the ZoomX calls using other reported results including clone-by-clone sequencing calls from Kidd et al. (33), microarray calls from Conrad et al. (34) and SVs from the 1000 Genome Project using conventional WGS (16) (Supplementary Table S3).
Table 1. All ZoomX and Long Range identified events (>200 kb) in NA12878.
|
Citing an example, we identified a novel heterogeneous double deletion on autosome 22 (Figure 3A). The locus is composed of a larger ∼700 kb deletion (Chr22: 22 550 534–23 242 648) allele and a smaller ∼80 kb deletion (Chr20: 23 210 673–23 242 648) allele. Greater than 80 molecules supported this variant call—these molecules spanned the breakpoints of the larger allele (Supplementary Figure S6A). Additional read depth analysis confirmed this SV—average coverage decreased from 30× to 15× for the larger allele and drops to zero for the smaller allele. The larger allele corresponds to a variant listed in the Database of Genomic Variants (35) (DGV) gold standard entry gssvL77096 (accession number). This variant has a population frequency of 0.55% (in 117 of 14642 unique samples). The smaller allele corresponds to the DGV entry gssvL77095 with population frequency 0.93% (128 of 13818 unique samples).
Figure 3.

Two large-scale complex structural variants resolved in germline sample NA12878. (A) A heterozygous locus has two deletion alleles where the junction formed by the larger deletion allele is supported by 80 molecules; (B) A heterozygous locus has a larger inversion-deletion allele and a small deletion-only allele, where the two junctions formed by the larger allele's inversion is supported by 61 and 67 molecules, respectively. In each subfigure, the upper panel is a heatmap, where the dark colour represents shared barcodes between the two genomic segments marked in X- and Y-axis. They are the same in this case. The heatmaps display the rearrangement. The middle panel is the base coverage along the X-axis segment. The bottom panel is the resolved genotypes or haplotypes resulting from the junction events.
The entire locus resides in a significantly repetitive genomic region, interspersed by multiple LINE-1, LINE-2, Alu and other tandem repeats (36). The larger allele contains two segmental duplications (chr22: 22 604 170–22 669 477 and chr22: 22 973 847–22 997 581) that have high sequence similarity (97%) with other genomic regions. As noted, the Long Ranger SV caller provided with the 10X Chromium assay did not identify this variant. This larger allele event was only reported previously by the clone-by-clone approach and by microarray data, but at much lower resolution. In comparison, coupling linked-read single-molecule sequencing with ZoomX analysis, we resolved the larger allele at base pair level resolution. The other WGS studies may have missed this variant given the repetitive sequence structure and its large size.
Figure 3B shows another complex rearrangement that incorporates a heterogeneous inversion and deletion locus on autosome 2. The locus is composed of a large ∼1.4 Mb inversion and deletion allele (Chr2: 130 892 516–132 296 052) and a smaller ∼75 kb deletion allele. A total of 61 and 67 molecules support the two breakpoints of the larger allele, respectively (Supplementary Figure S6B and S6C). Additional read depth analysis also confirms the locus. The variant was independently confirmed by one long read from long synthetic reads (i.e. Illumina Moleculo) (10). The event corresponds to the InvFEST (37) entry HsInv0669. All other studies with different long read sequencer approaches failed to identify this event. Similar to the previous variant, the fact that it resides within repetitive regions might have hindered its discovery by other studies.
One inter-chromosomal variant that we found represents a balanced transposition junction between autosomes Chr12 and Chr15. A total of 57 molecules supported the junction breakpoint (Supplementary Table S3). The variant is heterozygous. In one haplotype, a small segment of Chr15 was inserted into Chr12: 73 239 613. Short read pairs also confirmed the variant with eight forward-forward and four reverse-reverse abnormal pairs. The transposed region is defined as Chr15: 94 886 289–94 888 455. A similar heterozygous variant was found between autosomes Chr11 and Chr13, with 52 supporting molecules. Moreover, we confirmed that regions consisted of a small region of Chr13: 21 727 733–21 732 060 inserted into Chr11: 108 585 666—this was validated with short insert read pairs. We identified independent sequencing validation of these events. For the first transposition, we identified nine long reads generated from Pacific Biosciences WGS data and 21 synthetic long reads that confirmed our call. Likewise, for the second transposition, we identified eight long reads and 36 synthetic reads that confirmed our call.
Discovery of somatic rearrangements in cancer
We analysed three cancers, including one colon and two gastric cancers. Our analysis method identified a series of complex somatic rearrangements composed of multiple SVs that would be challenging to identify with either short insert or long sequence reads. The first sample we analysed was a colorectal tumor, focusing on large genomic events that exceed 200 kb. We used the ZoomX program with a grid length of 10 kb. We inferred a range of 42–43 million molecules with average molecule length ∼6 kb. The estimated extrapolated molecule coverage  was 88 and 89 for MetB7175 and Norm7176, respectively. The estimated null sharing was
  for both samples. The expected sharing for 10% allele fractions was 14 for both MetB7175 and Norm7176, which we used as the minimum required single-molecule support for junction allele.
For this colorectal tumor, all of the reported somatic rearrangements underwent Bonferroni adjusted Fisher Exact test with P-values <0.05 (Supplementary Table S4). In total, we identified 13 somatic rearrangements as circus plotted in Figure 4. MetB7175, had seven intra-chromosomal and six inter-chromosomal somatic junctions with an average of 31 molecules supporting the identification of each. Moreover, short read pairs supported ∼80% of these junctions, although with an average of only six pairs per junction—significantly lower than molecule support (P = 2.122e–11, one-tailed paired t-test).
Figure 4.
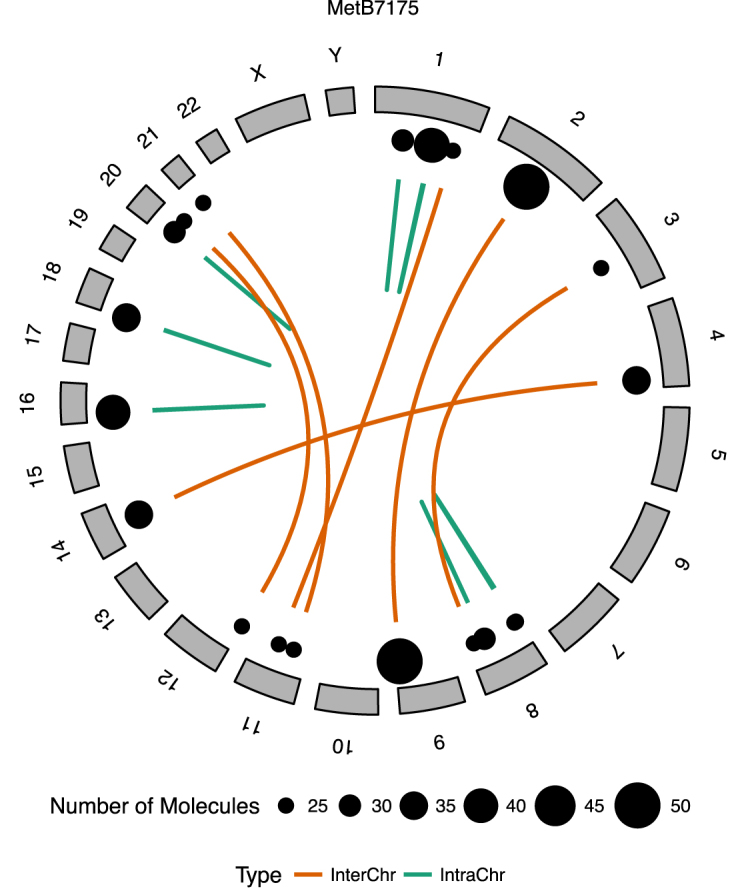
Somatic rearrangements identified in a colorectal cancer. In total six intrachromosomal (intraChr) and seven interchromosomal (interChr) somatic rearrangement junctions were identified in the colorectal tumor (MetB7175). The junctions were illustrated by intra- and interchromosomal links. The junctions were supported by 25–50 molecules, which were marked as a dot next to the link and to the size.
One of the somatic events overlapped with SET gene, which is a nuclear protein and listed as an annotated cancer driver among the curated variants in COSMIC (38). Specifically, we identified a translocation where a segment of Chr9: 131 457 029–131 458 900 was duplicated and inserted into Chr2: 116 376 786. The Long Ranger software did not detect this rearrangement. The junction was supported by 50 molecules and with additional sequence breakpoint support coming from 26 short read pairs. The ∼1.8 kb inserted segment incorporates nearly the entire first exon of the SET gene. The translocation creates a novel DPP10 (2q14.1)/SET (9q34.11) gene fusion. SET gene fusions, such as NUP214 (9q34.13)/SET (9q34.11), are known to be associated with various leukaemias (39). Dipeptidyl Peptidase Like 10 (DPP10) is high expressed in brain tissue (40) and has been implicated in asthma (41). Several reports have shown that DPP10 has a potential role in colorectal cancer (42) and neuroblastoma (43). The role of this rearrangement in colorectal cancer is yet to be determined.
We identified other somatic rearrangements as well. Three examples are shown in Figure 5. A total of 39 molecules supported the first junction. The rearrangement involved a ∼3.2 Mb partial duplication of Chr10: 144 672 679–147 914 434 (Figure 5A and Supplementary Figure S7A). The segment harbors the ST3 Beta-Galactoside Alpha-2,3-Sialyltransferase 3 gene (ST3GAL3). The breakpoint is within the last intron of the gene, which alters normal transcript forms. ST3GAL3 is known to affect cell mobility in metastasis (44,45). The second junction, which has 29 supporting molecules, represents a ∼458 kb deletion of Chr8: 98 634 834–99 093 478 (Figure 5B and Supplementary Figure S7B). The deletion covers three genes associated with metastasis including: Metadherin (MTDH), Lysosomal Protein Transmembrane 4 Beta (LAPTM4B) and Matrilin 2 (MATN2) (46,47), along with others. The third junction, which has 34 supporting molecules, represents a ∼941 kb deletion of Chr18: 2 993 550–3 935 415 (Figure 5C and Supplementary Figure S7C). The deletion removes the TGFB Induced Factor Homeobox 1 (TGIF1) gene, which is crucial to normal brain development, the loss of which causes holoprosencephaly (48). The deletion breakpoint resides within the first intron of Lipin 2 (LPIN2), which can disrupt normal gene transcripts. Deactivation of this gene along with the NF2, NIPSNAP1 and UGT2B17 genes, is reported to enable metastasis in prostate cancer cell lines (49).
Figure 5.

Three somatic rearrangements resolved in a colorectal cancer. (A) A somatic duplication that interrupts gene ST3GAL3. A total of 39 molecules supported the junction breakpoint. (B) A somatic deletion that deletes MTDH, LAPTM4B and MATN2 genes. A total of 29 molecules supported the junction breakpoint. (C) A somatic deletion that deletes MYOM1 and TFIF1 genes and interrupts the LPIN1 gene. A total of 34 molecules supported the junction breakpoint. Each subfigure also shows the same region from the matched Norm7176 sample as an inset, which shows no alteration. Higher than anticipated barcode sharing was red circled, which represents the junction breakpoint.
As additional demonstration of this approach's ability for identifying complex somatic rearrangements we sequenced two gastric tumors with a matched normal as denoted by MetR2721 (tumor), MetL2725 (tumor) and Norm2386 (normal tissue). Like the colorectal cancer, we identified a series of somatic rearrangements with multiple SV elements. Importantly, our molecule method identified these events despite the limited tumor cellularity that was less than 30% in both samples.
We ran ZoomX with grid length of 10 kb. The sequencing statistics are presented in Supplementary Table S1. We inferred 12–42 million molecules with average molecule length around 10kb. The estimated extrapolated molecule coverage  was 142 (Norm2386), 132 (MetL2725) and 43 (MetR2721), respectively. The estimated null sharing was
  for all three. We required the minimum estimated junction allele to be at least 14. The analysis was focused on large-scale events (>200kb). We listed all somatic rearrangements found with Bonferroni adjusted Fisher Exact test P-values <0.05 in Supplementary Table S5. All junctions also had more than two paired-end short read pairs as additional validation support.
We found four somatic intra-chromosomal junctions in MetR2721 and two in MetL2725 samples. Two of the four and one of the two junctions were overlapping cancer driver gene regions, as defined by the COSMIC census, which were both significantly enriched (P = 0.003286 and P = 0.04081, Binomial Test). Of particular interest was the fact that the rearrangements clustered around the Chr10: 122–124 Mb region harboring the fibroblast growth factor receptor 2 (FGFR2) gene. FGFR2 is a well-known oncogene implicated in gastric cancers. The duplicated region was also inverted (Chr10: 122 763 941–123 240 993). In total, 141 and 146 molecules supported the inversion breakpoints, which is equivalent to ∼7× expected extrapolated molecule coverage for a heterozygous haplotype (Figure 6A and Supplementary Figure S8A and B).
Figure 6.

A complex somatic rearrangement. These tumor samples show distinct rearrangements in the same genomic region harbouring the FGFR2 gene (Chr10: 122–124 MB). In MetR2721 (A), the rearrangement was resolved to a somatic inversion-amplification haplotype. A total of 146 and 141 molecules supported the two junction breakpoints formed by the inversion. In MetL2725 (B), the rearrangement was resolved to multiple parallel haplotypes. The two major haplotypes were two duplications with their breakpoints red circled in the plot. A total of 71 and 41 molecules supported the duplication junction breakpoints. The coverage changes in the region also confirmed these events. The same region from the matched Norm2386 shows no alteration, which is shown as an inset in subfigure (A).
The MetL2725 site shows more complex rearrangements in the same region with multiple coexisting somatic alleles. Our analysis detected two distinct large-scale duplication that affected the same region, one spanning Chr10: 122 946 850–123 782 660 and the other spanning Chr10: 122 465 823–123 486 938, as shown in Figure 6B. The first allele is 2× duplication, while the second is duplicated multiple times. Both duplications affect the entirety of the FGFR2 gene. A total of 71 and 41 molecules supported the junction breakpoints, respectively (Supplementary Figure S8C and D). The accompanying normal tissue, Norm2386, shows no aberration in the region.
DISCUSSION
In summary, we demonstrate a new method to detect large-scale complex structural variants and rearrangements using barcode linked read data with the 10X Genomics platform. Our approach identifies germline rearrangements and perhaps more challenging, somatic events that occur in lower allelic fractions (<50%). We demonstrated that the method delineates complex structural variants where the size is >200 kb and missed by other methods that include long read sequencers. Our approach detects a full spectrum of structural variations, including deletions, inversions, duplications and remote translocations even when they occur in a lower proportion of the sample DNA as seen in primary cancers from clinical biopsies. The improved sensitivity is a combined result of higher extrapolated molecule coverage (typically 100× or more), as well as the HMW genomic DNA (typically >10 kb).
Compared to the read-based binomial test algorithm, that was employed by the Long Ranger (21) and Spies et al. (23) for SV calling, our statistical algorithm demonstrates an improvement in performance for the following reasons: First, the extrapolated molecule coverage of linked-read molecules (the genome coverage computed using the inferred spans of all molecules) is generally higher than the coverage of short-insert fragments. Higher extrapolated molecule coverage translates directly to more informative features for junction detection as compared to the existing read pair design. Second, compared to individual reads or read-pairs, there is a higher likelihood that a molecule represented by multiple linked-read pairs spans a rearrangement junction.
Barcode-linked sequencing data has additional features that facilitate its application in many aspects beyond structural variant analysis. Linked reads are compatible with existing short read bioinformatics pipelines used to analyse whole-genome sequencing. The DNA input is as little as 1 ng, representing orders of magnitude smaller than conventional whole-genome sequencing. The N50 of phased haplotype block size is up to 1 Mb, which offers haplotypes of both single nucleotide and structural variant calls. The ZoomX module developed here can be used directly on top of the existing 10X Genomics bioinformatics pipeline. Taken together, these developments provide a new way to perform whole-genome analysis that can rapidly identify complex rearrangements whether they be germline or somatic.
AVAILABILITY
The sequencing data of NA12878 is available from the 10X Genomics website (https://support.10xgenomics.com/genome-exome/datasets/NA12878_WGS_210). ZoomX is available in the following Bitbucket repository (https://bitbucket.org/charade/zoomx). The dbGAP accession number for cancer samples is phs001362.v1.p1 and phs001400.
Supplementary Material
ACKNOWLEDGEMENTS
Author contributions: L.C.X., N.R.Z. and H.P.J. designed the study. L.C.X. developed the statistical framework, wrote the software and performed the NA12878 sample analyses. L.C.X., J.J.C., J.M.B. and C.W.B. performed the sequencing and analyses. L.C.X., N.R.Z. and H.P.J. drafted the manuscript. H.P.J. provided overall supervision of the study. All authors contributed to the writing.
SUPPLEMENTARY DATA
Supplementary Data are available at NAR Online.
FUNDING
National Institutes of Health [R01HG006137 to L.C.X., H.P.J., N.R.Z., P01HG00205 to J.M.B., J.J.C., C.W.B., H.P.J.]; Intermountain Healthcare (to L.C.X. and H.P.J.); Translational Research Award from the Stanford Cancer Institute (to H.P.J. and J.M.B.); The American Cancer Society [RSG-13-297-01-TBG to to H.P.J.]; Doris Duke Charitable Foundation, the Clayville Foundation, the Seiler Foundation and the Howard Hughes Medical Institute (to H.P.J.). Funding for open access charge: National Institutes of Health [2R01HG006137].
Conflict of interest statement. None declared.
REFERENCES
- 1. Feuk L., Carson A.R., Scherer S.W.. Structural variation in the human genome. Nat. Rev. Genet. 2006; 7:85–97. [DOI] [PubMed] [Google Scholar]
- 2. Weischenfeldt J., Symmons O., Spitz F., Korbel J.O.. Phenotypic impact of genomic structural variation: insights from and for human disease. Nat. Rev. Genet. 2013; 14:125–138. [DOI] [PubMed] [Google Scholar]
- 3. Carvalho C.M., Lupski J.R.. Mechanisms underlying structural variant formation in genomic disorders. Nat. Rev. Genet. 2016; 17:224–238. [DOI] [PMC free article] [PubMed] [Google Scholar]
- 4. Nowell P.C. The minute chromosome (Phl) in chronic granulocytic leukemia. Blut. 1962; 8:65–66. [DOI] [PubMed] [Google Scholar]
- 5. Mertens F., Johansson B., Fioretos T., Mitelman F.. The emerging complexity of gene fusions in cancer. Nat. Rev. Cancer. 2015; 15:371–381. [DOI] [PubMed] [Google Scholar]
- 6. Lee M., Lee K., Yu N., Jang I., Choi I., Kim P., Jang Y.E., Kim B., Kim S., Lee B. et al. . ChimerDB 3.0: an enhanced database for fusion genes from cancer transcriptome and literature data mining. Nucleic Acids Res. 2017; 45:D784–D789. [DOI] [PMC free article] [PubMed] [Google Scholar]
- 7. Abyzov A., Urban A.E., Snyder M., Gerstein M.. CNVnator: an approach to discover, genotype, and characterize typical and atypical CNVs from family and population genome sequencing. Genome Res. 2011; 21:974–984. [DOI] [PMC free article] [PubMed] [Google Scholar]
- 8. Chaisson M.J., Huddleston J., Dennis M.Y., Sudmant P.H., Malig M., Hormozdiari F., Antonacci F., Surti U., Sandstrom R., Boitano M. et al. . Resolving the complexity of the human genome using single-molecule sequencing. Nature. 2015; 517:608–611. [DOI] [PMC free article] [PubMed] [Google Scholar]
- 9. Chen K., Wallis J.W., McLellan M.D., Larson D.E., Kalicki J.M., Pohl C.S., McGrath S.D., Wendl M.C., Zhang Q., Locke D.P. et al. . BreakDancer: an algorithm for high-resolution mapping of genomic structural variation. Nat. Methods. 2009; 6:677–681. [DOI] [PMC free article] [PubMed] [Google Scholar]
- 10. Layer R.M., Chiang C., Quinlan A.R., Hall I.M.. LUMPY: a probabilistic framework for structural variant discovery. Genome Biol. 2014; 15:R84. [DOI] [PMC free article] [PubMed] [Google Scholar]
- 11. Li Y., Zheng H., Luo R., Wu H., Zhu H., Li R., Cao H., Wu B., Huang S., Shao H. et al. . Structural variation in two human genomes mapped at single-nucleotide resolution by whole genome de novo assembly. Nat. Biotechnol. 2011; 29:723–730. [DOI] [PubMed] [Google Scholar]
- 12. Wang J., Mullighan C.G., Easton J., Roberts S., Heatley S.L., Ma J., Rusch M.C., Chen K., Harris C.C., Ding L. et al. . CREST maps somatic structural variation in cancer genomes with base-pair resolution. Nat. Methods. 2011; 8:652–654. [DOI] [PMC free article] [PubMed] [Google Scholar]
- 13. Xia L.C., Sakshuwong S., Hopmans E.S., Bell J.M., Grimes S.M., Siegmund D.O., Ji H.P., Zhang N.R.. A genome-wide approach for detecting novel insertion-deletion variants of mid-range size. Nucleic Acids Res. 2016; 44:e126. [DOI] [PMC free article] [PubMed] [Google Scholar]
- 14. Yang L., Luquette L.J., Gehlenborg N., Xi R., Haseley P.S., Hsieh C.H., Zhang C., Ren X., Protopopov A., Chin L. et al. . Diverse mechanisms of somatic structural variations in human cancer genomes. Cell. 2013; 153:919–929. [DOI] [PMC free article] [PubMed] [Google Scholar]
- 15. Alkan C., Coe B.P., Eichler E.E.. Genome structural variation discovery and genotyping. Nat. Rev. Genet. 2011; 12:363–376. [DOI] [PMC free article] [PubMed] [Google Scholar]
- 16. Sudmant P.H., Rausch T., Gardner E.J., Handsaker R.E., Abyzov A., Huddleston J., Zhang Y., Ye K., Jun G., Hsi-Yang Fritz M. et al. . An integrated map of structural variation in 2,504 human genomes. Nature. 2015; 526:75–81. [DOI] [PMC free article] [PubMed] [Google Scholar]
- 17. Koren S., Schatz M.C., Walenz B.P., Martin J., Howard J.T., Ganapathy G., Wang Z., Rasko D.A., McCombie W.R., Jarvis E.D. et al. . Hybrid error correction and de novo assembly of single-molecule sequencing reads. Nat. Biotechnol. 2012; 30:693–700. [DOI] [PMC free article] [PubMed] [Google Scholar]
- 18. Norris A.L., Workman R.E., Fan Y.F., Eshleman J.R., Timp W.. Nanopore sequencing detects structural variants in cancer. Cancer Biol. Ther. 2016; 17:246–253. [DOI] [PMC free article] [PubMed] [Google Scholar]
- 19. Pendleton M., Sebra R., Pang A.W., Ummat A., Franzen O., Rausch T., Stutz A.M., Stedman W., Anantharaman T., Hastie A. et al. . Assembly and diploid architecture of an individual human genome via single-molecule technologies. Nat. Methods. 2015; 12:780–786. [DOI] [PMC free article] [PubMed] [Google Scholar]
- 20. McCoy R.C., Taylor R.W., Blauwkamp T.A., Kelley J.L., Kertesz M., Pushkarev D., Petrov D.A., Fiston-Lavier A.S.. Illumina TruSeq synthetic long-reads empower de novo assembly and resolve complex, highly-repetitive transposable elements. PLoS One. 2014; 9:e106689. [DOI] [PMC free article] [PubMed] [Google Scholar]
- 21. Zheng G.X., Lau B.T., Schnall-Levin M., Jarosz M., Bell J.M., Hindson C.M., Kyriazopoulou-Panagiotopoulou S., Masquelier D.A., Merrill L., Terry J.M. et al. . Haplotyping germline and cancer genomes with high-throughput linked-read sequencing. Nat. Biotechnol. 2016; 34:303–311. [DOI] [PMC free article] [PubMed] [Google Scholar]
- 22. Collins R.L., Brand H., Redin C.E., Hanscom C., Antolik C., Stone M.R., Glessner J.T., Mason T., Pregno G., Dorrani N. et al. . Defining the diverse spectrum of inversions, complex structural variation, and chromothripsis in the morbid human genome. Genome Biol. 2017; 18:36. [DOI] [PMC free article] [PubMed] [Google Scholar]
- 23. Spies N., Weng Z., Bishara A., McDaniel J., Catoe D., Zook J.M., Salit M., West R.B., Batzoglou S., Sidow A.. Genome-wide reconstruction of complex structural variants using read clouds. Nat. Methods. 2017; 14:915–920. [DOI] [PMC free article] [PubMed] [Google Scholar]
- 24. Chaisson M.J.P., Wilson R.K., Eichler E.E.. Applications of next-generation sequencing: genetic variation and the de novo assembly of human genomes. Nat. Rev. Genet. 2015; 16:627–640. [DOI] [PMC free article] [PubMed] [Google Scholar]
- 25. Bell J.M., Lau B.T., Greer S.U., Wood-Bouwens C., Xia L.C., Connolly I.D., Gephart M.H., Ji H.P.. Chromosome-scale mega-haplotypes enable digital karyotyping of cancer aneuploidy. Nucleic Acids Res. 2017; 45:e162. [DOI] [PMC free article] [PubMed] [Google Scholar]
- 26. Jackman S.D., Vandervalk B.P., Mohamadi H., Chu J., Yeo S., Hammond S.A., Jahesh G., Khan H., Coombe L., Warren R.L. et al. . ABySS 2.0: resource-efficient assembly of large genomes using a Bloom filter. Genome Res. 2017; 27:768–777. [DOI] [PMC free article] [PubMed] [Google Scholar]
- 27. Zook J.M., Chapman B., Wang J., Mittelman D., Hofmann O., Hide W., Salit M.. Integrating human sequence data sets provides a resource of benchmark SNP and indel genotype calls. Nat. Biotechnol. 2014; 32:246–251. [DOI] [PubMed] [Google Scholar]
- 28. Li H., Handsaker B., Wysoker A., Fennell T., Ruan J., Homer N., Marth G., Abecasis G., Durbin R. Genome Project Data Processing, S. . The Sequence Alignment/Map format and SAMtools. Bioinformatics. 2009; 25:2078–2079. [DOI] [PMC free article] [PubMed] [Google Scholar]
- 29. Quinlan A.R. BEDTools: The Swiss-Army Tool for Genome Feature Analysis. Curr. Protoc. Bioinformatics. 2014; 47, doi:10.1002/0471250953.bi1112s47. [DOI] [PMC free article] [PubMed] [Google Scholar]
- 30. Huang C.R., Schneider A.M., Lu Y., Niranjan T., Shen P., Robinson M.A., Steranka J.P., Valle D., Civin C.I., Wang T. et al. . Mobile interspersed repeats are major structural variants in the human genome. Cell. 2010; 141:1171–1182. [DOI] [PMC free article] [PubMed] [Google Scholar]
- 31. Korbel J.O., Urban A.E., Affourtit J.P., Godwin B., Grubert F., Simons J.F., Kim P.M., Palejev D., Carriero N.J., Du L. et al. . Paired-end mapping reveals extensive structural variation in the human genome. Science. 2007; 318:420–426. [DOI] [PMC free article] [PubMed] [Google Scholar]
- 32. Lam H.Y.K., Mu X.J., Stutz A.M., Tanzer A., Cayting P.D., Snyder M., Kim P.M., Korbel J.O., Gerstein M.B.. Nucleotide-resolution analysis of structural variants using BreakSeq and a breakpoint library. Nat. Biotechnol. 2010; 28:47–55. [DOI] [PMC free article] [PubMed] [Google Scholar]
- 33. Kidd J.M., Cooper G.M., Donahue W.F., Hayden H.S., Sampas N., Graves T., Hansen N., Teague B., Alkan C., Antonacci F. et al. . Mapping and sequencing of structural variation from eight human genomes. Nature. 2008; 453:56–64. [DOI] [PMC free article] [PubMed] [Google Scholar]
- 34. Conrad D.F., Pinto D., Redon R., Feuk L., Gokcumen O., Zhang Y., Aerts J., Andrews T.D., Barnes C., Campbell P. et al. . Origins and functional impact of copy number variation in the human genome. Nature. 2010; 464:704–712. [DOI] [PMC free article] [PubMed] [Google Scholar]
- 35. MacDonald J.R., Ziman R., Yuen R.K., Feuk L., Scherer S.W.. The Database of Genomic Variants: a curated collection of structural variation in the human genome. Nucleic Acids Res. 2014; 42:D986–D992. [DOI] [PMC free article] [PubMed] [Google Scholar]
- 36. Benson G. Tandem repeats finder: a program to analyze DNA sequences. Nucleic Acids Res. 1999; 27:573–580. [DOI] [PMC free article] [PubMed] [Google Scholar]
- 37. Martinez-Fundichely A., Casillas S., Egea R., Ramia M., Barbadilla A., Pantano L., Puig M., Caceres M.. InvFEST, a database integrating information of polymorphic inversions in the human genome. Nucleic Acids Res. 2014; 42:D1027–D1032. [DOI] [PMC free article] [PubMed] [Google Scholar]
- 38. Bamford S., Dawson E., Forbes S., Clements J., Pettett R., Dogan A., Flanagan A., Teague J., Futreal P.A., Stratton M.R. et al. . The COSMIC (Catalogue of Somatic Mutations in Cancer) database and website. Br. J. Cancer. 2004; 91:355–358. [DOI] [PMC free article] [PubMed] [Google Scholar]
- 39. Huret J.L., Ahmad M., Arsaban M., Bernheim A., Cigna J., Desangles F., Guignard J.C., Jacquemot-Perbal M.C., Labarussias M., Leberre V. et al. . Atlas of genetics and cytogenetics in oncology and haematology in 2013. Nucleic Acids Res. 2013; 41:D920–D924. [DOI] [PMC free article] [PubMed] [Google Scholar]
- 40. Consortium G.T. Human genomics. The Genotype-Tissue Expression (GTEx) pilot analysis: multitissue gene regulation in humans. Science. 2015; 348:648–660. [DOI] [PMC free article] [PubMed] [Google Scholar]
- 41. Allen M., Heinzmann A., Noguchi E., Abecasis G., Broxholme J., Ponting C.P., Bhattacharyya S., Tinsley J., Zhang Y., Holt R. et al. . Positional cloning of a novel gene influencing asthma from chromosome 2q14. Nat. Genet. 2003; 35:258–263. [DOI] [PubMed] [Google Scholar]
- 42. Park H.S., Yeo H.Y., Chang H.J., Kim K.H., Park J.W., Kim B.C., Baek J.Y., Kim S.Y., Kim D.Y.. Dipeptidyl peptidase 10, a novel prognostic marker in colorectal cancer. Yonsei Med. J. 2013; 54:1362–1369. [DOI] [PMC free article] [PubMed] [Google Scholar]
- 43. Afanasyeva E.A., Hotz-Wagenblatt A., Glatting K.H., Westermann F.. New miRNAs cloned from neuroblastoma. BMC Genomics. 2008; 9:52. [DOI] [PMC free article] [PubMed] [Google Scholar]
- 44. Zhao Y., Li Y., Ma H., Dong W., Zhou H., Song X., Zhang J., Jia L.. Modification of sialylation mediates the invasive properties and chemosensitivity of human hepatocellular carcinoma. Mol. Cell. Proteomics. 2014; 13:520–536. [DOI] [PMC free article] [PubMed] [Google Scholar] [Retracted]
- 45. Perez-Garay M., Arteta B., Pages L., de Llorens R., de Bolos C., Vidal-Vanaclocha F., Peracaula R.. alpha2,3-sialyltransferase ST3Gal III modulates pancreatic cancer cell motility and adhesion in vitro and enhances its metastatic potential in vivo. PLoS One. 2010; 5:e12524. [DOI] [PMC free article] [PubMed] [Google Scholar]
- 46. Minn A.J., Gupta G.P., Padua D., Bos P., Nguyen D.X., Nuyten D., Kreike B., Zhang Y., Wang Y., Ishwaran H. et al. . Lung metastasis genes couple breast tumor size and metastatic spread. Proc. Natl. Acad. Sci. U.S.A. 2007; 104:6740–6745. [DOI] [PMC free article] [PubMed] [Google Scholar]
- 47. Hu G., Chong R.A., Yang Q., Wei Y., Blanco M.A., Li F., Reiss M., Au J.L., Haffty B.G., Kang Y.. MTDH activation by 8q22 genomic gain promotes chemoresistance and metastasis of poor-prognosis breast cancer. Cancer Cell. 2009; 15:9–20. [DOI] [PMC free article] [PubMed] [Google Scholar]
- 48. Aguilella C., Dubourg C., Attia-Sobol J., Vigneron J., Blayau M., Pasquier L., Lazaro L., Odent S., David V.. Molecular screening of the TGIF gene in holoprosencephaly: identification of two novel mutations. Hum. Genet. 2003; 112:131–134. [DOI] [PubMed] [Google Scholar]
- 49. Malhotra A., Shibata Y., Hall I.M., Dutta A.. Chromosomal structural variations during progression of a prostate epithelial cell line to a malignant metastatic state inactivate the NF2, NIPSNAP1, UGT2B17, and LPIN2 genes. Cancer Biol. Ther. 2013; 14:840–852. [DOI] [PMC free article] [PubMed] [Google Scholar]
Associated Data
This section collects any data citations, data availability statements, or supplementary materials included in this article.