

Abstract
Objectives
To investigate the prevalence of multimorbidity in adults with intellectual disabilities with and without Down syndrome.
Design
Large, population-based cross-sectional study.
Setting
The geographical area of one Health Board, Scotland.
Participants
All adults (aged 16+ years) known to general practitioners to have intellectual disabilities and adults receiving services provided or paid by intellectual disabilities health or social work services. 1023/1562 potential participants took part (65.5%); 562 (54.9%) men and 461 (45.1%) women, aged 43.9 years (16–83 years). 186 had Down syndrome and 837 did not.
Main outcome measures
The prevalence of International Statistical Classification of Diseases, 10th revision, physical health conditions and multimorbidity detected at a comprehensive health assessment.
Results
The mean number of physical health conditions/participant was 11.04, and 98.7% had multimorbidity. The most prevalent conditions are painful and/or disabling and, in some cases, life threatening. The five most prevalent were visual impairment, obesity, epilepsy, constipation and ataxic/gait disorders. The pattern of multimorbidity differs from that seen in the general population and is spread across the entire adult life course. The extent of multimorbidity in the adults with Down syndrome was similar to that of the adults without Down syndrome, while the prevalence of individual conditions differed.
Conclusions
This robustly designed study with a large population found an extremely high prevalence of multimorbidity in adults with intellectual disabilities across the entire adult life course. This increases complexity of medical management that secondary healthcare services and medical education are not yet geared towards, as these tend to focus on single conditions. This is in addition to complexity due to limitations in communication and understanding. As the physical conditions within their multimorbidity also differ from that seen in the older general population, urgent attention is needed to develop the care pathways and guidelines that are required to inform and so improve their healthcare.
Keywords: intellectual disabilities, down syndrome, physical health, multimorbidity, comorbidities, health inequalities
Strengths and limitations of this study.
This is the first study to have reported on multimorbidity in people with intellectual disabilities across the adult life course, where each individual had their health assessed by trained professionals.
The health assessments were systematic and detailed.
The study is large and population based, and the participation rate was high.
A limitation is that the study was only conducted in one area of Scotland.
Introduction
People with intellectual disabilities have different health needs, shorter life expectancy and other health inequalities compared with the general population.1–4 Despite this, there is surprisingly little reported on their prevalence of physical ill health and multimorbidity (two or more conditions in addition to intellectual disabilities), and few studies were population based and conducted on a large scale. Multimorbidity is important as its management is more complex than that of single conditions, with risks of drug–drug interactions, drug–disease interactions and disease–disease interactions. However, healthcare systems, and care pathways, are focused on management of single conditions. In the general population, awareness has recently been raised on the importance of multimorbidity, which becomes increasingly prevalent over the age of 50 years.5
Only five studies were identified that investigated multimorbidity among adults with intellectual disabilities. Three studies reported high rates of multimorbidity: 71% in 695 older persons with intellectual disabilities,6 80% in 1047 older persons receiving paid support7 and 40.6% in 8014 adults with intellectual disabilities.8 However, these studies are limited as two included only older adults,6 7 one of which relied on self/proxy-reporting of known health conditions out of a list of 12,6 while the other included 20 conditions,7 and the third, which was across the adult life course, reported data extracted electronically from primary care case records on 38 conditions, therefore only included conditions that had previously been presented to the general practitioner (GP).8 Two further studies reported lower rates of multimorbidity (though still higher than in the general population): 22.9% in 14 751 adults with intellectual disabilities aged 18–84 years (vs 13.3% of other people)9 and 10% in 299 adults with proxy measures of mild intellectual disabilities, aged 16–49 years (vs 5% of other people).4 The former of these included just 19 long-term conditions (selected on the basis of the UK GP contract, ie, evidenced to be of importance for the general population) and relied on extraction of information on the 19 conditions that had previously been presented to the GP. The latter reported whether people were known to have any of only 15 health conditions and focused only on adults with mild intellectual disabilities who are therefore less dissimilar from the general population than are people with more severe intellectual disabilities.4 These sampling and methodological differences account for the lower reported rates of multimorbidity in these two studies than in the other three. Only one of these five studies conducted individual health assessments (and only for some of the conditions included in the study),7 and all five studies reported on only a limited number of preselected conditions.
There is a lack of consistency in reports on the prevalence of single physical health conditions in people with intellectual disabilities, due to the differences in methods used and populations studied. Reported prevalence rates for vision problems, for example, range from 18% to 99%,10–13 gastro-oesophageal reflux disease ranges from 33% to 50%,2 14–16 untreated dental caries range from 18% to 84%17–19 and obesity ranges from 21% to 35%.20–23 Thus, findings are conflicting. Conceivably, prevalence of physical health conditions may vary by country due to differences in lifestyle, availability, affordability and organisation of healthcare. There is a lack of studies carried out in the UK on the physical health of people with intellectual disabilities.24 No UK-based data were found on the prevalence of musculoskeletal impairments, constipation or gastro-oesophageal reflux disease among people with intellectual disabilities. A recent systematic review of systematic reviews of the health or healthcare of people with intellectual disabilities also found significant gaps in research on physical health conditions.25
In summary, little is known about the extent of multimorbidity and prevalence of physical health problems in adults with intellectual disabilities. This paper reports findings from a large-scale population-based study that was conducted to address this. The aims of this study were to identify in adults with intellectual disabilities with, and without, Down syndrome:
the extent of multimorbidity
the prevalence of physical ill health
the top 20 most prevalent physical health conditions, and their associations with age, gender, level of intellectual disabilities and Down syndrome.
Methods
Individual consent to participate was taken from each person with intellectual disabilities, as far as that person had decision-making capacity to consent, with consent given by the nearest relative/welfare guardian when the participant lacked such capacity, in keeping with Scottish law. Additionally, for individuals who did not have decision-making capacity to consent, the study was explained to them in keeping with their communicative abilities, and their views were sought and respected.
Participants
The adult population (aged 16 years and over) of people with intellectual disabilities living within the geographical area of Greater Glasgow Health Board, Scotland, were identified and recruited to a cohort study between 2002 and 2004. All persons known to GPs to have intellectual disabilities, persons receiving health, social care, residential, occupational and support services provided by intellectual disabilities health or social work services or any other support hours or services funded through social work or disability allowances were approached to take part in the study.26 The GPs were financially incentivised to identify their population, and 100% in the area did so. The ascertainment rate was similar to the adult rate reported in a recent meta-analysis on prevalence of intellectual disabilities.27 Only participants within the strict study boundary were included. Of the 1562 potential participants identified, consent was gained for 1023 adults to take part (65.5%).
Measures and procedure
Six nurses reviewed primary care case records, using a structured format and data collection form. They then completed a comprehensive semi-structured health interview and targeted physical examination and followed a phlebotomy protocol, with the person with intellectual disabilities and their carer, using the C21st Health Check (http://www.gla.ac.uk/researchinstitutes/healthwellbeing/research/mentalhealth/research/projects/ucedd/). Physical examination included measurement of height and weight, waist circumference, three recordings of blood pressure, pulse rate, pulse rhythm, communication assessment, oral examination, vision, hearing, peak flow, inhaler technique (if used) and feet and nail assessments, followed by urinalysis, a phlebotomy protocol and referral protocol. Most of the physical examination was protocolled; for example, vision was assessed by first asking a series of nine questions to help detect any possible problems (eg, for persons unable to self-report, carers were asked whether the person screws up his/her eyes when in bright sunlight), then measuring vision using Kay’s pictures at 33 cm and 3 m, and referring persons with possible visual impairment to the University Visual Sciences Department for more detailed, specialist assessment; hearing, likewise, was assessed through a series of questions, then otoscopy, and if the tympanic membrane could be visualised, examination using Warblers at 1/2 m at the level of 30 db/500 Hz, 30 db/1000 Hz, 30 db/2000 Hz and 30 db/4000 Hz, with referral for specialist assessment if there was any suggestion of possible hearing impairment. If the tympanic membrane could not be visualised because of impacted cerumen, drops were first used to clear it. Blindness or low vision was only recorded if it was not corrected by spectacles/best possible correction; and hearing loss was only recorded if it was not corrected by hearing aids. Findings were discussed with one of three GPs who specialised in intellectual disabilities and who classified all the physical health conditions using the International Statistical Classification of Diseases and Related Health Problems, 10th revision (ICD-10).28 The complete assessment process took about 4 hours per participant, and conditions were recorded if present at the time of assessment (as opposed to historical conditions).
The level of intellectual disabilities of each participant, in keeping with the ICD-10 Classification of Mental and Behavioural Disorders – clinical descriptions and diagnostic guidelines,29 was derived from recorded assessments or on the basis of the score gained on the health check. A record was made of whether each person had Down syndrome.
Definition of multimorbidity
There is no standard definition for multimorbidity. A recent National Institute for Health and Care Excellence (NICE) guideline on multimorbidity reflected that while multimorbidity is most commonly defined simply as having two or more long-term conditions, this type of definition is not necessarily helpful when providing clinical care.30 Hence in the NICE guideline, the term multimorbidity refers to the presence of 2 or more long-term health conditions that can include: defined physical and mental health conditions such as diabetes or schizophrenia, ongoing conditions such as learning disability, symptom complexes such as frailty or chronic pain, sensory impairment such as sight or hearing loss and alcohol and substance misuse. The guideline coverage is for adults with two or more long-term physical health conditions and/or adults with one or more mental health conditions and at least one physical health condition. Given that the focus of this study is exclusively on adults with intellectual disabilities, we have used a tighter criteria for multimorbidity of intellectual disabilities plus at least two physical health conditions.
Analysis
Relevant data from the health check were entered into the Statistical Package for Social Services V.22.31 The number of individuals, age, gender, level of intellectual disabilities and accommodation type were analysed using descriptive statistics. Social deprivation category was based on quintiles of the Carstairs deprivation score. This ranges from 1 (most affluent) to 5 (least affluent).32 Frequency data were derived to identify the prevalence of multimorbidity and physical health conditions across all ICD-10 chapters. Twenty binary logistic regressions were conducted to determine if there were any associations between each of the 20 dependent variables (each of the 20 most prevalent physical health conditions) and the independent variables of age group, gender, level of ability and Down syndrome.
Results
Demographics
The sample comprised 562 men (54.9%) and 461 women (45.1%) with a mean age of 43.9 years (range 16–83). One hundred and eighty-six (18.2%) had a diagnosis of Down syndrome: 91 men (48.9%) and 95 women (51.1%), with a mean age of 41.1 years. Table 1 describes the demographics and characteristics of the study sample.
Table 1.
Demographics and characteristics of participants
| Participants | N (1023) (n (%)) |
Without Down syndrome N (837) (n (%)) |
With Down syndrome N (186) (n (%)) |
| Gender | |||
| Male | 562 (54.9) | 471 (56.3) | 91 (48.9) |
| Female | 461 (45.1) | 366 (43.7) | 95 (51.1) |
| Age (years) | |||
| 16–24 | 121 (11.8) | 101 (12.1) | 20 (10.8) |
| 25–34 | 156 (15.2) | 128 (15.3) | 28 (15.1) |
| 35–44 | 253 (24.7) | 192 (22.9) | 61 (32.8) |
| 45–54 | 238 (23.3) | 184 (22) | 54 (29) |
| 55–64 | 169 (16.5) | 148 (17.7) | 21 (11.3) |
| 65 and above | 86 (8.4) | 84 (10) | 2 (1.1) |
| Level of intellectual disabilities | |||
| Mild | 398 (38.9) | 321 (38.4) | 77 (41.4) |
| Moderate | 248 (24.2) | 198 (23.7) | 50 (26.9) |
| Severe | 193 (18.9) | 159 (19) | 34 (18.3) |
| Profound | 184 (18) | 159 (19) | 25 (13.4) |
| Accommodation type | |||
| Lives with family carer | 390 (38.1) | 289 (34.5) | 101 (54.3) |
| Lives independently | 102 (10) | 94 (11.2) | 8 (4.3) |
| Lives with paid support | 467 (45.7) | 404 (48.3) | 63 (33.9) |
| Lives in congregate setting | 64 (6.3) | 50 (6) | 14 (7.5) |
| Deprivation category | |||
| Most affluent | 228 (22.3) | 179 (21.4) | 49 (26.3) |
| 2 | 92 (9) | 71 (8.5) | 21 (11.3) |
| 3 | 66 (6.5) | 49 (5.9) | 17 (9.1) |
| 4 | 99 (9.7) | 84 (10) | 15 (8.1) |
| Most deprived | 538 (52.6) | 454 (54.2) | 84 (45.2) |
| White | 986 (96.4) | 803 (95.9) | 183 (98.4) |
| Non-white | 37 (3.6) | 34 (4.1) | 3 (1.6) |
| Mean number of physical health conditions | 11.04 (100) | 10.89 (100) | 11.68 (100) |
The extent of multimorbidity experienced by adults with intellectual disabilities
The highest number of current physical health conditions experienced by an individual was 28. There was a mean number of 11.04 coexisting conditions per participant (SD=4.7) (figure 1). A percentage of 99.2 of participants (n=1015) had at least one condition, and 98.7% (n=1010) had two or more conditions. Only eight participants (four males, four females) had no physical health conditions. Multimorbidity was highly prevalent across the whole of the adult life course (figure 2). Figure 2 displays the mean number of physical health conditions by gender, age and level of intellectual disabilities, showing high rates across all groups.
Figure 1.
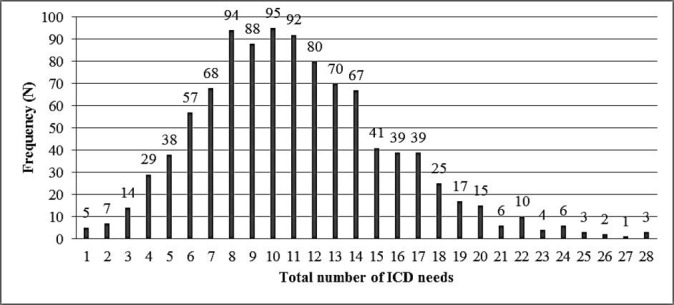
Total number of ICD-10 physical health conditions. ICD-10, International Statistical Classification of Diseases, 10th revision.
Figure 2.
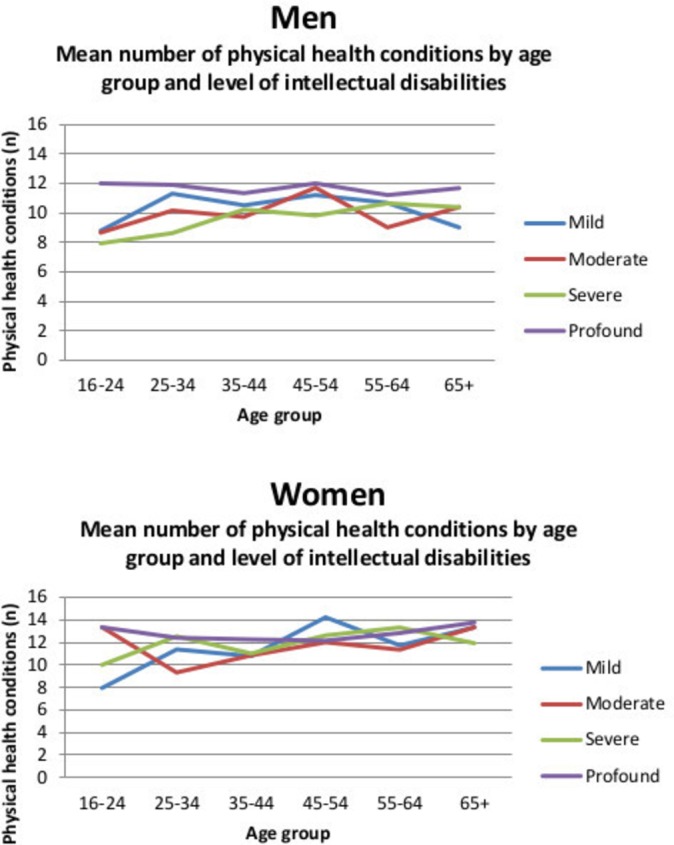
Mean number of physical health conditions by gender, age group and level of intellectual disabilities.
The extent of multimorbidity was similar for the adults with, and without, Down syndrome (figure 3). A gradient across the extent of neighbourhood deprivation was not seen for multimorbidity (figure 4).
Figure 3.
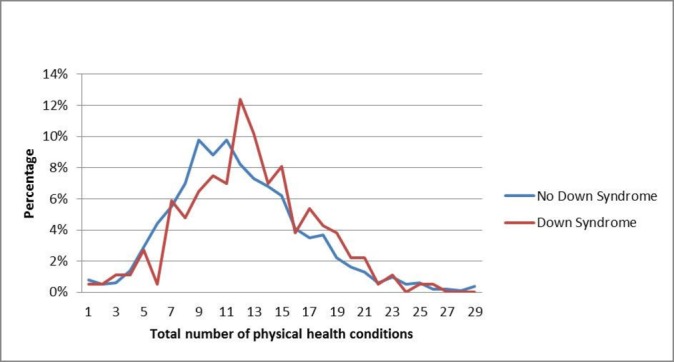
Extent of multimorbidity in individuals with intellectual disabilities with and without Down syndrome.
Figure 4.
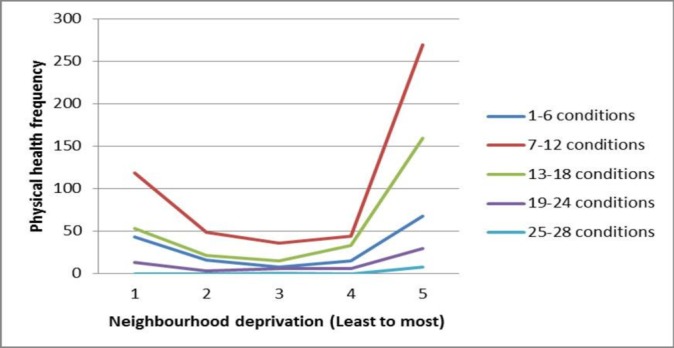
Number of physical health conditions by neighbourhood deprivation.
The prevalence of physical ill health by ICD-10 chapter
Participants were only counted once if they had more than one condition within each ICD-10 chapter (see figure 5). The most prevalent conditions reported were from the ICD-10 chapters on symptoms and signs: n=772 (75.5%); diseases of the skin and subcutaneous tissue: n=625 (61.09%); diseases of the digestive system: n=573 (56%); endocrine, nutritional and metabolic diseases: n=526 (51.4%); diseases of the nervous system: n=494 (48.3%); diseases of the musculoskeletal system and connective tissue: n=493 (48.2%); and diseases of the eye and adnexa: n=481 (47%). ICD-10 codes within the symptoms and signs chapter include physical health conditions such as ataxic gait and dysphagia.
Figure 5.

Prevalence (%) of physical ill health by ICD-10 chapter. ICD-10, International Statistical Classification of Diseases, 10th revision.
Top 20 most prevalent physical health conditions
Physical health conditions in order of prevalence were: visual impairment, obesity, epilepsy, constipation, ataxic/gait disorders, hearing impairment, nail disorder, epidermal thickening/xerosis, cerebral palsy and other paralytic syndromes, osteoporosis, fungal infection, hypertension, bone deformity, musculoskeletal pain/dorsalgia, eczema/dermatitis, gastro-oesophageal reflux disorder, dysphagia, lower respiratory tract infection, dyspnoea/wheezing and dental/oral (table 2). For adults with Down syndrome, these conditions were also common, but the most prevalent conditions were obesity, visual impairments, hearing impairments, xerosis, nail disorder and constipation, with the first five of these conditions being more prevalent than in the adults without Down syndrome. Some conditions were much less common than in the adults without Down syndrome: epilepsy, hypertension, ataxia, cerebral palsy and osteoporosis (table 2). While constipation was prevalent in the adults with Down syndrome, it was less so than for the adults without Down syndrome. For both the adults with intellectual disabilities and adults with Down syndrome, these patterns differ from the general population in whom the most prevalent physical health conditions have been reported to be, in order, hypertension, painful condition, asthma, coronary heart disease, irritable bowel, dyspepsia and diabetes.8
Table 2.
Prevalence of physical health conditions for adults with and without Down syndrome across all ICD-10 chapters
| Physical health condition | Whole cohort (n=1023) n |
Whole cohort % |
Down syndrome (n=186) (n (%)) |
Without down syndrome (n=837) (n (%)) |
|
| 1 | Visual impairment | 481 | 47 | 90 (48.4) | 391 (46.7) |
| 2 | Obesity | 415 | 40.6 | 105 (56.5) | 310 (37) |
| 3 | Epilepsy | 349 | 34.1 | 24 (13) | 325 (38.8) |
| 4 | Constipation | 346 | 33.8 | 45 (24.1) | 301 (36) |
| 5 | Ataxic/gait disorders | 306 | 29.9 | 30 (16.1) | 276 (33) |
| 6 | Hearing impairment | 276 | 26.9 | 73 (39.2) | 203 (24.2) |
| 7 | Nail disorder (eg, ingrowing nail) | 238 | 23.3 | 50 (26.9) | 188 (22.5) |
| 8 | Epidermal thickening/xerosis | 217 | 21.2 | 69 (37.1) | 148 (17.7) |
| 9 | Cerebral palsy and other paralytic syndromes | 191 | 18.7 | 8 (4.3) | 183 (21.9) |
| 10 | Osteoporosis | 189 | 18.5 | 11 (5.9) | 178 (21.3) |
| 11 | Fungal infection | 167 | 16.3 | 42 (22.5) | 125 (14.9) |
| 12 | Hypertension | 158 | 15.4 | 8 (4.3) | 150 (17.9) |
| 13 | Bone deformity | 155 | 15.1 | 27 (14.5) | 128 (15.3) |
| 14 | Musculoskeletal pain/dorsalgia | 152 | 14.9 | 32 (17.2) | 120 (14.3) |
| 15 | Eczema/dermatitis | 149 | 14.6 | 38 (20.4) | 111 (13.3) |
| 16 | Gastro-oesophageal reflux disorder | 148 | 14.5 | 26 (14) | 122 (14.6) |
| 17 | Dysphagia | 147 | 14.4 | 24 (12.9) | 123 (14.7) |
| 18 | Lower respiratory tract infection | 134 | 13 | 34 (18.3) | 100 (11.9) |
| 19 | Dyspnoea/wheezing | 131 | 12.8 | 27 (14.5) | 104 (12.4) |
| 20 | Dental/oral | 130 | 12.7 | 28 (15) | 102 (12.2) |
ICD-10, International Statistical Classification of Diseases, 10th revision.
Table 3 shows the results of the 20 regressions with the top 20 most prevalent physical health conditions as the dependant variables. It presents the ORs for gender, age, level of intellectual disabilities and presence of Down syndrome in independently predicting each of the 20 conditions. Women experienced some conditions more frequently than men, notably: obesity, constipation, epidermal thickening/xerosis, osteoporosis, dyspnoea/wheezing and musculoskeletal pain/dorsalgia. For most conditions, there is not an association with age; however, epilepsy and hearing impairment appear to be less prevalent in older age groups, and osteoporosis and hypertension are more prevalent in older age groups. Several of the conditions showed a gradient across level of ability, being more prevalent the more severe the intellectual disabilities, including visual impairment, epilepsy, constipation, ataxia, cerebral palsy, osteoporosis, bone deformity, gastro-oesophageal reflux disorder and dysphagia, whilst for obesity, hypertension and dorsalgia, the relationship with ability level was reversed.
Table 3.
Twenty regression analyses showing the independent associations of gender, level of intellectual disabilities, Down syndrome and age, with the top 20 physical health conditions (ORs (95% CIs))
| Physical health condition | Gender | Level of disability | Down syndrome | Age | ||||||||
| Ref=Male | Mild | Moderate | Severe | Profound | Ref: without | 16–24 | 25–34 | 35–44 | 45–54 | 55–64 | 65+ | |
| Vision | 0.79 (0.61 to 1.02) |
Ref | 1.12 (0.81 to 1.55) |
1.80
(1.27 to 2.57) |
2.57
(1.78 to 3.70) |
1.10 (0.79 to 1.53) |
Ref | 0.83 (0.51 to 1.35) |
1.11 (0.71 to 1.73) |
1.05 (0.67 to 1.65) |
0.88 (0.55 to 1.42) |
0.77 (0.43 to 1.36) |
| Obesity |
1.34
(1.03 to 1.73) |
Ref | 0.78 (0.56 to 1.08) |
0.65
(0.46 to 0.94) |
0.30
(0.19 to 0.45) |
2.06
(1.47 to 2.88) |
Ref | 1.35 (0.81 to 2.24) |
1.06 (0.66 to 1.70) |
1.78
(1.11 to 2.84) |
0.96 (0.58 to 1.60) |
1.21 (0.67 to 2.18) |
| Epilepsy | 1.04 (0.79 to 1.38) |
Ref |
1.57
(1.09 to 2.3) |
1.78
(1.21 to 2.62) |
4.49
(3.06 to 6.65) |
0.21
(0.13 to 0.34) |
Ref |
1.74
(1.02 to 2.97) |
1.68
(1.02 to 2.75) |
1.23 (0.74 to 2.02) |
1.02 (0.60 to 1.74) |
0.68 (0.35 to 1.30) |
| Constipation |
1.50
(1.14 to 1.97) |
Ref | 1.26 (0.88 to 1.82) |
1.85
(1.27 to 2.70) |
4.30
(2.95 to 6.28) |
0.56
(0.38 to 0.82) |
Ref | 1.38 (0.81 to 2.34) |
1.18 (0.72 to 1.94) |
1.59 (0.97 to 2.59) |
1.13 (0.67 to 1.92) |
1.15 (0.62 to 2.15) |
| Ataxic/ gait disorder |
1.23 (0.92 to 1.64) |
Ref |
2.40
(1.62 to 3.56) |
3.79
(2.51 to 5.67) |
6.66
(4.42 to 10.03) |
0.40
(0.26 to 0.62) |
Ref | 1.43 (0.81 to 2.54) |
1.37 (0.80 to 2.34) |
1.78
(1.05 to 3.03) |
1.59 (0.90 to 2.78) |
2.59
(1.36 to 4.91) |
| Hearing | 0.97 (0.73 to 1.30) |
Ref | 0.94 (0.65 to 1.36) |
1.08 (0.73 to 1.61) |
0.86 (0.56 to 1.32) |
2.46
(1.74 to 3.49) |
Ref | 0.71 (0.39 to 1.29) |
0.91 (0.54 to 1.54) |
1.22 (0.73 to 2.05) |
1.37 (0.80 to 2.38) |
4.59
(2.49 to 8.46) |
| Nail disorder | 1.24 (0.92 to 1.66) |
Ref | 1.01 (0.69 to 1.49) |
1.05 (0.70 to 1.59) |
0.9 (0.59 to 1.39) |
1.24 (0.85 to 1.80) |
Ref |
1.95
(1.02 to 3.73) |
1.70 (0.92 to 3.12) |
2.92
(1.61 to 5.29) |
1.79 (0.94 to 3.41) |
2.41
(1.20 to 4.94) |
| Epidermal thickening |
1.83
(1.34 to 2.50) |
Ref |
1.49
(1 to 2.21) |
1.23 (0.79 to 1.92) |
1.32 (0.85 to 2.07) |
2.74
(1.91 to 3.93) |
Ref |
2.87
(1.40 to 5.86) |
2.29
(1.16 to 4.53) |
2.94
(1.49 to 5.79) |
3.25
(1.60 to 6.59) |
2.34
(1.01 to 5.40) |
| Cerebral palsy | 0.86 (0.61 to 1.22) |
Ref |
2.38
(1.41 to 4.04) |
4.10
(2.43 to 6.86) |
9.86
(6.02 to 16.15) |
0.15
(0.07 to 0.32) |
Ref | 1.62 (0.86 to 3.06) |
1.17 (0.63 to 2.14) |
1.25 (0.68 to 2.29) |
0.84 (0.43 to 1.63) |
0.63 (0.27 to 1.47) |
| Osteoporosis |
2.34
(1.64 to 3.32) |
Ref |
1.68
(1.01 to 2.82) |
2.67
(1.61 to 4.44) |
9.66
(6.01 to 15.54) |
0.22
(0.11 to 0.43) |
Ref | 1.59 (0.77 to 3.26) |
2.11
(1.08 to 4.13) |
1.55 (0.78 to 3.08) |
2.40
(1.20 to 4.84) |
2.85
(1.30 to 6.27) |
| Fungal infection | 0.85 (0.60 to 1.20) |
Ref | 0.66 (0.43 to 1.03) |
0.76 (0.48 to 1.20) |
0.39
(0.22 to 0.69) |
1.68
(1.11 to 2.53) |
Ref |
9.00
(3.09 to 26.20) |
3.77
(1.29 to 10.99) |
8.22
(2.89 to 23.39) |
6.40
(2.18 to 18.79) |
5.33
(1.66 to 17.11) |
| Hypertension | 0.93 (0.65 to 1.33) |
Ref |
0.65
(0.42 to 1.00) |
0.43
(0.25 to 0.72) |
0.31
(0.17 to 0.57) |
0.22
(0.10 to 0.46) |
Ref | 2.11 (0.78 to 5.66) |
2.52
(1.01 to 6.30) |
4.49
(1.83 to 10.98) |
5.31
(2.15 to 13.16) |
7.74
(2.99 to 19.99) |
| Bone deformity | 1.31 (0.92 to 1.85) |
Ref | 1.37 (0.85 to 2.21) |
1.27 (0.76 to 2.13) |
2.96
(1.87 to 4.70) |
1.03 (0.65 to 1.64) |
Ref | 1.22 (0.6 to 2.47) |
1.01 (0.52 to 1.98) |
1.58 (0.83 to 3.02) |
1.53 (0.77 to 3.04) |
2.06 (0.95 to 4.47) |
| Musculoskeletal |
1.89
(1.32 to 2.70) |
Ref |
0.54
(0.35 to 0.85) |
0.45
(0.27 to 0.74) |
0.16
(0.07 to 0.34) |
1.14 (0.73 to 1.79) |
Ref | 2.35 (0.99 to 5.57) |
2.08 (0.92 to 4.70) |
3.10
(1.39 to 6.95) |
3.22
(1.40 to 7.41) |
2.31 (0.90 to 5.96) |
| Eczema | 0.95 (0.66 to 1.35) |
Ref | 0.62 (0.38 to 1.0) |
0.89 (0.55 to 1.45) |
0.92 (0.57 to 1.50) |
1.70
(1.12 to 2.59) |
Ref | 1.04 (0.55 to 1.97) |
0.74 (0.40 to 1.36) |
0.890 (0.49 to 1.62) |
0.71 (0.36 to 1.38) |
0.81 (0.36 to 1.81) |
| Gastro-oesophageal reflux disorder | 1.31 (0.91 to 1.87) |
Ref | 0.85 (0.5 to 1.45) |
1.40 (0.84 to 2.35) |
3.36
(2.13 to 5.29) |
0.95 (0.59 to 1.53) |
Ref | 1.05 (0.49 to 2.22) |
1.63 (0.84 to 3.18) |
1.80 (0.92 to 3.49) |
1.22 (0.58 to 2.55) |
1.21 (0.50 to 2.93) |
| Dysphagia |
1.46
(1.01 to 2.12) |
Ref |
2.35
(1.30 to 4.25) |
3.58
(1.99 to 6.44) |
10.50
(6.13 to 17.98) |
0.96 (0.58 to 1.59) |
Ref | 1.24 (0.61 to 2.50) |
1.17 (0.60 to 2.27) |
1.04 (0.53 to 2.03) |
1.39 (0.69 to 2.8) |
0.94 (0.38 to 2.32) |
| Lower respiratory tract infection | 0.9 (0.62 to 1.30) |
Ref | 0.78 (0.46 to 1.32) |
0.76 (0.43 to 1.34) |
2.51
(1.58 to 3.99) |
1.87
(1.20 to 2.92) |
Ref | 0.68 (0.35 to 1.32) |
0.64 (0.35 to 1.17) |
0.63 (0.34 to 1.17) |
0.63 (0.32 to 1.23) |
0.78 (0.34 to 1.78) |
| Dyspnoea |
2.07
(1.42 to 3.03) |
Ref | 0.95 (0.59 to 1.52) |
1.03 (0.63 to 1.69) |
0.38
(0.19 to 0.75) |
1.12 (0.70 to 1.8) |
Ref | 1.25 (0.54 to 2.88) |
1.29 (0.60 to 2.77) |
2.43
(1.16 to 5.06) |
1.30 (0.57 to 2.94) |
2.30 (0.98 to 5.44) |
| Dental health | 0.90 (0.62 to 1.31) |
Ref | 0.88 (0.54 to 1.42) |
1.15 (0.70 to 1.88) |
0.65 (0.3 to 1.16) |
1.28 (0.80 to 2.04) |
Ref | 1.90 (0.92 to 3.94) |
0.97 (0.47 to 2.01) |
1.51 (0.75 to 3.04) |
1.21 (0.56 to 2.58) |
1.31 (0.54 to 3.15) |
Numbers in bold are significant results.
Discussion
Principal findings and interpretation
It is believed that this is the first study to have reported on multimorbidity in people with intellectual disabilities across the adult life course in a large population-based sample where each individual had their health comprehensively assessed. A full range of physical health conditions were comprehensively assessed, rather than a shorter list of preselected conditions or only conditions that had already been presented to primary care or proxy measures for conditions. An extremely high prevalence of multimorbidity was reported at 98.7%. As expected, the percentage was much higher than in previous studies due to this methodology. The extent of multimorbidity was similar for both the adults with, and without, Down syndrome, though, as expected, there were some differences in the pattern of conditions. The pattern of multimorbidity also differed from the general population, hence findings from the general population are not transferrable; multimorbidity among people with intellectual disabilities requires specific study.30 Multimorbidity was prevalent across the entire adult life course, unlike the general population in whom it increases over the age of 50 years,5 hence healthcare availability is equally essential at all ages. Unlike the general population, a gradient across the extent of neighbourhood deprivation was not seen for multimorbidity as found in previous studies with adults with intellectual disabilities,8 33 hence focused services are needed in all neighbourhoods.
With regards to single conditions, visual impairment was the most prevalent condition. Previous research has highlighted that carers or health professionals are often not aware of sensory impairments34; these are often misattributed to the individual’s intellectual disabilities (diagnostic overshadowing)34 and that people with intellectual disabilities are often unable to communicate that they have a problem.35 A high index of suspicion is, therefore, needed with regards to visual impairments, particularly as these can be detected by optometrists even in people with profound intellectual disabilities. Epilepsy was also prevalent. Epilepsy among people with intellectual disabilities has previously been reported as much higher than for the general population, with seizures commonly multiple and resistant to drug treatment.25 36 Uncontrolled epilepsy can be disabling and have serious negative consequences on both quality of life and mortality.2 It is therefore essential for all healthcare practitioners to be aware of the prevalence and management of a complex and potentially life-threatening condition in the intellectual disabilities population. Constipation was the fourth most prevalent physical health condition. This has been reported as common in adults with intellectual disabilities in institutional settings37 but has received little research attention in population-based cohorts. Evenhuis38 reported on the occurrence of constipation in 70 individuals over a 10-year period (mean age 70 years, range 60–92) in a Dutch residential care centre and found that 57% suffered from chronic constipation and 56% were permanently taking laxative treatment. Eight people with chronic constipation had serious side effects (rectal prolapse, diverticula of colon, intestinal obstruction, megacolon and haemorrhoids) and four eventually died of intestinal obstruction. Thus, as well as being painful, constipation may remain undetected for a long time and can cause death due to missed clinical symptoms.38 39 Many factors can contribute to constipation including immobility, cerebral palsy, neurological disease, certain drugs, poor diet and lack of exercise.35 40 The high rate reported highlights the importance of this condition. Our study also adds to UK-based data by providing prevalence rates on musculoskeletal impairments, constipation and gastro-oesophageal reflux disease among people with intellectual disabilities, conditions previously unreported in the UK research literature.24
Constipation, osteoporosis and dorsalgia were more prevalent in women as seen in the female general population.40 41 However, the age-related increase in conditions typically seen in the general population is not apparent in our study in adults with intellectual disabilities. On average, the more severe the person’s intellectual disabilities, the younger they die,42 and the more severe a person’s intellectual disabilities, the higher the prevalence of many of the conditions, so older age groups have milder intellectual disabilities. A gradient was found across levels of ability for dorsalgia, with lower levels at more severe intellectual disabilities. This seems extremely unlikely given the higher rates of cerebral palsy and bone deformities at more severe levels of intellectual disabilities and suggests that dorsalgia is at risk of underdetection in people with communication problems. High vigilance is therefore needed for this painful condition.
The conditions in table 2 are listed as per the top 20 in the population with intellectual disabilities. It is important to note that this list would be different if it was ordered by the top 20 for the adults with Down syndrome. For example, 24.2% of the participants with Down syndrome had a thyroid disorder, which is more common than several of the other conditions listed in table 2.
We are unclear why the figures appear to show slightly higher rates of multimorbidity in the 45–54 year group for men with moderate intellectual disabilities and women with mild intellectual disabilities and the apparent high rate for young women with moderate intellectual disabilities.
Strengths and limitations
Strengths of the study are the systematic and detailed health assessments by trained health professionals, the comprehensive ascertainment of the population with intellectual disabilities, large sample size and high participation rate. Of the five adult studies out of 52 studies included in a recent meta-analysis on the prevalence of intellectual disabilities,27 moderate-to-profound intellectual disabilities were reported to account for 65%–66% of the adults with intellectual disabilities in these studies, compared with 61% in ours; that is, our rates are similar. Although the study was only conducted in one area of Scotland, it is likely that the findings are generalisable to other high-income countries. One drawback of detailed health assessments is that looking for more conditions will result in more conditions being identified. This is both a strength—as conditions are frequently overlooked in this population—but also contributes to the high prevalence of multimorbidity that was identified. We did not include mental health conditions in this study as this information has been previously published elsewhere.26 Previously published intellectual disabilities papers on multimorbidity varied in terms of whether/the extent to which they included mental health.
Implications of the study for clinicians
In the UK, secondary healthcare is organised around single conditions. This can result in lack of coordination between secondary healthcare providers, impeding patient safety. Medical education is also focused on assessment and management of single conditions, yet management of multimorbidity is far more complex. The most prevalent health conditions in adults with intellectual disabilities differ from those seen in the general population, so the recent work to better understand and address multimorbidity5 does not transfer readily to the population with intellectual disabilities. This study, therefore, starts to address an urgent need to better understand the pattern of multimorbidity in adults with intellectual disabilities that is important because it impacts on healthcare. For example, osteoporosis, which can lead to multiple fractures and non-healing of bones, is treated by bisphosphonates, but people with gastro-oesophageal reflux disorder are unlikely to tolerate them; both these conditions are in the top 20 list of conditions. People with dysphagia may be unable to take medication in tablet form for a wide range of conditions. Psychotropic drugs are commonly prescribed as mental ill health has a point prevalence of 40.9%26 in people with intellectual disabilities, but their side effects include visual disturbance, weight gain, lowered seizure threshold, constipation and ataxia—the top five conditions. It is important to note that the top 20 physical health conditions reported are known to be painful, disabling and/or life threatening and can significantly impact on quality of life; the majority of these conditions are amenable to treatment, if high quality care is provided. It is vital that healthcare professionals and carers have increased awareness of the presentation and demographics of commonly occurring conditions in adults with intellectual disabilities so that they can identify and report physical health conditions in a timely manner and thus prevent unnecessary suffering.
NICE guideline 56 on multimorbidity30 highlights that groups of conditions where treatment is discordant pose more problems of coordination and that people who are usually cared for by specialist services that tend to focus on particular types of morbidity (such as mental health in intellectual disabilities services) pose particular difficulties in management of care. Improved evidence on the multimorbidity experienced by adults with intellectual disabilities, throughout all stages of their adulthood, is therefore crucial. The findings have the potential to support policy and practice change to ensure comprehensive continuity of care in the lives of people with intellectual disabilities especially as more and more begin to live to old age. Improving healthcare provision can only contribute to making the lives of people with intellectual disabilities better.
Supplementary Material
Acknowledgments
We are grateful to all the participants and their carers and to the staff of the NHS Greater Glasgow learning disabilities primary care liaison team.
Footnotes
Contributors: DK analysed the data, jointly interpreted it and wrote the first draft of the manuscript; JM, LA, ES and S-AC jointly conceived the project, interpreted the data and contributed to the manuscript; AH jointly interpreted the data and contributed to the manuscript. All authors approved the final version of the manuscript. S-AC is the study guarantor.
Funding: The study was funded by the Greater Glasgow Health Board, the West of Scotland Research and Development Mental Health Programme and the Scottish Government. The researchers are independent from the funders.
Competing interests: None declared.
Patient consent: Obtained.
Ethics approval: The study was given ethical approval by the NHS Greater Glasgow Primary Care Trust – Community & Mental Health Research Ethics Committee (project number 0144).
Provenance and peer review: Not commissioned; externally peer reviewed.
Data sharing statement: No additional data are available.
References
- 1.NHS Health Scotland. People with Learning Disabilities in Scotland: The Health Needs Assessment Report. Scotland, Glasgow: NHS, 2004. ISBN: 1-84485-108-7. [Google Scholar]
- 2.Heslop P, Blair PS, Fleming P, et al. The Confidential Inquiry into premature deaths of people with intellectual disabilities in the UK: a population-based study. Lancet 2014;383:889–95. 10.1016/S0140-6736(13)62026-7 [DOI] [PubMed] [Google Scholar]
- 3.Emerson E, Hatton C. Health inequalities and People with Intellectual Disabilities. Cambridge: Cambridge University press, 2014. [Google Scholar]
- 4.Emerson E, Hatton C, Baines S, et al. The physical health of British adults with intellectual disability: cross sectional study. Int J Equity Health 2016;15:11 10.1186/s12939-016-0296-x [DOI] [PMC free article] [PubMed] [Google Scholar]
- 5.Barnett K, Mercer SW, Norbury M, et al. Epidemiology of multimorbidity and implications for health care, research, and medical education: a cross-sectional study. Lancet 2012;380:37–43. 10.1016/S0140-6736(12)60240-2 [DOI] [PubMed] [Google Scholar]
- 6.McCarron M, Swinburne J, Burke E, et al. Patterns of multimorbidity in an older population of persons with an intellectual disability: results from the intellectual disability supplement to the Irish longitudinal study on aging (IDS-TILDA). Res Dev Disabil 2013;34:521–7. 10.1016/j.ridd.2012.07.029 [DOI] [PubMed] [Google Scholar]
- 7.Hermans H, Evenhuis HM. Multimorbidity in older adults with intellectual disabilities. Res Dev Disabil 2014;35:776–83. 10.1016/j.ridd.2014.01.022 [DOI] [PubMed] [Google Scholar]
- 8.Cooper SA, McLean G, Guthrie B, et al. Multiple physical and mental health comorbidity in adults with intellectual disabilities: population-based cross-sectional analysis. BMC Fam Pract 2015;16:110 10.1186/s12875-015-0329-3 [DOI] [PMC free article] [PubMed] [Google Scholar]
- 9.Carey IM, Shah SM, Hosking FJ, et al. Health characteristics and consultation patters of people with intellectual disabiklity: a cross-sectional database study in English general practice. British J Gen Pract 2016. [DOI] [PMC free article] [PubMed] [Google Scholar]
- 10.Janicki MP, Dalton AJ. Sensory impairments among older adults with intellectual disability. J Intellect Dev Disabil 1998;23:3–11. 10.1080/13668259800033541 [DOI] [Google Scholar]
- 11.Kerr AM, McCulloch D, Oliver K, et al. Medical needs of people with intellectual disability require regular assessment and the provision of client- and carer-held reports. J Intellect Disabil Res 2003;47:134–45. 10.1046/j.1365-2788.2003.00453.x [DOI] [PubMed] [Google Scholar]
- 12.van Splunder J, Stilma JS, Bernsen RM, et al. Refractive errors and visual impairment in 900 adults with intellectual disabilities in the Netherlands. Acta Ophthalmol Scand 2003;81:123–9. 10.1034/j.1600-0420.2003.00035.x [DOI] [PubMed] [Google Scholar]
- 13.van Splunder J, Stilma JS, Bernsen RMD, et al. Prevalence of ocular diagnoses found on screening 1539 adults with intellectual disabilities. Ophthalmol 2004;111:1457–63. 10.1016/j.ophtha.2003.12.051 [DOI] [PubMed] [Google Scholar]
- 14.Böhmer CJ, Klinkenberg-Knol EC, Niezen-de Boer MC, et al. Gastroesophageal reflux disease in intellectually disabled individuals: how often, how serious, how manageable? Am J Gastroenterol 2000;95:1868–72. 10.1111/j.1572-0241.2000.02238.x [DOI] [PubMed] [Google Scholar]
- 15.Böhmer CJ, Taminiau JA, Klinkenberg-Knol EC, et al. The prevalence of constipation in institutionalized people with intellectual disability. J Intellect Disabil Res 2001;45:212–8. 10.1046/j.1365-2788.2001.00300.x [DOI] [PubMed] [Google Scholar]
- 16.Scott VF. Gastroesophageal reflux disease: diagnosis and management. J Assoc Acad Minor Phys 2000;11:12–14. [PubMed] [Google Scholar]
- 17.Kendall NP. Oral health of a group of non-institutionalised mentally handicapped adults in the UK. Community Dent Oral Epidemiol 1991;19:357–9. 10.1111/j.1600-0528.1991.tb00187.x [DOI] [PubMed] [Google Scholar]
- 18.Kendall NP. Differences in dental health observed within a group of noninstitutionalized mentally handicapped adults attending day centres. Comm Dent Health 1992;9:31–8. [PubMed] [Google Scholar]
- 19.Cumella S, Ransford N, Lyons J, et al. Needs for oral care among people with intellectual disability not in contact with Community Dental Services. J Intellect Disabil Res 2000;44:45–52. 10.1046/j.1365-2788.2000.00252.x [DOI] [PubMed] [Google Scholar]
- 20.Emerson E. Underweight, obesity and exercise among adults with intellectual disabilities in supported accommodation in Northern England. J Intellect Disabil Res 2005;49:134–43. 10.1111/j.1365-2788.2004.00617.x [DOI] [PubMed] [Google Scholar]
- 21.Yamaki K. Body weight status among adults with intellectual disability in the community. Ment Retard 2005;43:1–10. 10.1352/0047-6765(2005)43<1:BWSAAW>2.0.CO;2 [DOI] [PubMed] [Google Scholar]
- 22.Melville CA, Cooper S-A, Morrison J, et al. The prevalence and determinants of obesity in adults with intellectual disabilities. J Appl Res Intellect Disabil 2008;21:425–37. 10.1111/j.1468-3148.2007.00412.x [DOI] [Google Scholar]
- 23.Bhaumik S, Watson JM, Thorp CF, et al. Body mass index in adults with intellectual disability: distribution, associations and service implications: a population-based prevalence study. J Intellect Disabil Res 2008;52:287–98. 10.1111/j.1365-2788.2007.01018.x [DOI] [PubMed] [Google Scholar]
- 24.Emerson E, Baines S, Allerton L, et al. Health Inequalities and People with Learning Disabilities in the UK: 2011. Durham: Improving Health and Lives: Learning Disabilities Observatory, 2011. [Google Scholar]
- 25.Robertson J, Hatton C, Baines S, et al. Systematic reviews of the health or health care of people with intellectual disabilities: A systematic review to identify gaps in the evidence base. J Appl Res Intellect Disabil 2015;28:455–523. 10.1111/jar.12149 [DOI] [PubMed] [Google Scholar]
- 26.Cooper SA, Smiley E, Morrison J, et al. Mental ill-health in adults with intellectual disabilities: prevalence and associated factors. Br J Psychiatry 2007;20:493–501. 10.1192/bjp.bp.106.022483 [DOI] [PubMed] [Google Scholar]
- 27.Maulik PK, Mascarenhas MN, Mathers CD, et al. Prevalence of intellectual disability: a meta-analysis of population-based studies. Res Dev Disabil 2011;32:419–36. 10.1016/j.ridd.2010.12.018 [DOI] [PubMed] [Google Scholar]
- 28. The ICD-10 classification of mental and behavioural disorders: clinical descriptions and diagnostic guidelines. Geneva: World Health Organisation, 1990. [Google Scholar]
- 29. The ICD-10 classification of mental and behavioural disorders: clinical descriptions and diagnostic guidelines. Geneva: World Health Organisation, 1992. [Google Scholar]
- 30.NICE. Multimorbidity: clinical assessment and management. 2016. https://www.nice.org.uk/guidance/ng56
- 31.IBMCorp. IBM SPSS Statistics for Windows, Version 22.0. Armonk: NY: IBM Corp, 2013. [Google Scholar]
- 32.Carstairs V, Morris R. Deprivation and health in Scotland. Health Bull 1990;48:162–75. [PubMed] [Google Scholar]
- 33.Cooper S-A, McConnachie A, Allan L, et al. Health inequalities, and service use of adults with intellectual disabilities Cross-sectional study. J Intellect Disabilit Res 2011;55:313–23. [DOI] [PubMed] [Google Scholar]
- 34.Mizen L, Cooper SA. Learning disabilities. Medicine 2012;40:619–22. 10.1016/j.mpmed.2012.08.001 [DOI] [Google Scholar]
- 35.Morad M, Nelson NP, Merrick J, et al. Prevalence and risk factors of constipation in adults with intellectual disability in residential care centers in Israel. Res Dev Disabil 2007;28:580–6. 10.1016/j.ridd.2006.08.002 [DOI] [PubMed] [Google Scholar]
- 36.McGrother CW, Bhaumik S, Thorp CF, et al. Epilepsy in adults with intellectual disabilities: prevalence, associations and service implications. Seizure 2006;15:376–86. 10.1016/j.seizure.2006.04.002 [DOI] [PubMed] [Google Scholar]
- 37.Böhmer CJ, Niezen-de Boer MC, Klinkenberg-Knol EC, et al. The prevalence of gastroesophageal reflux disease in institutionalized intellectually disabled individuals. Am J Gastroenterol 1999;94:804–10. 10.1111/j.1572-0241.1999.00854.x [DOI] [PubMed] [Google Scholar]
- 38.Evenhuis HM. Medical aspects of ageing in a population with intellectual disability: III. Mobility, internal conditions and cancer. J Intellect Disabil Res 1997;41:8–18. 10.1111/j.1365-2788.1997.tb00672.x [DOI] [PubMed] [Google Scholar]
- 39.Jancar J, Speller CJ. Fatal intestinal obstruction in the mentally handicapped. J Intellect Disabil Res 1994;38:413–22. 10.1111/j.1365-2788.1994.tb00420.x [DOI] [PubMed] [Google Scholar]
- 40.Goss GL. Osteoporosis in women. Nurs Clin North Am 1998;33:573–82. [PubMed] [Google Scholar]
- 41.Higgins PD, Johanson JF. Epidemiology of constipation in North America: a systematic review. Am J Gastroenterol 2004;99:750–9. 10.1111/j.1572-0241.2004.04114.x [DOI] [PubMed] [Google Scholar]
- 42.Patja K, Iivanainen M, Vesala H, et al. Life expectancy of people with intellectual disability: a 35-year follow-up study. J Intellect Disabil Res 2000;44:591–9. 10.1046/j.1365-2788.2000.00280.x [DOI] [PubMed] [Google Scholar]
Associated Data
This section collects any data citations, data availability statements, or supplementary materials included in this article.