


Abstract
Cellular DNA/RNA tags (barcodes) allow for multiplexed cell lineage tracing and neuronal projection mapping with cellular resolution. Conventional approaches to reading out cellular barcodes trade off spatial resolution with throughput. Bulk sequencing achieves high throughput but sacrifices spatial resolution, whereas manual cell picking has low throughput. In situ sequencing could potentially achieve both high spatial resolution and high throughput, but current in situ sequencing techniques are inefficient at reading out cellular barcodes. Here we describe BaristaSeq, an optimization of a targeted, padlock probe-based technique for in situ barcode sequencing compatible with Illumina sequencing chemistry. BaristaSeq results in a five-fold increase in amplification efficiency, with a sequencing accuracy of at least 97%. BaristaSeq could be used for barcode-assisted lineage tracing, and to map long-range neuronal projections.
INTRODUCTION
DNA/RNA barcodes can be used to uniquely label individual cells within a population for lineage tracing (1–5) or neuronal projection mapping (6). Conventional approaches to reading out cellular barcodes trade off spatial resolution with throughput. Bulk sequencing achieves high throughput but sacrifices spatial resolution, whereas manual cell picking is low throughput. In situ hybridization approaches preserve cellular location but even highly multiplexed approaches cannot readily distinguish barcodes with a diversity in excess of 102–103, whereas in some applications barcode diversity can be 106–109 or beyond (7,8).
To overcome these limitations, we have been developing an in situ sequencing approach to read out cellular barcodes. In situ sequencing (9,10), which provides information at sub-cellular resolution, has the potential to achieve both high spatial resolution and high throughput. Because the diversity of a random barcode library scales exponentially with the length of the barcode, in situ sequencing of even 25 nucleotides is sufficient to distinguish 425 = 1015 barcodes, which is adequate for most applications.
There are currently three approaches for amplifying and sequencing mRNAs in situ with distinct advantages and disadvantages (Figure 1). Each begins by reverse transcribing the target into cDNA. In the first approach, the no-gap padlock approach (11) (Figure 1A), a padlock probe is hybridized to the cDNA. A padlock probe is an oligonucleotide with two ‘arms’ complementary to two adjacent sequences on the target, linked by a generic backbone sequence between the two arms. The arm hybridizing downstream, however, is placed at the 5′ end of the padlock probe, allowing the two arms to be ligated using a double-stranded DNA ligase to form a circularized ssDNA. The circularized padlock probe is then used as a template for rolling circle amplification (RCA), producing a rolling circle colony, or ‘rolony’—a <1 μm nanoball of DNA that consists of thousands of copies of the original sequence (Figure 1A). In this no-gap padlock approach, the barcode is built into the backbone of the padlock probes to differentiate among padlocks targeting different mRNAs (12). Compared with the other in situ sequencing approaches, this approach has the advantage of higher sensitivity with ∼30% RNA detection (12), but has the disadvantage that it does not capture the actual sequence of the targeted RNA since only the padlock probe sequence, not the cDNA sequence, is amplified during RCA. Because a unique probe must be synthesized for each targeted gene, this approach is not suitable for sequencing high-diversity barcode libraries. The second approach, the gap padlock approach (9) (Figure 1B), also relies on padlocks, but captures the actual sequence of the target barcode. In this approach, the padlock probes have a gap between the two arms, and a DNA polymerase is used to fill this gap (i.e. gap-filling) before circularization of the padlock probe. This process copies a part of the cDNA into the RCA template (Figure 1B). The copied barcode is then sequenced in situ. Because the DNA/RNA barcodes are flanked by known sequences, the gap-filling method can be used to readout cellular barcodes. Compared to the no-gap padlock approach, the gap padlock approach allows sequencing of the actual RNA sequence, but with lower sensitivity. The last approach, fluorescent in situ sequencing (10) (FISSEQ; Figure 1C), can also be used to read out barcodes. In a recent version of FISSEQ (10), the cDNAs produced from reverse transcription of mRNAs are directly circularized using a single-stranded DNA ligase and used as templates for RCA. Because no prior knowledge of the mRNA is required, this direct-ligation approach can be used to sample the whole transcriptome in situ, but with even less sensitivity than the gap padlock approach. All three approaches utilize sequencing by ligation (9,10) to read out the sequences of the rolonies. Because only the gap padlock approach and the direct-ligation approach could be used for barcode sequencing in situ, both with low sensitivity, we sought to improve their sensitivity and optimize them for barcode sequencing.
Figure 1.

Comparison of in situ sequencing methods. In the padlock probe-based method without gap-filling (A), the RNA is reverse transcribed with an LNA primer (magenta) to produce a cDNA containing the sequence of interest (red). A padlock probe (yellow) containing a barcode (dashed) corresponding to the mRNA identity is hybridized onto the resulting cDNA and circularized with a double stranded DNA ligase. The circularized padlock probe is then used as a template for RCA and the barcode is sequenced in situ. In the padlock probe-based method with gap-filling (B), the two padlock arms hybridizes to the sequences flanking the area to be sequenced (red dashed). The padlock probe is then gap-filled with a DNA polymerase first, followed by circularization and RCA. In the direct-ligation based FISSEQ method (C), the RNA (black) containing the sequence of interest (red) is reverse transcribed, and the resulting cDNA (blue) is circularized with a single stranded DNA ligase. The circularized single stranded cDNA is then used as a template for rolling circle amplification (RCA) to generate a rolony (green).
Here we present BaristaSeq (Barcode in situtargeted sequencing), an improved version of the gap padlock probe-based method with a five-fold increase in efficiency, suitable for sequencing cellular barcodes similar to those used in MAPseq (6), a multiplexed barcode-assisted neuronal projection mapping method using next-generation sequencing. BaristaSeq is also compatible with Illumina sequencing by synthesis (SBS), which has a higher signal-to-noise ratio (SNR) than SOLiD sequencing. We demonstrate the accuracy and efficiency of BaristaSeq by sequencing random barcodes expressed in cells in culture.
MATERIALS AND METHODS
Viruses and oligonucleotides
All viruses and oligonucleotides used are listed in Supplementary Tables S1 and S2. All oligonucleotides were acquired through IDT.
Cell culture
BHK cells were cultured in MEM-α (Thermo Fisher Scientific) supplemented with 5% FBS (Thermo Fisher Scientific), MEM Vitamin (Thermo Fisher Scientific) and Penn/Strep (Thermo Fisher Scientific) on glass bottom 96-well plates (Cellvis) coated with poly-d-lysine (Millipore). To infect BHK cells with Sindbis barcode libraries, 1 μl diluted Sindbis virus (see Supplementary Table S1 for the dilutions for each virus) was added to a well in a 96-well plate containing freshly passed BHK cells. The cells were harvested 14–18 h post-infection.
In vitro gap-filling assay
In vitro gap-filling assays were performed in 1X Ampligase buffer (Epicentre) with 10 nM padlock probes (XC1149 and XC1151) and 10 nM cDNA template (XC1498), 20 μM dNTP, 0.012 U/μl Phusion High-Fidelity DNA Polymerase (Thermo Fisher Scientific) or Stoffel fragment (DNA Gdansk), additional 50 mM KCl, 20% formamide, and glycerol to a final concentration of 10%. The reaction was kept at 37°C for 30 min. We then terminated the reactions by adding 2× TBE Urea sample buffer (Thermo Fisher Scientific) and ran the samples on 15% Novex TBE–Urea gels (Thermo Fisher Scientific). The gel was then post-stained with SYBR-Gold (Thermo Fisher Scientific) in 0.5× TBE and imaged using a Canon xti dSLR camera.
For parameter optimization experiments, all conditions were kept the same as above except for the parameter being optimized.
To quantify band intensities, we de-noised the images using a median filter and subtracted the background with a 100 pixel radius rolling ball. We then quantified each band in ImageJ and two additional background areas in the same lane, one above all the bands and one below all the bands. We then subtracted the mean background intensities from all band intensities. Images shown in the figures were before the de-noising and background subtraction.
BaristaSeq RNA amplification
Cells were washed in PBS first and then fixed in 10% buffered formalin (Electron Microscopy Sciences) for 30 mins followed by three washes in PBST (PBS with 0.5% Tween-20). The cells were then dehydrated in 70%, 85%, and 100% Ethanol, and were then kept in 100% Ethanol for at least an hour at 4°C. We then rehydrated the samples in PBST, treated the cells with 0.1 M HCl for 5 min at room temperature, followed by three washes in PBST. We then reverse transcribed the mRNAs overnight at 37°C with RevertAid H Minus M-MuLV Reverse Transcriptase (20 U/μl, Thermo Fisher Scientific) in 1× RT buffer supplemented with 1 μM LNA RT primer, 500 μM dNTP, 0.2 μg/μl BSA and 1 U/μl RiboLock RNase Inhibitor (Thermo Fisher Scientific).
On the second day, we washed the cells in PBST followed by crosslinking using 50mM BS(PEG)9 (Thermo Fisher Scientific) in PBST for 1 h at room temperature. The crosslinkers were then washed out using 1 M Tris–HCl, pH8.0, and the cells were further incubated in 1 M Tris–HCl for 30 min to neutralize residual crosslinkers. We then hybridized the padlock probes, gap-filled, and ligated them in an enzyme mix of 0.4 U/μl RNase H (Enzymatics), 0.2 U/μl Phusion High-Fidelity DNA Polymerase (Thermo Fisher Scientific), and 0.5 U/μl Ampligase (Epicentre) in 1X Ampligase buffer (Epicentre) supplemented with 100 nM padlock probes, 50 μM dNTP, 1 U/μl RiboLock RNase Inhibitor, 50 mM KCl and 20% formamide. The reactions were kept for 30 min at 37°C followed by 45 min at 45°C. We then washed the samples twice in PBST, and proceeded to rolling circle amplification at room temperature overnight using 1 U/μl ϕ29 DNA polymerase (Thermo Fisher Scientific) in 1X ϕ29 DNA polymerase buffer supplemented with 0.25 mM dNTP, 0.2 μg/μl BSA, 5% glycerol and 20 μM aminoallyl-dUTP.
On the third day, we washed the cells in PBST, crosslinked the samples using BS(PEG)9 and neutralized the crosslinkers with 1 M Tris–HCl. To visualize rolonies, we washed the samples twice with 2× SSC with 10% formamide, and incubated in the same buffer containing 0.5 μM fluorescent probes for 10 min at room temperature, followed by three washes in 2× SSC with 10% formamide and one wash in PBST. To strip the fluorescent probes from the rolonies, we incubated the samples in 80% formamide that was pre-heated to 90°C for four times, each for 2 min. We then washed the samples three times in 2× SSC with 10% formamide. To hybridize sequencing primers, we washed the samples twice in 2× SSC with 10% formamide, followed by incubation in the same buffer with 2.5 μM sequencing primers for 10 min at room temperature. The samples were then washed three times in 2× SSC with 10% formamide.
For in situ barcode amplification using the direct-ligation method, we followed the procedure described by Lee et al. (10) using a targeted RT primer (XC1016) and a targeted RCA primer (XC1017).
BaristaSeq in situ sequencing
To sequence the samples using Illumina chemistry, we manually performed sequencing reactions using Illumina HiSeq SBS kit v4 (Illumina).
For the first cycle, we first washed the samples twice in SB2 at 60°C for three minutes, followed by two synthesis steps in IRM at 60°C for 3 min. We then washed the samples four times in PBST at 60°C, and then kept the sample in USM for imaging. After imaging, we briefly washed the samples twice in SB3, and then cleaved the fluorophores by incubating the samples twice in CRM for 3 min at 60°C. We then briefly washed the samples twice in SB1 and twice in SB2, and proceed to IRM incubation as in the first cycle. When adapting this sequencing protocol to other samples, the timing required for each step likely varies with the physical format of the sample due to differences in the rate of heat transfer. The exact timing for each step should therefore be experimentally determined for a particular system to ensure that both the incorporation and the cleavage reactions are pushed to completion in each cycle.
To sequence the samples using SOLiD chemistry, we used the SOLiD FWD SR S50 Kit (Thermo Fisher Scientific) and followed the procedure described by Lee et al. (10). Briefly, we washed the samples twice with 1× Instrument Buffer (Thermo Fisher Scientific) and then incubated the samples in a reaction mix containing 6 U/μl T4 DNA ligase (Enzymatics) and 5 μl SOLiD sequencing oligonucleotides in 200 μl of 1× T4 DNA ligase buffer for 45 min at room temperature. We then washed the samples four times with 1× Instrument Buffer for 5 min each, and imaged the sample. After imaging, we incubate the samples twice in Cleave Solution 1 for 5 min each, followed by two incubations in Cleave Solution 2.1 for 5 min each. We then washed the samples three times with 1× Instrument Buffer and proceeded to the next cycle.
Subsampling and quantification of rolonies
We mixed two padlocks (XC1613 and XC1614) at 1:100 ratio during the padlock gap-filling/ligation step. The two padlocks have the same arm sequences, but the backbone sequences differ so that they can be recognized by two different fluorescent probes (XC92 and XC1380). After rolony generation, we probed the samples with the probe targeting the diluted padlock and counted the rolonies. To prevent bias caused by the difference between the two padlock probes, we swapped the two padlock probes and counted the rolonies from the lesser padlock probe again. We then pooled the data and calculated the mean to get the 100-fold subsampled rolony counts.
The rolonies were counted in ImageJ using the ‘Find Maxima’ function with a predetermined threshold across all samples. All P values reported were obtained using two-tailed Student's t test with Bonferroni correction.
Microscopy
All microscopy was performed on a Perkin-Elmer Ultraview Vox spinning disk confocal microscope or a Zeiss LSM 710 laser scanning confocal microscope. For sequencing images, the following settings were used for the four imaging channels on the LSM 710: G(cyan), 514 nm Ex, 483–559 nm Em; T(yellow), 514 nm Ex, 635–693 nm Em; A(magenta), 633 nm Ex, 604–672 nm Em; C(white), 633 nm Ex, 700–758 nm Em. The settings on the Ultraview Vox were: G(cyan), 514 nm Ex, 550/49 nm Em; T(yellow), 561 nm Ex, 615/70 nm Em; A(magenta), 640 nm Ex, 679/29 nm Em; C(white), 640 nm Ex, 775/140 nm Em. The filter cubes on the Ultraview Vox were obtained through Semrock. The images shown in Figure 4C and the subsampling images in Figure 3A were acquired on the spinning disk microscope. All other images were obtained on the laser scanning confocal microscope.
Figure 4.

Improving in situ barcode amplification for sequencing. (A) Barcode amplicons with (+) or without (–) the post-RCA crosslinking before (Hyb 1) and after (Hyb 2) stripping with formamide and reprobing with a fluorescent probe. Scale bars = 20 μm. (B) Mean S/N ratios of rolonies during several hybridization cycles with (+) or without (–) BS(PEG)9 crosslinking after RCA. Error bars indicate SEM. N = 3 biological replicates. (C) Representative images of in situ barcode sequencing images using Illumina (top row) sequencing or SOLiD (bottom row) in BHK cells. The images were median filtered, but did not go through background subtraction. Scale bars = 20 μm. (D) Comparison of S/N ratio for SOLiD sequencing and Illumina sequencing over six cycles.
Figure 3.

Quantification of rolony formation using BaristaSeq. (A) Top row: representative images of barcode amplicons in BHK cells using the indicated methods. Inset in the top right image shows the same image with 20× gain during post-processing. Bottom row: representative images of barcode amplicons in BHK cells with 100× subsampling. One in ∼100 rolonies were visualized in these images. Scale bars = 20 μm. (B and C) Average number of barcode amplicons per cell using the indicated methods in BHK cells with (B) or without (C) Sindbis virus. Error bars indicate SEM. *P = 0.01, **P < 0.005, ***P < 0.0005 after Bonferroni correction. The numbers of cells counted are indicated on top of each bar. Quantification for both padlock approaches were done using subsampling.
To compensate for the bleed through of the four sequencing dyes in the four imaging channels and to normalize their signals, we generated rolonies using padlocks XC1308–XC1311 in four separate samples, and using a mixture of the four padlocks in a fifth sample, then sequenced one base using XC1312 as the sequencing primer. XC1312 reads into a barcode built into the backbones of the padlocks XC1308–XC1311, thus allowing the first four samples to contain sequencing signals from only one dye. Because the cells were filled with rolonies, the cells in the fifth sample contained a roughly equal amount of rolonies in all four dyes. We then imaged the first four samples using the four channels to calculate the bleed through, and used the fifth sample to adjust the exposure and gains to equalize the signals for the four sequencing dyes.
Data analysis
All post-processing of sequencing data were done in Matlab (Mathworks). We first compensated for the bleed through in the four channel images. We then aligned the images from multiple sequencing cycles using Enhanced Cross Correlation (18) (ECC, available at http://iatool.net/). We manually selected ROIs on sequenced cells, further subtracted background caused by the nuclei, and assigned the channel with the strongest signal as the base in that cycle. The quality of the basecalls were defined as the intensity of the strongest channel divided by the root mean square of all four channels. Cells that expressed multiple barcodes were identified as cells with significant signals in two or more channels in more than two of the first five cycles.
The calculation of SNR was done in six fields of view in two biologically independent samples each for Illumina sequencing and SOLiD sequencing. In each field of view, we first merged the four sequencing channels into a single channel, taking the maximum value of the four channels at each pixel. We then calculated the SNR for three infected cells in that field of view by dividing the mean intensity in each cells against mean intensities of three uninfected cells, all corrected for the black point of the camera. The black point of the camera is measured as the mean value at three locations within the same field of view that had no cells or rolonies. The SNR of the field of view was taken as the mean of the SNR of the three cells, and the total SNR for that cycle was the mean SNR of the six fields of view.
RESULTS
In what follows we describe and characterize BaristaSeq. First, we demonstrate that aberrant gap-filling is an important mechanism limiting the sensitivity of previous in situ padlock-based sequencing approaches, and show that this inefficiency can be overcome by using a different polymerase. Next, we optimize BaristaSeq for sequencing long barcodes. Finally, we characterize the sensitivity and accuracy of BaristaSeq by sequencing a 15-nt barcode in BHK cells in culture.
Improved gap-filling in padlock-based targeted in situ RNA amplification
We first sought to identify the causes for the lower efficiency of the gap-filling padlock-based method. The padlock-based method can be used without gap-filling to detect mRNAs (Figure 1B). The efficiency, however, drops significantly when gap-filling is used to interrogate the mRNA sequences. Because ligation of a gap padlock requires the polymerase to fill the gap exactly to the base next to the ligation junction (Figure 2A, top), gap-filling could reduce the overall efficiency in two ways. First, insufficient polymerization would cause the gap to be filled only partially (Figure 2A, middle), making ligation impossible. Second, some DNA polymerases with strand displacement activity may over-extend the padlock probe, also preventing the ligation (Figure 2A, bottom).
Figure 2.

Optimization of gap-filling in in situ barcode sequencing. (A) Illustrations of normal (top) and aberrant gap-filling products caused by insufficient gap-filling (middle) and overextension (bottom). (B) In situ barcode amplification in infected BHK cells with padlock probes that require (gap) or do not require (no gap) gap-filling using the indicated polymerases. Scale bars = 20 μm. (C) In vitro gap-filling assay performed on padlocks that require (+ gap) or do not require (– gap) gap-filling using no polymerase (–), the Stoffel fragment (S) or Phusion DNA polymerase (P) in the presence (+ cDNA) or absence (– cDNA) of a cDNA template. Arrows on the left, from top to bottom, indicate positions for strand displaced gap-filling product, correct gap-filling product for ‘+ Gap’ padlock, pre-gapfilling padlock, and the cDNA template. (D) The means and SEMs of the fraction of the correct gap-filling product using the gap padlock (top, black bars) and the fraction of over-extended products using the no-gap padlock (bottom, white bars) with the indicated polymerases. N = 3 for all enzymes. (E–G) The means and SEMs of the faction of correct gap-filling product using the gap padlock (top) and the fraction of over-extended products (bottom) using either the gap padlock (solid lines) or the no-gap padlock (dashed lines) with either Phusion DNA polymerase (black dots) or the Stoffel fragment (white dots). The reactions were performed with the indicated dNTP concentrations (E), with the indicated enzyme concentrations (F), or at the indicated temperature (G). N = 3 for each condition in (E) and (F) and N = 4 for each condition in (G).
For in vitro padlock probe applications, many factors, including probe concentration, dNTP concentration (13), and polymerase choice (14), affect the total efficiency. Many DNA polymerases, including the Tfl polymerase (15), variants of the Taq polymerase (13,16,17), and variants of the Pfu polymerase (14), have been used for gap-filling. The Stoffel fragment polymerase, a truncated form of Taq polymerase without flap endonuclease activity, has been a popular choice for these applications and for in situ amplification of mRNA (9), presumably because of weaker strand displacement activity (17). It is unclear, however, whether the Stoffel fragment actually gap-fills effectively both in situ and in vitro.
To test the efficiency of gap-filling, we amplified a Sindbis virus RNA target using two different padlock probe designs, one with an 11-nt gap between the two padlock arms and one without a gap. As expected, in the absence of a gap-filling polymerase, the target RNA was efficiently amplified with a no-gap padlock, but no amplification was observed with the gap padlock (Figure 2B1 versus Figure 2B4). Consistent with previous reports, gap-filling using the Stoffel fragment polymerase on the gap padlock was inefficient (Figure 2B2).
If the Stoffel fragment is inefficient at polymerization in situ, then we would not expect it to affect the overall efficiency when the no-gap padlock was used. Our results, however, did not support this hypothesis, because adding the Stoffel fragment polymerase when using the no-gap padlock—conditions under which no polymerization is required—actually reduced the efficiency of amplification (Figure 2B5 vs Figure 2B4) to a similar degree as when the gap padlock was used (Figure 2B2). This suggested that the reduced efficiency observed when using the Stoffel fragment for gap-filling was not due solely to insufficient polymerization in situ.
We hypothesized that the Stoffel fragment was producing over-extended products. Such aberrant products could arise if the absence of flap endonuclease activity in the Stoffel fragment did not eliminate its strand displacement activity. We tested this hypothesis by performing the gap-filling reaction in vitro on a mock cDNA product. Consistent with the hypothesis that the padlock probes were overextended, most padlocks were extended either for a few bases or to the end of the cDNA when the Stoffel fragment was added to the no-gap padlock in the presence of the cDNA (Figure 2C). No extension was observed in the absence of the cDNA, suggesting that such over-extension was template-dependent. Furthermore, the Stoffel fragment also overextended the gap padlock in the presence of cDNA without producing the correct gap-filling product (Figure 2C). These results support the hypothesis that the strand displacement activity of the Stoffel fragment produced aberrant gap-filling products.
If strand displacement reduced the efficiency of gap-filling, then using a DNA polymerase without strand displacement activity should increase the efficiency of gap-filling. We therefore tested several DNA polymerases without strand displacement activity for gap-filling in vitro (Figure 2D). Phusion DNA polymerase, a Pfu-based DNA polymerase, produced much less overextended product in the absence of a gap and converted 52 ± 2% (N = 13) of all gap padlocks to the correct gap-filled product (Figure 2C). No other polymerase tested produced efficient gap-filling. We speculate that the inefficient polymerization seen with other polymerases might be due to the presence of formamide in our reactions, which is necessary for gap-filling in situ. We screened different dNTP concentrations (Figure 2E), enzyme concentrations (Figure 2F), and reaction temperatures (Figure 2G) for the optimal reaction conditions for both Phusion polymerase and the Stoffel fragment. Compared to Phusion polymerase under the optimal conditions, the Stoffel fragment always underperformed in gap-filling efficiency (Figure 2E–G, upper panel) and produced more over-extended products (Figure 2E–G, lower panel) under all conditions we have tested. Consistent with the efficient gap-filling in vitro, Phusion DNA polymerase also resulted in efficient amplification of RNA in situ using both the gap padlock and the no-gap padlock (Figure 2B). Therefore, Phusion DNA polymerase is more efficient at gap-filling on padlock probes than the Stoffel fragment due to the lack of strand displacement activity. We therefore used Phusion DNA polymerase for BaristaSeq.
To estimate the relative efficiency of BaristaSeq compared to existing methods, we generated rolonies on baby hamster kidney (BHK) cells infected with a Sindbis virus. Because the density of rolonies exceeded the optical resolution, we subsampled 1% of all rolonies (see Materials and Methods) and estimated the total number of rolonies. Briefly, we used two padlock probes with the same sequences in the two arms complementary to the target sequence, but with different sequences in the backbone. The differences in the backbone allowed us to visualize each probe individually using one of two fluorescent oligonucleotides. To subsample the rolonies, we generated rolonies using a mixture of the two padlock probes at a ratio of 1:100, and visualized the rolonies with the fluorescent oligo complementary to the lesser padlock probe. We then estimated the total number of rolonies by multiplying the number of visualized rolonies by 100. The original padlock strategy generated 1300 ± 100 (mean ± SEM, n = 59; Figure 3A, B) rolonies per cell, whereas our improved method generated 7000 ± 200 rolonies (n = 63, P < 0.0005 compared to the original strategy; Figure 3A and B). In comparison, the targeted direct-circularization FISSEQ method (Figure 1C) generated 12 ± 1 (n = 36, P < 0.0005 compared to both padlock strategies; Figure 3A and B) rolonies. The false detection rate as measured in non-infected cells was also lower with the optimized padlock method [0.2 ± 0.1 rolonies per cell (n = 17)] compared to both the direct method [1.7 ± 0.4 per cell (n = 17), P < 0.005] and the original padlock probe-based approach (0.9 ± 0.2 rolonies per cell, n = 16, P = 0.01; Figure 3C). We thus conclude that BaristaSeq was 5.4-fold more sensitive, and also more specific, than the original gap-filling padlock method using the Stoffel fragment.
Adapting Illumina sequencing for in situ barcode sequencing
The original padlock approaches described by Ke et al. (9) were designed for reading SNPs and short barcodes (up to four bases) corresponding to gene identities. To sequence longer barcodes, we stabilized the rolonies through crosslinking using a method similar to that described previously (10). This modification stabilized the rolonies even under repeated heating and stripping with formamide (Figure 4A and B).
We also adapted Illumina sequencing chemistry to sequence rolonies generated using BaristaSeq. Previously reported in situ sequencing methods all utilized sequencing by ligation. We reasoned that due to multiple years of commercial optimization and the performance of Illumina sequencing chemistry in vitro, Illumina sequencing may produce better signals than sequencing by ligation. Indeed, sequencing by ligation using SOLiD chemistry produced stronger background fluorescence (Figure 4C) and on average 2-fold lower signal-to-noise ratio (Figure 4D) than Illumina sequencing chemistry. Therefore, Illumina chemistry is superior to SOLiD for in situ barcode sequencing.
Sequencing cellular barcodes in situ using Illumina sequencing chemistry
To evaluate the accuracy of basecalling cellular barcodes using BaristaSeq, we infected BHK cells with a Sindbis virus library encoding random 30-nt barcodes. The same virus library was used in Multiplexed Analysis of Projections by Sequencing (MAPseq) (6), a barcode assisted method that maps the single-cell projection patterns of thousands of neurons simultaneously. We then amplified barcodes and sequenced the first 15 bases of the barcodes in situ using Illumina sequencing (Figure 5A and B). The sequencing quality was consistently high throughout all 15 cycles (Figure 5C). The intensity of the signals was maintained with only minimal (13.9 ± 0.9 bits in cycle 1 versus 11.9 ± 0.8 bits in cycle 15) reduction over 15 cycles (Figure 5D). The fractions of the four bases remained approximately equal, as expected from a random barcode library (Figure 5E). As expected, for each particular base call, the quality of the base call generally increased with the intensity of the signals (Figure 5F).
Figure 5.

BaristaSeq in barcoded BHK cells. (A) Representative sequencing image of the first cycle. Scale bar = 50 μm. (B) Sequencing images of cycle 1, cycle 8 and cycle 15 of the indicated area from (A). The circled cell is basecalled below the images. (C) The intensity of the four channels, (D) fraction of the four bases and (E) the quality of the base calls are shown over 15 cycles of Illumina sequencing in situ. (F) Quality of base calls and the intensity of the called channel for individual base calls. Black indicates correct base calls; magenta indicates base calls from in situ reads that did not match to in vitro reads; cyan indicates base calls from cells expressing more than one barcode.
We aligned in situ sequencing reads with all known barcode sequences in the library. The library contained 1.5 million known 30-nt barcode sequences, which represented ∼97% of all barcodes in the library. For in situ sequencing, we called barcodes in 206 randomly selected cells from four imaging fields. Three cells were infected with more than one barcode per cell and were not analyzed further. Out of the remaining 203 cells, 97% (196) of called barcodes were perfect matches to sequences in the known barcode ensemble (Figure 6A and B). To determine if these matched barcodes were due to chance, we generated random 15-nt barcodes and attempted to match them to the known barcode ensemble. Only 0.27 ± 0.05 (mean ± SEM, n = 100) out of 206 random 15-nt sequences matched perfectly by chance (typical random sequences had two mismatches), suggesting that the matched barcodes were unlikely to be false positives. The accuracy of BaristaSeq for sequencing 15-nt barcodes is thus at least 196/203, or 97%.
Figure 6.
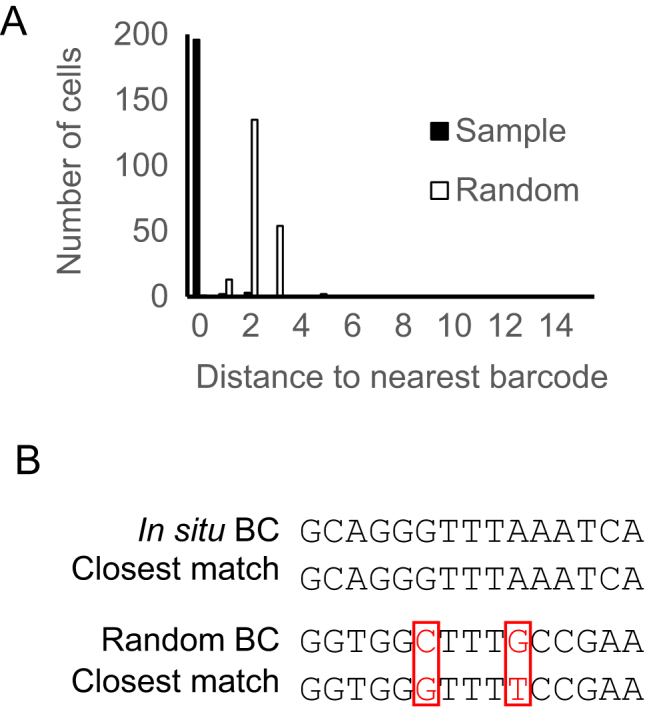
Comparison of BaristaSeq reads to conventional Illumina sequencing reads. (A) Histogram of the number of mismatches between the in situ reads and their closest matches from in vitro reads (Sample) and the number of mismatches between random sequences and their closest matches from in vitro reads (Random). (B) Examples of a barcode read in situ and its closest match in vitro, and a random sequence and its closest match in vitro. Red indicates mismatches.
The seven barcodes that did not match to the known barcode ensemble could have originated from sequencing errors, or they could correspond to the 3% unknown barcodes in the library. Our results suggest that the latter explanation is more likely, because the quality of the unmatched barcode reads (magenta, Figure 5F) were similar to that of the matched barcode reads (black, Figure 5F). In contrast, cells that were labeled with more than one barcode (cyan, Figure 5F) had significantly lower qualities for many base calls. The real accuracy of BaristaSeq is thus likely to be higher than the estimated 97%. These results indicate that BaristaSeq is highly accurate for cellular barcode sequencing.
DISCUSSION
We have presented BaristaSeq, a method for efficient and accurate sequencing of cellular barcodes in situ. We examined the cause of the low efficiency during padlock probe-based targeted in situ RNA amplification with gap-filling and replaced the Stoffel fragment with a Pfu based DNA polymerase. The lack of strand displacement activity of Pfu significantly increased the efficiency of gap-filling. The strand displacement activity, however, may not be the only cause for inefficient gap-filling, since gap-filling with Pfu still produced fewer rolonies than using a gapless padlock probe without a polymerase (Figure 2B). One possible cause of this difference is that the Pfu polymerase has 3′→5′ exonuclease activity, which may digest the padlock probes and/or the cDNA product and thus reduce the amount of amplicons. Therefore, engineering of the gap-filling polymerase and optimization of the reaction conditions may further increase gap-filling efficiency.
The original padlock-based method was designed as a multiplexed in situ mRNA detection method (without gap-filling) or as a targeted SNP detection method (with gap-filling). In both cases, sequencing is limited to only a few bases (up to 4nt), and is performed at room temperature. The rolonies generated were stable enough under these conditions to allow sequence readout. To sequence longer barcodes, we made two modifications. First, we stabilized the amplicons through crosslinking (10). The increased stability of amplicons ensured minimal signal loss during heat cycles, which is essential for sequencing long barcodes. Second, we used Illumina sequencing chemistry instead of Sequencing by Ligation (SOLiD). We showed that Illumina sequencing has lower background signal than SOLiD when used in situ, even when sequencing short reads. One possible reason for this may be that the SOLiD reaction mix contains 1024 different types of short oligonucleotides, a quarter of which are labeled with a particular fluorophore, whereas the Illumina reaction mix only contains four different labeled nucleotides. The large number of unused oligonucleotides in each SOLiD cycle have the potential to bind non-specifically to tissue and increase background signal. Such differences may be more striking when sequencing in tissue sections, where non-specific binding of fluorophores tends to be more severe. Therefore, although both Illumina sequencing and SOLiD can sequence up to 35 nucleotides in vitro with similar performance, Illumina sequencing is superior for in situ sequencing.
DNA/RNA barcodes can be used as unique cellular tags to distinguish individual cells. DNA barcodes have been used in cellular lineage tracing for either small populations of cells (1–4) or throughout a whole organism (5). Recently, we have used RNA barcodes to label neurons for multiplexed projection mapping (MAPseq) (6). In these reports, the locations of the neurons under investigation had to be determined by manually picking individual neurons—a method which scales poorly. Efficient barcode sequencing in situ would allow us to preserve the location of each neuron's soma while still maintaining high-throughput lineage tracing and projection mapping. Furthermore, in the case of MAPseq where the barcodes fill the neurons, in situ barcode sequencing would potentially allow visualization of the morphology of individual neurons. Preserving the locations of the cells being sequenced would allow correlation of lineages and projections with other information, such as gene expression assayed through FISH and neuronal activities assayed through functional imaging, at cellular resolution.
AVAILABILITY
All in situ sequencing data are publicly available in Dryad: doi:10.5061/dryad.5dd92at.
Supplementary Material
ACKNOWLEDGEMENTS
The authors would like to acknowledge Richie Kohman, Justus Kebschull, Ian Peikon, Ashlan Reid and Shaina Lu for useful discussions and assistance, and Barry Burbach, Nour El-Amine and Stephen Hearn for technical support.
Author contributions: X.C. and A.M.Z conceived the study. X.C. and Y.S. performed experiments. X.C. and A.M.Z. analyzed the data. X.C., A.M.Z., G.M.C., and J.H.L. discussed and wrote the paper.
SUPPLEMENTARY DATA
Supplementary Data are available at NAR Online.
FUNDING
National Institutes of Health [5RO1NS073129 to A.M.Z., 5RO1DA036913 to A.M.Z.]; Brain Research Foundation [BRF-SIA-2014-03 to A.M.Z.]; IARPA MICrONS; Simons Foundation [382793/SIMONS to A.M.Z.]; Paul Allen Distinguished Investigator Award [to A.M.Z.]; postdoctoral fellowship from the Simons Foundation (to X.C.); CSHL Shared Resources, which are funded, in part, by the Cancer Center Support Grant [5P30CA045508]. Funding for open access charge: Simons foundation [SCGB 350789].
Conflict of interest statement. None declared.
REFERENCES
- 1. Walsh C., Cepko C.L.. Widespread dispersion of neuronal clones across functional regions of the cerebral cortex. Science. 1992; 255:434–440. [DOI] [PubMed] [Google Scholar]
- 2. Walsh C., Cepko C.L.. Clonal dispersion in proliferative layers of developing cerebral cortex. Nature. 1993; 362:632–635. [DOI] [PubMed] [Google Scholar]
- 3. Mayer C., Jaglin X.H., Cobbs L.V., Bandler R.C., Streicher C., Cepko C.L., Hippenmeyer S., Fishell G.. Clonally related forebrain interneurons disperse broadly across both functional areas and structural boundaries. Neuron. 2015; 87:989–998. [DOI] [PMC free article] [PubMed] [Google Scholar]
- 4. Harwell C.C., Fuentealba L.C., Gonzalez-Cerrillo A., Parker P.R., Gertz C.C., Mazzola E., Garcia M.T., Alvarez-Buylla A., Cepko C.L., Kriegstein A.R.. Wide dispersion and diversity of clonally related inhibitory interneurons. Neuron. 2015; 87:999–1007. [DOI] [PMC free article] [PubMed] [Google Scholar]
- 5. McKenna A., Findlay G.M., Gagnon J.A., Horwitz M.S., Schier A.F., Shendure J.. Whole-organism lineage tracing by combinatorial and cumulative genome editing. Science. 2016; 353:aaf7907. [DOI] [PMC free article] [PubMed] [Google Scholar]
- 6. Kebschull J.M., Garcia da Silva P., Reid A.P., Peikon I.D., Albeanu D.F., Zador A.M.. High-throughput mapping of single-neuron projections by sequencing of barcoded RNA. Neuron. 2016; 91:975–987. [DOI] [PMC free article] [PubMed] [Google Scholar]
- 7. Chen K.H., Boettiger A.N., Moffitt J.R., Wang S., Zhuang X.. RNA imaging. Spatially resolved, highly multiplexed RNA profiling in single cells. Science. 2015; 348:aaa6090. [DOI] [PMC free article] [PubMed] [Google Scholar]
- 8. Moffitt J.R., Hao J., Bambah-Mukku D., Lu T., Dulac C., Zhuang X.. High-performance multiplexed fluorescence in situ hybridization in culture and tissue with matrix imprinting and clearing. Proc. Natl. Acad. Sci. U.S.A. 2016; 113:14456–14461. [DOI] [PMC free article] [PubMed] [Google Scholar]
- 9. Ke R., Mignardi M., Pacureanu A., Svedlund J., Botling J., Wahlby C., Nilsson M.. In situ sequencing for RNA analysis in preserved tissue and cells. Nat. Methods. 2013; 10:857–860. [DOI] [PubMed] [Google Scholar]
- 10. Lee J.H., Daugharthy E.R., Scheiman J., Kalhor R., Yang J.L., Ferrante T.C., Terry R., Jeanty S.S., Li C., Amamoto R. et al. Highly multiplexed subcellular RNA sequencing in situ. Science. 2014; 343:1360–1363. [DOI] [PMC free article] [PubMed] [Google Scholar]
- 11. Larsson C., Koch J., Nygren A., Janssen G., Raap A.K., Landegren U., Nilsson M.. In situ genotyping individual DNA molecules by target-primed rolling-circle amplification of padlock probes. Nat. Methods. 2004; 1:227–232. [DOI] [PubMed] [Google Scholar]
- 12. Larsson C., Grundberg I., Soderberg O., Nilsson M.. In situ detection and genotyping of individual mRNA molecules. Nat. Methods. 2010; 7:395–397. [DOI] [PubMed] [Google Scholar]
- 13. Li J.B., Gao Y., Aach J., Zhang K., Kryukov G.V., Xie B., Ahlford A., Yoon J.K., Rosenbaum A.M., Zaranek A.W. et al. Multiplex padlock targeted sequencing reveals human hypermutable CpG variations. Genome Res. 2009; 19:1606–1615. [DOI] [PMC free article] [PubMed] [Google Scholar]
- 14. Shen P., Wang W., Chi A.K., Fan Y., Davis R.W., Scharfe C.. Multiplex target capture with double-stranded DNA probes. Genome Med. 2013; 5:50. [DOI] [PMC free article] [PubMed] [Google Scholar]
- 15. Abravaya K., Carrino J.J., Muldoon S., Lee H.H.. Detection of point mutations with a modified ligase chain reaction (Gap-LCR). Nucleic Acids Res. 1995; 23:675–682. [DOI] [PMC free article] [PubMed] [Google Scholar]
- 16. Porreca G.J., Zhang K., Li J.B., Xie B., Austin D., Vassallo S.L., LeProust E.M., Peck B.J., Emig C.J., Dahl F. et al. Multiplex amplification of large sets of human exons. Nat. Methods. 2007; 4:931–936. [DOI] [PubMed] [Google Scholar]
- 17. Akhras M.S., Unemo M., Thiyagarajan S., Nyren P., Davis R.W., Fire A.Z., Pourmand N.. Connector inversion probe technology: a powerful one-primer multiplex DNA amplification system for numerous scientific applications. PLoS One. 2007; 2:e915. [DOI] [PMC free article] [PubMed] [Google Scholar]
- 18. Evangelidis G.D., Psarakis E.Z.. Parametric image alignment using enhanced correlation coefficient maximization. IEEE Trans. Pattern Anal. Mach. Intell. 2008; 30:1858–1865. [DOI] [PubMed] [Google Scholar]
Associated Data
This section collects any data citations, data availability statements, or supplementary materials included in this article.