. 2018 Feb 28;7:e32692. doi: 10.7554/eLife.32692

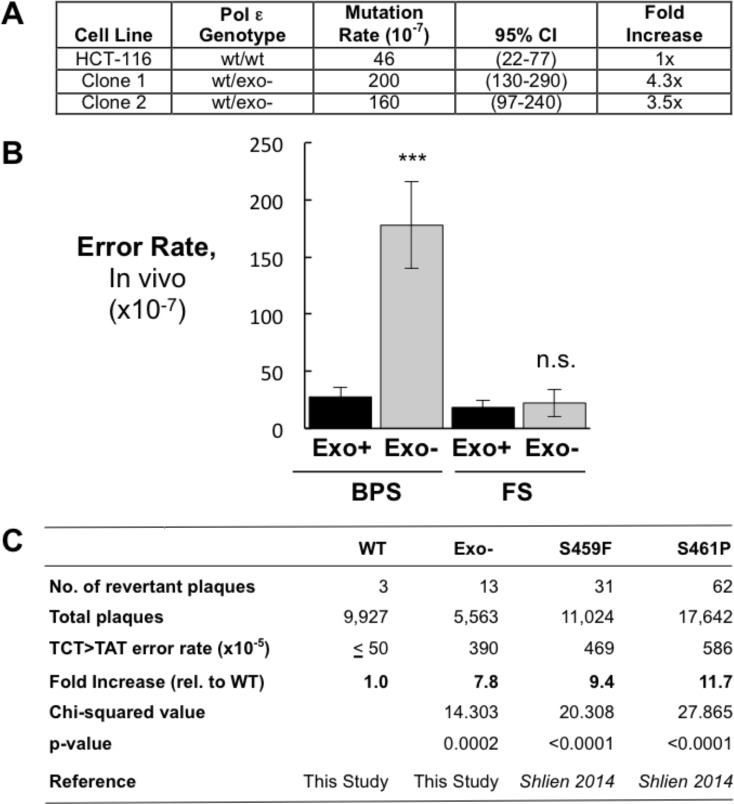
Figure 1. Heterozygous inactivation of Pol ε proofreading causes an increase in specific base pair substitutions.

(A) Mutation rates were measured using the fluctuation assay at the HPRT1 locus by resistance to 6-thioguanine. Mutation rates and 95% confidence intervals were measured by fluctuation analysis as described in the Methods using the Ma-Sandri-Sarkar Maximum Likelihood Estimator. Twelve independent isolates of both the parental (wt/wt) cell line and two independently derived clones of the heterozygous cell lines (wt/exo-) were used. All cell lines were mismatch repair-deficient. P-values for Clones 1 and 2 (p=0.0017 and p=0.008, respectively) were calculated using an unpaired t-test relative to wt/wt. Mutation rates for Clone 1 and Clone 2 were not significantly different from one another (p=0.4727). (B) Error rates for base pair substitutions (BPS) and small insertion/deletion frameshift mutations (FS) were calculated using the mutation rate data from Figure 1A. Exo + BPS Error Rate = 27.6 × 10−7, SEM = 8.48 × 10−7, n = 12; Exo- BPS Error Rate = 178 × 10−7, SEM = 37.8 × 10⁻⁷, n = 8; p=0.0002. Exo + FS Error Rate = 18.4 × 10⁻⁷, SEM = 5.73 × 10⁻⁷, n = 8; Exo- FS Error Rate = 22.2 × 10⁻⁷, SEM = 12.1 × 10⁻⁷, n = 1; p=0.7759. Error rate data shown for Exo- is from Clone 1 (See Figure 1A). The HPRT1 ORF was sequenced from independently derived isolates of 6-TG resistant clones (these included 20 mismatch repair-deficient Pol εwt/wt and 25 mismatch repair-deficient Pol εwt/exo- clones; see Materials and methods). Sequence changes used to calculate error rates are in Figure 1—source data 2. ***p<0.001; n.s., p>0.05. (C) Errors rates were calculated using a lacZ reversion substrate that reverts via TCT→TAT transversion. P values were calculated using chi-square tests with Yates correction. Error rates are the averages of two experiments, each conducted with independent DNA and enzyme preparations for each construct tested. ≤indicates the value is a maximal estimate as it is identical to the assay background.

Figure 1—source data 1. Pol ε rAAV targeting efficiencies in human HCT-116 cells.
HCT-116 cells (37.4 × 10⁶) were transduced with Pol ε rAAV and grown in the presence of 10 μg/ml G418 to select for Neor clones. Targeted clones were identified by PCR analysis.
DOI: 10.7554/eLife.32692.006
Figure 1—source data 2. HPRT1 mutations sequenced from 6-thioguanine resistant Pol ε wt/exo- and Pol ε wt/wt HCT116 cells.
For each cell line, HPRT1 cDNA was made by RT-PCR, amplified and sequenced from independent 6-thioguanine resistant clones. Verified errors are indicated by type on the coding strand and position relative to the +1 start site. Insertion (ins) or deletion (Δ) of the indicated base(s) is denoted.
elife-32692-fig1-data2.pptx (423.2KB, pptx)
DOI: 10.7554/eLife.32692.007

Figure 1.

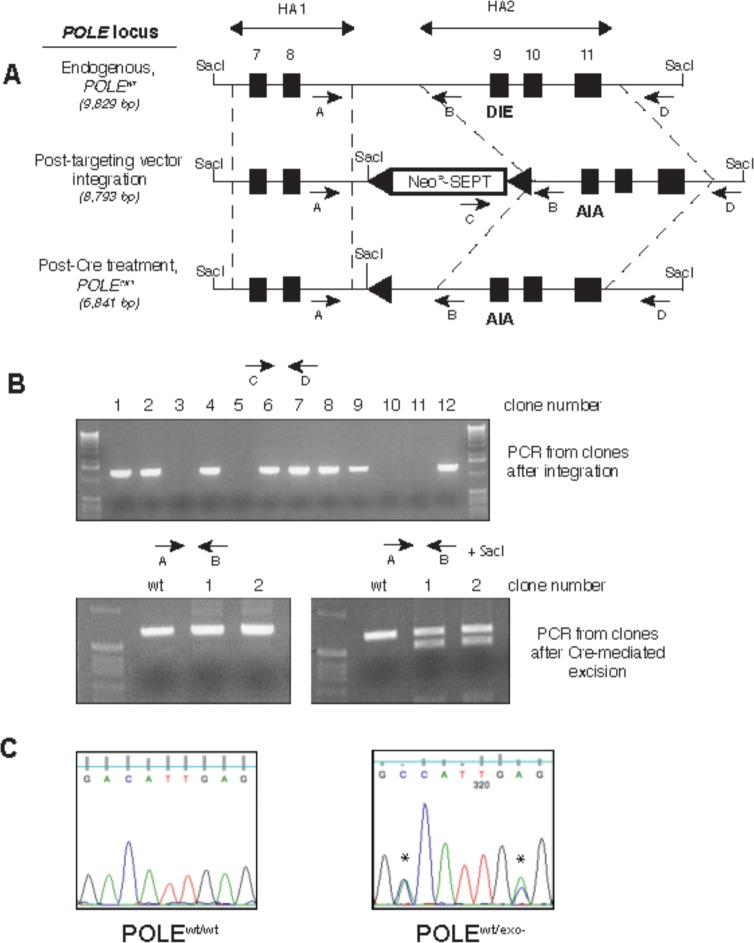
Figure 1—figure supplement 1. Generation of exonuclease-deficient Pol ε human cell lines by gene targeting.

Figure 1—figure supplement 1.

(A) Gene targeting scheme to change the sequence coding for the exonuclease active site amino acid residues (DIE) at the endogenous human Pol ε locus (POLE) to DNA coding for exonuclease-inactive residues (AIA). Two regions (HA1 and HA2) of the POLE locus (dotted lines) containing exons 7 and 8 and exons 9–11 (black boxes), respectively, were amplified from HCT-116 cells and used as homology arms in rAAV construction. The rAAV created for gene targeting used a promoterless neomycin-resistance marker containing a splice acceptor site and introduced a novel SacI cleavage site into the POLE locus (Rago et al., 2007). LoxP sites (triangles) flanked the cassette, allowing for Cre-mediated cassette excision. Arrows denote PCR primers. Predicted sizes of SacI-digested fragments hybridizing to HA2-derived Southern blot probe are shown in italics. (B) The indicated primer pairs (shown on the scheme in A) were used to amplify the indicated region of genomic DNA from geneticinr (cassette integration after viral transduction, upper) and geneticins (after Cre-mediated excision, lower) clones to verify construct integration at the genomic POLE locus and subsequent excision. (C) Genomic DNA from parental HCT116 cells (POLEwt/wt) and cells where one copy of proofreading exonuclease was inactivated (POLEwt/exo-) was prepared and a region containing exon 9 was amplified by PCR and sequenced to verify gene targeting. Asterisks denote bases changed by site-directed mutagenesis.
Figure 1—figure supplement 2. Southern blot of parental (HCT116) and knock-in clone (HCT116-Polεwt/exo-) after Cre-mediated excision.
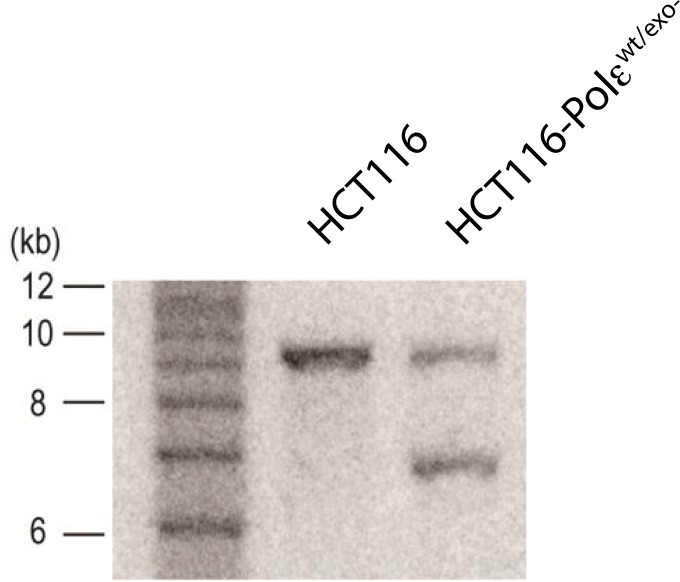
Figure 1—figure supplement 2.

Genomic DNA was digested with SacI and resolved on a 1% agarose gel in TBE. The DNA was transferred to Hybond N + membrane (Amersham) and blotted with probe against HA2 (shown in Figure 1—figure supplement 1). The sizes of the 1 kb ladder are shown to the left of the blot.