Abstract
Background and Aims
MRI-based hemodynamics have been applied to study the relationship between time-averaged wall shear stresses (TAWSS), oscillatory shear index (OSI) and atherosclerotic lesions in the coronary arteries, carotid artery, and human aorta. However, the role of TAWSS and OSI are poorly understood in lower extremity arteries. The aim of this work was to investigate the feasibility of hemodynamic assessment of the superficial femoral artery (SFA) in patients with peripheral artery disease (PAD) and we hypothesized that there is an association between TAWSS and OSI, respectively, and atherosclerotic burden expressed as the normalized wall index (NWI).
Methods
Six cases of 3D vascular geometries of the SFA and related inlet/outlet flow conditions were extracted from patient-specific MRI data including baseline, 12 and 24 months. Blood flow simulations were performed to compute flow descriptors, including TAWSS and OSI, and NWI.
Results
NWI was correlated positively with TAWSS (correlation coefficient: r = 0.592; p < 0.05). NWI was correlated negatively with OSI (correlation coefficient: r = −0.310, p < 0.01). Spatially averaged TAWSS and average NWI increased significantly between baseline and 24-months, whereas OSI decreased over 2-years.
Conclusions
In this pilot study with a limited sample size, TAWSS was positively associated with NWI, a measure of plaque burden, whereas OSI showed an inverse relationship. However, our findings need to be verified in a larger prospective study. MRI-based study of hemodynamics is feasible in the superficial femoral artery.
INTRODUCTION
Peripheral artery disease (PAD) is a vascular disease characterized by the formation of atherosclerotic lesions in lower extremity arteries [1–8]. PAD is linked with a higher risk of coronary artery disease, myocardial infarction, and cardiovascular death [1, 6, 7, 9]. Approximately 27 million people suffer from PAD in Europe and North America [2, 10]. Functional impairment in the lower extremities is a consequence of PAD [6, 9]. Intermittent claudication is associated with a 10-year mortality rate of 50% [11]. The optimal medical treatment of PAD consists of standard of care including medical management and surgical treatment [1, 10–13]. The formation of atherosclerotic lesions in the arterial system has been attributed to localized alterations in the blood flow either due to branching or due to pre-existing stenosis [7, 10, 11]. Using an in-vitro fluidic system representing the human carotid bifurcation, Ku and colleagues proposed in 1985 that lesions tend to form in areas of low shear stresses and large oscillations in the direction of wall shear may enhance atherogenesis [14]. These initial observations have been confirmed by various groups [15–19] emphasizing the importance of an accurate determination of the blood flow field, time-averaged wall shear stresses (TAWSS) and oscillatory shear index (OSI). TAWSS gives the wall shear stress magnitude averaged over the cardiac cycle at a specific location of interest and OSI describes the departure of the shear stresses from TAWSS and, therefore, provides an indication of local flow disturbance.
MRI-based hemodynamics have been applied to study the relationship between flow descriptors (TAWSS & OSI) and atherosclerotic lesions in carotid artery [20–24] and human aorta [25–28]. However, the role of TAWSS and OSI are poorly understood in lower extremity arteries. The aim of this work was to investigate the feasibility of hemodynamics assessment in the superficial femoral artery of patients with PAD. We hypothesized that there is positive and an inverse relationship between TAWSS and OSI, respectively, and atherosclerotic burden expressed as the normalized wall index (NWI). Assessing hemodynamic flow descriptors may provide additional insight into peripheral artery disease.
In this study, data from MRI scans of the distal SFA were analyzed at different time points [13]. The six cases of patient-specific geometries of the SFA were reconstructed from MR images [29–31]. The inflow velocities were extracted from 2D phase contrast (2D-PC) MRI scans that were used for a boundary and initial conditions for the fluid dynamics and transport problems [29–31]. By solving the resulting Navier-Stokes governing equations, the spatiotemporal distribution of the wall shear stresses and OSI within patient-specific SFAs are derived. Furthermore, the NWI is calculated from the MR images of the artery and correlated with the fluid dynamics descriptors (TAWSS, OSI).
Materials and methods
MRI data acquisition
MRI data were obtained from ELIMIT (Effect of Lipid Modification on Peripheral Artery Disease after Endovascular Intervention Trial) [11, 13]. ELIMIT was a randomized, double-blind and double placebo-controlled experiment with the goal to assess the efficacy of intensive lipid-modifying therapy (simvastatin, ezetimibe, and extended-release niacin) compared to standard therapy (simvastatin). The findings of the ELIMIT study have been reported elsewhere [13]. Patients underwent distal SFA MR imaging at baseline (0-months), 12-months, and 24-months with a 3.0T system (Signa Excite, GE Healthcare, Milwaukee, Wisconsin) using an unilateral phased array coil with a field of view (FOV) of 8 cm (along z-axis) and 12 cm (in-plane x and y-axes; Pathway Biomedical, Inc.). The geometries were extracted from proton-density-weighted (PDW) fast spin-echo scans, as reported previously [13]. ELIMIT participants were also imaged using gated (2D-PC MRI sequences, acquired at selected locations within the corresponding PDW volumes typically proximally and distally to SFA lesions. Gated 2D-PC were acquired during the same exam with slice-thickness = 4 mm, repetition time (TR) = 10.6 ms, echo time (TE) = 4.97 ms, echo train length (ETL) = 1, bandwidth = 244 Hz/pixel, 20 frames per cardiac cycle, and phase-contrast encoding velocity (VENC) of 120 cm/s. Serial MRI scans were carefully co-registered across follow-up visits using anatomical landmarks (artery, vein, and muscle) [21].
Image segmentation
For this feasibility study, six cases of patient-specific geometries of the SFA were selected from ELIMIT [13]. DICOM image segmentation was performed manually by AMIRA, which is a software for segmenting DICOM images [32]. The freehand lasso tool was used to manually segment lumen area and the outer vessel wall (Fig. 1- I MRI).
Figure 1.
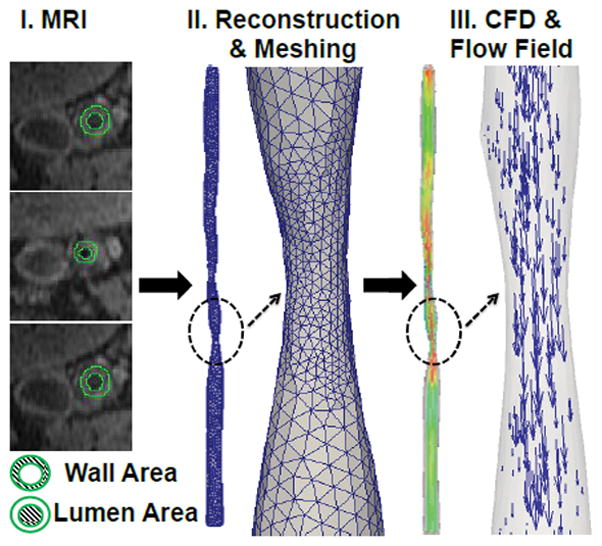
I) MR image at the arbitrary location of the superficial femoral artery (SFA) II) Vascular geometry reconstruction and meshing; III) simulated blood flow and corresponding flow field.
Velocity profile from 2D-PC images
Inlet velocity profile of each case was obtained from 2D-PC MRI data via the image processing package in the Matlab [33]. Velocity profiles over the cardiac cycle were obtained within the luminal cross-sectional areas (region of interest), the signal intensity of the region of interest, and the velocity encoding (VENC) factor [29].
Geometry reconstruction
The six cases of 3D vascular geometries were reconstructed using AMIRA [32]. First, segmented images were applied to generate a 3D surface model. Next, the surface smoothing module was applied to achieve continuous geometry. The resulting smooth geometries were meshed in ANSYS GAMBIT which is a meshing tool in the ANSYS software [34]. An optimized volume-based Quick-Delaunay method was used to generate tetrahedral meshes. The volumes were meshed with a mixture of the prism and tetrahedral elements.
Blood flow simulations
A continuum-based approach was adopted to simulate blood flow within a 3D patient-specific SFA (Fig. 1). Blood flow was modeled using the time-dependent Navier-Stokes equations expressed as [35]
where p, u⃗, ρ and u⃗ represent pressure, velocity, blood density, and dynamic viscosity, respectively. In this work, a patient’s own velocity profile was treated as inlet velocity profile. The inflow velocity vectors were oriented normal to the inlet plane. A no-slip boundary condition was prescribed at the rigid wall, and a pressure-outlet outflow boundary condition was implemented at the outlet with normal to boundary backflow specification. Blood is simulated using ANSYS FLUENT, which is a computational fluid dynamics tool in the ANSYS software. Blood is treated as a Newtonian fluid with a dynamic viscosity of 0.0035 Pa s and a density of 1060 Kg/m3[36, 37]. Flow remains laminar during the cardiac cycle where the minimum and maximum Reynolds numbers were calculated to be 25 and 1901 (Re < 2000) respectively for all the patient-specific geometries analyzed in this study [38]. Simulations were performed using Fluent’s pressure based-solver, with the SIMPLE pressure-velocity coupling scheme (Semi-Implicit Method for Pressure-Linked Equations) [34]. A second-order upwind scheme is used for the spatial discretization of the advective term in the momentum equation. Simulations convergence criteria were set at 1×10⁻⁵ for continuity and velocity residuals. A time step of 0.001s, with 10000-time steps per cardiac cycle, was selected for stability and accuracy of the simulation according to the Courant-Friedrichs-Lewy (CFL) criterion. Finally, two cardiac cycles were simulated for each patient to eliminate transient model effects, but only the final cardiac cycle data was used for analysis. Each simulation took approximately 2–2.5 hours on a 64-bit Windows 7 machine with one Intel Xeon W3680 6-core processors. Pressure outlet boundary condition in Fluent fixes static pressure at outlets. For all 6-cases, static pressure is set to 0 Pa. The use of a pressure outlet boundary condition instead of an outflow condition often results in a better rate of convergence when backflow occurs during iteration. Here, results are specific to its pressure-outlet boundary condition at different time points (0, 12 and 24-months). For validation, we compared u, v, w velocity components in the distal part of the artery by creating an identical geometry with a mesh size of 0.15 and 0.1 mm corresponding to a cell count of about 93873, 94310 (number of vertices of about 31296, 34908) respectively, and it was found that the velocity components were identical within 5% for both meshes. Thus, artery grid resolution was set to a mesh size of 0.15 mm for all the geometries. Further, the average of mean square error (MSE) in the magnitude of wall shear stress vector between cardiac cycle two and three were 0.01205. The average MSE in the magnitude of velocity vector between cardiac cycle two and three were 1.3E–5. Thus, two cardiac cycles are sufficient for eliminating transient model effects. In addition, we compared wall shear stresses averaged over a 2 mm volume between a mesh size of 0.10 and 0.15 mm. Mean wall shear stress was 1.18 and 1.27 Pa for a mesh size of 0.10 and 0.15 mm respectively, with a standard deviation of 1.67 and 1.77 Pa, respectively. It was found that the mean WSS were identical within 8% for both meshes. Similarly, we also found that the average mean square error in the wall shear stresses between a mesh size of 0.10 and 0.15 mm were 0.016 with a standard deviation of 0.043.
In order to analyze the flow field characteristics and its near wall behavior, two wall shear based quantities were calculated over a cardiac cycle with a time period T: 1) the time-averaged wall shear stress (TAWSS),
where is the magnitude of the instantaneous wall shear stress vector ; and τi, τj, τk are the components of wall shear stress vector and 2) the oscillatory shear index (OSI) [39, 40],
The oscillatory shear index (OSI) characterizes the changes in flow direction and the velocity gradient during the cardiac cycle. The OSI is normalized so that it varies from 0 (unidirectional flow) to 0.5 (oscillatory flow).
Normalized wall index (NWI)
Normalized wall index [41–45] is defined as NWI = wall area / (wall area + lumen area) (Fig. 1). NWI represents the percentage of the wall area in total vessel area. NWI varies between zero and one with following three conditions:
Where W is the wall area, L is the lumen area. NWI index increases either if lumen decreases in size or wall thickness increases in size, on the other hand, NWI index decreases if either lumen increases in size or wall thickness decrease in size.
Statistical Analysis
For Table 1, and supplementary Table 1 and 2, the Pearson-correlation coefficient between NWI, TAWSS, and OSI were calculated. The Pearson-correlation coefficient and its two-tailed probability test (p-value) were used to assess the test of correlation using GraphPad Prism 6 software. * indicates significance at p< 0.05; ** indicates significance at p < 0.01; *** indicates significance from baseline (p < 0.001). NS= Not significant. For Fig. 7, non-parametric Kruskal-Wallis test and Dunn’s multiple comparison tests were performed to assess significance using GraphPad Prism 6 software.
Table 1.
Shows the Pearson correlation coefficient table for co-registered MRI slices taken from six cases (162 MRI slices).
| MRI slices are taken from six cases | ||||
|---|---|---|---|---|
| N: number of slices | Pearson-Correlation Coefficients | |||
| All MRI slices | N | TAWSS | OSI | NWI |
| TAWSS | 162 | 1 | ||
| OSI | 162 | −0.413** | 1 | |
| NWI | 162 | 0.592** | −0.310** | 1 |
| MRI slices are taken at baseline only (two-cases) | ||||
| All MRI slices | N | TAWSS | OSI | NWI |
| TAWSS | 54 | 1 | ||
| OSI | 54 | −0.577** | 1 | |
| NWI | 54 | 0.574** | −0.734** | 1 |
Note, for all the tables: TAWSS represents spatially averaged TAWSS (<TAWSS>), OSI represents spatially averaged OSI (<OSI>), NWI represents averaged NWI (<NWI>), N= number of MRI slices; Pearson-correlation coefficient and its two-tailed probability test were used to assess the test of correlation.
indicates significance at P-value < 0.05;
indicates significance at P-value < 0.01;
indicates significance at P-value < 0.001. NS= Not significant.
Figure 7.
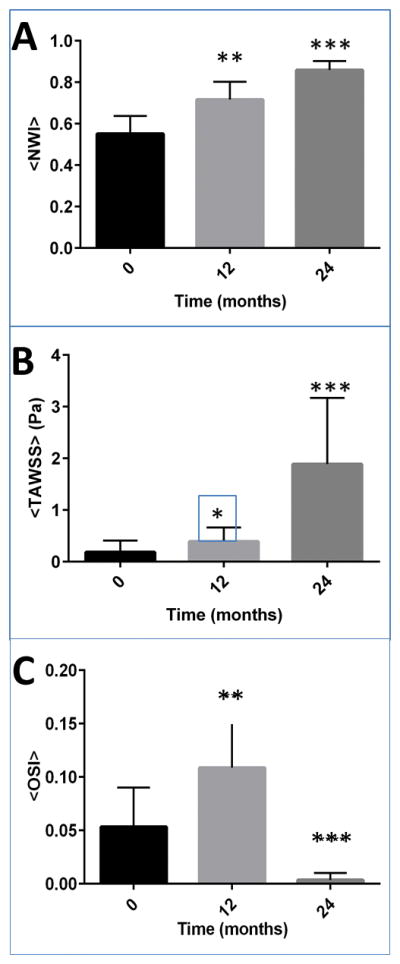
Shows the plot of (A) the plot of average normalized wall index (NWI), (B) the spatial average of TAWSS [Pa]; (C) the spatial average of OSI for all six cases specifically at the region of interest R1, R2, and R3. Shown error bars are standard error, and ** indicates significance from baseline (P-value < 0.01) and *** indicates significance from baseline (P-value < 0.001). For this plot, a sample size of MRI slices was 90. Non-parametric Kruskal-Wallis test and Dunn’s multiple comparison tests were performed to assess significance.
Patient-specific modeling
We have analyzed six cases (two patients: both male) where each patient represents three cases at baseline (0-months), 12-months, and 24-months. Patient-1 had a history of smoking, an ankle-brachial index (ABI) of 0.93, blood pressure of 138/70, heart rate of 67 and no diabetes, whereas patient-2 had a history of smoking, an ankle-brachial index of 0.47, blood pressure of 126/68, heart rate of 69 and no diabetes. The six cases of patient-specific geometries of the SFA are taken from ELIMIT [13]. MR images were segmented using AMIRA [32]. The 3D vascular geometries were reconstructed, as follows: first, segmented lumen cross-sectional images were processed to generate 3D polygonal surface models (Fig. 1 - I. MRI and II. Reconstruction & Meshing). Second, a surface smoothing module was applied to achieve a continuous geometry. The resulting smooth geometries were meshed in ANSYS GAMBIT [34] with a mesh size of 0.15 mm. An optimized volume-based Quick-Delaunay method was used to generate tetrahedral meshes. Finally, tetrahedral solid meshes were imported into Ansys Fluent [34] for the blood flow simulations in the SFA (Fig. 1 - III. CFD & Flow Field). Each case of geometries was reconstructed from 40 MR image slices. Anatomical markers were used to keep track of the co-registered MRI slices in the artery at 0, 12 and 24-month visits. Velocity profiles over the cardiac cycle were obtained proximally to the SFA, following the analysis of luminal cross-sectional areas (Supplementary Figure SF.1). Three regions of interest (ROIs) were identified within the SFA, denoted as R1, R2, and R3, with each region made of 4 to 6 MRI slices (supplementary figure SF.2).
Results
Analysis of flow descriptors and disease progression for ‘six cases’
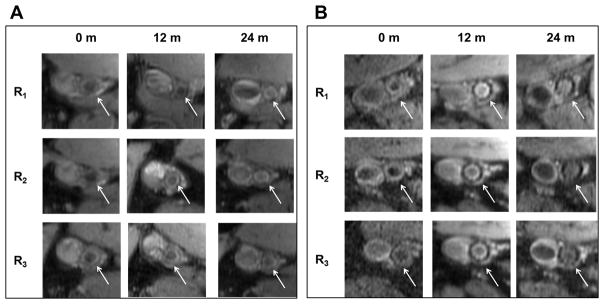
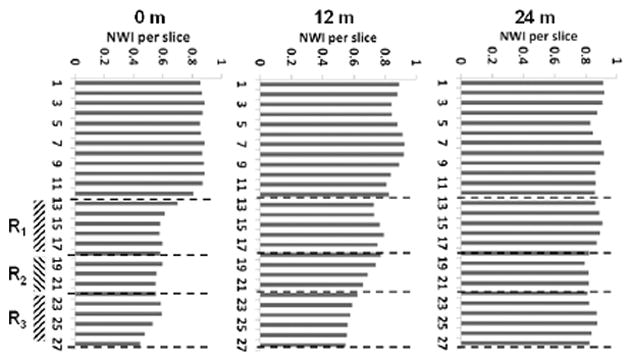
Fig. 2 presents the reconstructed geometry of SFA for case 1, 2 and 3 (Patient 1), with co-registered MRI slices at 0 (baseline), 12 and 24 months. This patient was treated with standard lipid lowering therapy (simvastatin) and did not undergo any surgical intervention [13]. Contour plots of TAWSS (in Pa) and OSI over a full cardiac cycle are presented at 0, 12 and 24 months. Letters A and P denote anterior and posterior view. Three characteristic ROIs could be identified, namely R1, R2 and R3, as characterized by relatively low TAWSS and high OSI at baseline. Although at 24 months, the entire SFA lumen is reduced, the most significant decrease was recorded at R1, R2, and R3, as documented in Fig. 2. This is also confirmed in Fig. 4A, where MR images related to the three ROIs, are shown over time. The white arrow locates the SFA. It can be seen as a reduction in lumen size from 0 to 24 months for all three ROIs. Note that the largest variations in NWI over time are associated with the selected ROIs (Fig. 5).
Figure 2.
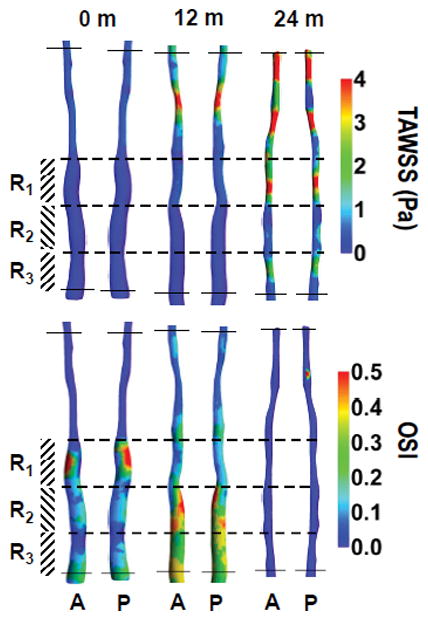
(case-1, 2 and 3) show the plot of time-averaged wall shear stress (TAWSS in Pa) and oscillatory shear index (OSI, dimensionless) over a full cardiac cycle, respectively in a superficial femoral artery (SFA). Letters A and P represent the anterior and posterior view of the artery with co-registered regions at baseline (case-1: pre-intervention) and post-intervention 12 & 24-months (case-2 and 3 respectively). Color bars in the right panel represent a range of TAWSS and OSI values, respectively.
Figure 4.
(A: case-1, 2 and 3) Attached MR images represent one of the locations of the region of interest R1, R2, R3 at baseline (pre-intervention) and post-intervention 12 & 24-months. The White arrow indicates the location of the superficial femoral artery. Similarly, (B: case-4, 5 and 6) attached MR images represent one of the slices of a region of interest R1, R2, R3 at 0, 12 & 24-months.
Figure 5.
(case-1, 2 and 3) shows the plot of normalized wall index (NWI) for co-registered MRI slices in the artery at 0, 12 and 24-months. R1, R2, and R3 are a region of interest.
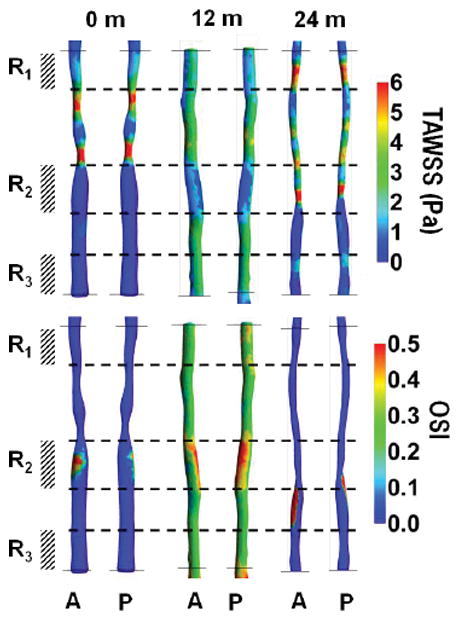
Similarly, Fig. 3 presents the reconstructed geometry of SFA for case 4, 5 and 6 (Patient 2) with co-registered MRI slices of SFA at 0, 12 and 24 months. This patient was randomized to standard lipid lowering therapy (simvastatin) and underwent standard of care revascularization by the deployment of a stent at baseline [13]. This intervention led to a significant increase in circular area as depicted by comparing the SFA at baseline and 12 months (Fig. 3). Contour plots of TAWSS (in Pa) and OSI over a full cardiac cycle are presented at 0, 12 and 24 months. Letters A and P denote anterior and posterior view. At baseline (Fig. 3 TAWSS, top panel), two ROIs can be identified, namely R1 and R3, characterized by relatively low TAWSS and high OSI; and R2, which is characterized by the lowest TAWSS and highest OSI. Although at 24 months, the SFA lumen was reduced, the most significant decrease was recorded with R1, R2, and R3, as documented in Fig. 3. These regions were associated with a significant increase in TAWSS, particularly for R1 and R2. This is also confirmed in Fig. 4B, where MR images related to the three ROIs, are shown over time. The white arrow locates the SFA. It can be seen as a reduction in lumen size from 12 to 24 months for all three ROIs. Note that the largest variations in NWI over time are associated with the selected ROIs (Fig. 6).
Figure 3.
(case-4, 5 and 6) show the plot of time-averaged wall shear stress (TAWSS in Pa) and oscillatory shear index (OSI, dimensionless) over a full cardiac cycle, respectively in a superficial femoral artery (SFA). Letters A and P represent the anterior and posterior view of the artery with co-registered regions at baseline (case-4: pre-intervention) and post-intervention 12 & 24-months (case-5 and 6 respectively). Color bars in the right panel represent a range of TAWSS and OSI values, respectively.
Figure 6.
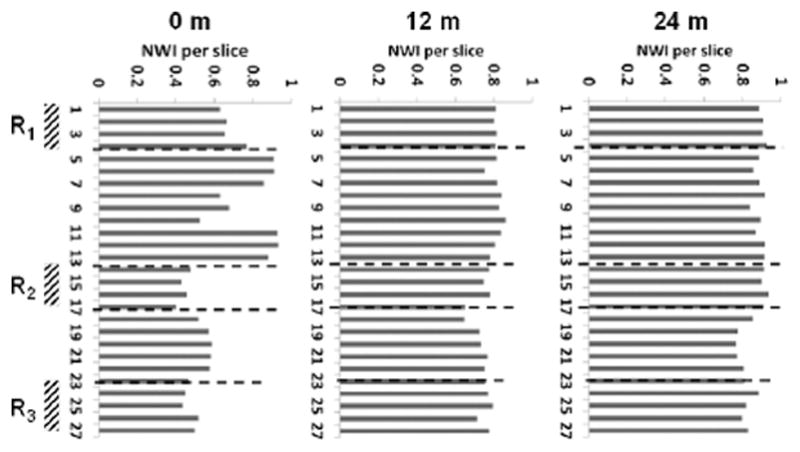
(case-4, 5 and 6) shows the plot of normalized wall index (NWI) for co-registered MRI slices in the artery at baseline, 12-months, and 24-months. R1, R2, and R3 denote a region of interests.
Fig. 7 shows the plot of (A) the plot of NWI, (B) the spatial average of TAWSS (Pa); (C) the spatial average of OSI for all six cases specifically at the region of interest R1, R2, and R3. Shown error bars are standard error, and ** indicates significance from baseline (P-value < 0.01) and *** indicates significance from baseline (P-value < 0.001). For this figure, 90 MRI slices were used. Non-parametric Kruskal-Wallis test and Dunn’s multiple comparison tests were performed to assess significance. We observed that the increase in average NWI at 24-months was significant from baseline, confirming the lumen decrease, and lesion wall increase from baseline. Similarly, the increase in TAWSS at 24-months was significant from baseline whereas a significant decrease in OSI at 24-months was observed.
Correlation between TAWSS, OSI and NWI
Next, the relationship between spatially averaged TAWSS, OSI, and the NWI were analyzed. Table 1. shows the Pearson correlation coefficient table for co-registered MRI slices taken from six-cases and baseline-cases. The six cases included 162 MRI slices. Pearson-correlation coefficient and its two-tailed probability test were used to assess the test of correlation. We observed that the NWI correlates positively with TAWSS (r=0.592, p < 0.01) and negatively with OSI (r=−0.31, p < 0.01). In Table 1, we also analyzed 54 baseline MRI slices. We found that the NWI correlates positively with TAWSS (r=0.574, p < 0.01) and negatively with OSI (r=−0.734, p < 0.01). We also observed similar correlations when each MRI scan (27 slices each) was analyzed separately (in supplementary Tables. 1 and 2). Supplementary Table. 1 represents case-1, 2, 3 at 0, 12 and 24-months. Supplementary Table. 2 represents case-4, 5, 6 at 0, 12 and 24-months. In summary, key findings of all the six cases are reported in Table. 2.
Table 2.
Key results for all six cases.
| Key results from 6-cases |
|---|
| 1) Increase in NWI at 24-months is significant from baseline. |
| 2) Thus, reductions in lumen size or lesion wall increase from baseline. |
| 3) Increase in TAWSS at 24-months is significant from baseline. |
| 4) Decrease in OSI at 24-months is significant from baseline. |
| 5) NWI correlates positively with TAWSS and negatively with OSI. |
| 6) TAWSS correlates negatively with OSI. |
DISCUSSION
In this work, we have simulated blood flow in six-cases of the superficial femoral artery of patients with peripheral artery disease and investigated the relationship between TAWSS, OSI, and NWI. The purpose of defining the normalized wall index NWI was to (i) compute the plaque burden (the percentage of wall area in total vessel area); (ii) compare the NWI over a period of 24-months for regions of interest (R1, R2, R3) with respect to TAWSS and OSI; and (iii) compute the correlation coefficients of NWI with respect to TAWSS and OSI.
This pilot study indicates that TAWSS is positively associated with the NWI, a measure of plaque burden, whereas OSI shows an inverse relationship. During a period of 24 months, a significant increase was observed in the average NWI and spatially averaged TAWSS. Conversely, OSI decreased during the same 2 year period. The Pearson correlation coefficients in Table. 1 indicates that the NWI is positively correlated with TAWSS (r=0.592, p < 0.01) but negatively correlated with OSI (r=−0.31, p < 0.01). It has been reported previously [46, 47] that atherosclerotic lesions seem to develop at regions with low wall shear stresses and flow recirculation (OSI), as observed in this study.
Previous studies suggest that the wall shear stress and OSI are associated with atherosclerotic lesions. In a recent report, Arzani et al. [48] modeled abdominal aortic aneurysms. Patient-specific modeling of blood flow in 10 patients with small abdominal aortic aneurysm was compared with intraluminal thrombus growth from a 2- to 3-yr follow-up. Their results indicated that regions of low OSI demonstrated a negative correlation with thrombus deposition, whereas TAWSS demonstrated a positive correlation with thrombus deposition. Although we did not compare thrombus deposition, our results indicated that TAWSS was positively correlated with the NWI, a measure of plaque burden, whereas OSI was negatively correlated with NWI. The paper of Buchanan et al. [49] was based on rabbit’s abdominal aorta as a suitable atherosclerotic model. They analyzed visually on a single aorta and concluded that monocyte deposition patterns are correlated with average wall shear gradient, which describes wall shear stress distribution; and Buchanan et al. [49] did not report OSI or NWI. On the other hand, we have performed quantitative analysis on six cases, which indicated that the TAWSS was positively correlated with the NWI, whereas OSI was negatively correlated with the NWI. However, it is important to note that the wall properties of the abdominal aorta (elastic artery) and SFA (muscular artery) differ from each other. The paper of Assessment et al. [50] analyzed two cases of the aortic arch of an apolipoprotein E knockout (ApoE−/−) mouse in the geometry with plaques and without plaques. Based on visual analysis of TAWSS, OSI, and plaque, they concluded that the presence of plaques was found to increase wall shear stresses significantly. It was also shown that the plaque development alters the blood flow and can induce recirculation zones (OSI). On the other hand, we performed quantitative analysis on six cases, which indicated that the TAWSS was positively correlated with the NWI, whereas OSI was negatively correlated with the NWI. Frydrychowicz et al.[51] analyzed thoracic human aorta of the 31 healthy volunteers using flow-sensitive 4D MRI and reported that the distribution of low WSS and high OSI closely resembled typical locations of atherosclerotic lesions at the inner aortic curvature and supra-aortic branches. Similarly, we performed quantitative analysis on six cases, which indicated that the TAWSS was positively correlated with the NWI, whereas OSI was negatively correlated with the NWI.
The following two papers found no association between TAWSS or OSI with atherosclerotic lesions. Steinman et al. [52] visually analyzed a single case of coronary artery and could not find a quantitative general relationship between TAWSS or OSI and wall thickness. Harloff et al. [28] performed quantitative analysis of the 62 cases of human aorta and reported that the plane-wise analysis revealed a good correlation of individual low WSS magnitude but not of high OSI with plaque distribution. Therefore, a larger number of patient-specific cases are needed to confirm the relationship between NWI, TAWSS, and OSI.
Limitations
This study has the following limitations. The results of this feasibility analysis need to be confirmed in a prospective study with a sufficiently large sample size. In our simulation, we did not model the presence of stents, which can affect the local blood flow as previously observed by Chiastra et al. [53]. We have assumed a rigid wall approximation for simulating blood flow in a given artery. The paper of Taylor and Chiastra [54, 55] suggests that the rigid wall approximation is a reasonable approximation in estimating the wall shear stresses. In this work, blood was modeled as a Newtonian fluid. Johnston et al.[56] suggest that the use of a Newtonian blood model is a reasonable approximation. However, to study the flow within the artery in detail, a non-Newtonian model may be more suitable [56, 57].
CONCLUSIONS
In this pilot study with a limited sample size, TAWSS was positively associated with NWI, a measure of plaque burden, whereas OSI showed an inverse relationship. However, our findings need to be verified in a larger prospective study. MRI-based study of hemodynamics is feasible in the superficial femoral artery.
Supplementary Material
Supplementary Table. 1. Pearson correlation coefficients for co-registered MRI slices taken at each visit (case-1, 2 and 3). A number of MRI slices was 27.
Supplementary Table. 2 Pearson correlation coefficients for co-registered MRI slices taken at each visit (case-4, 5 and 6). A number of MRI slices was 27.
SF.1 Velocity profile for patient-1(case-1, 2, 3) and patient-2 (case-3, 4, 5) at 0, 12 and 24-months.
SF.2 Plot of a local region of interest (ROI) where the ROI consists of 4 MRI slices.
Acknowledgments
Funding: ELIMIT was supported by NIH grants R01HL075824, and R01 HL085769. GB was supported in part by an American Heart Association (AHA) award (13BGIA16720014) and an NIH K25 award (K25HL121149). JDM was supported in part by NIH grant (HL63090). Authors acknowledge support from the “George and Angelina Kostas Research Center for Cardiovascular Nanomedicine” at the Houston Methodist Research Institute, Houston (TX – USA).
Footnotes
Conflict of interest: None (JS), None (GB), None (JM), None (CB), None (AL), None (DS), None (PD).
Ethical Approval and Informed Consent: The ELIMIT study was approved by the Institutional Review Board and all subjects provided informed consent.
References
- 1.Walker CM, et al. Multidisciplinary approach to the diagnosis and management of patients with the peripheral arterial disease. Clinical Interventions in Aging. 2015;10:1147–1153. doi: 10.2147/CIA.S79355. [DOI] [PMC free article] [PubMed] [Google Scholar]
- 2.Heinen Y, et al. Local Association Between Endothelial Dysfunction and Intimal Hyperplasia: Relevance in Peripheral Artery Disease. Journal of the American Heart Association. 2015;4(2) doi: 10.1161/JAHA.114.001472. [DOI] [PMC free article] [PubMed] [Google Scholar]
- 3.de Beer D, et al. Longitudinal Telomere Erosion in Lymphocyte Subsets of Patients with Atherosclerotic Peripheral Arterial Disease (PAD) Journal of Clinical and Diagnostic Research : JCDR. 2015;9(3):OM01–OM03. doi: 10.7860/JCDR/2015/10931.5684. [DOI] [PMC free article] [PubMed] [Google Scholar]
- 4.Bentzon JF, et al. Mechanisms of Plaque Formation and Rupture. Circulation Research. 2014;114(12):1852–1866. doi: 10.1161/CIRCRESAHA.114.302721. [DOI] [PubMed] [Google Scholar]
- 5.Lim GB. Vascular disease: Peripheral artery disease pandemic. Nat Rev Cardiol. 2013;10(10):552–553. doi: 10.1038/nrcardio.2013.128. [DOI] [PubMed] [Google Scholar]
- 6.Gardner AW, Afaq A. Management of lower extremity peripheral arterial disease. Journal of cardiopulmonary rehabilitation and prevention. 2008;28(6):349–357. doi: 10.1097/HCR.0b013e31818c3b96. [DOI] [PMC free article] [PubMed] [Google Scholar]
- 7.Hossain SS, et al. Magnetic resonance imaging-based computational modeling of blood flow and nanomedicine deposition in patients with the peripheral arterial disease. Journal of The Royal Society Interface. 2015;12(106) doi: 10.1098/rsif.2015.0001. [DOI] [PMC free article] [PubMed] [Google Scholar]
- 8.Fowkes FGR, et al. Comparison of global estimates of prevalence and risk factors for peripheral artery disease in 2000 and 2010: a systematic review and analysis. The Lancet. 382(9901):1329–1340. doi: 10.1016/S0140-6736(13)61249-0. [DOI] [PubMed] [Google Scholar]
- 9.Newman AB, et al. Lower extremity arterial disease in elderly subjects with systolic hypertension. Journal of Clinical Epidemiology. 1991;44(1):15–20. doi: 10.1016/0895-4356(91)90196-g. [DOI] [PubMed] [Google Scholar]
- 10.DeRubertis BG, et al. Shifting Paradigms in the Treatment of Lower Extremity Vascular Disease: A Report of 1000 Percutaneous Interventions. Annals of Surgery. 2007;246(3):415–424. doi: 10.1097/SLA.0b013e31814699a2. [DOI] [PMC free article] [PubMed] [Google Scholar]
- 11.Lumsden A, et al. Peripheral Arterial Occlusive Disease: Magnetic Resonance Imaging and the Role of Aggressive Medical Management. World Journal of Surgery. 2007;31(4):695–704. doi: 10.1007/s00268-006-0732-y. [DOI] [PubMed] [Google Scholar]
- 12.Poredoš P, et al. Medical management of patients with the peripheral arterial disease. International angiology: a journal of the International Union of Angiology. 2015;34(1):75–93. [PubMed] [Google Scholar]
- 13.Brunner G, et al. The Effect of Lipid Modification on Peripheral Artery Disease after Endovascular Intervention Trial (ELIMIT) Atherosclerosis. 2013;231(2):371–377. doi: 10.1016/j.atherosclerosis.2013.09.034. [DOI] [PMC free article] [PubMed] [Google Scholar]
- 14.Ku DN, et al. Pulsatile flow and atherosclerosis in the human carotid bifurcation. Positive correlation between plaque location and low oscillating shear stress. Arteriosclerosis, Thrombosis, and Vascular Biology. 1985;5(3):293–302. doi: 10.1161/01.atv.5.3.293. [DOI] [PubMed] [Google Scholar]
- 15.Friedman MH, et al. Correlation between wall shear and intimal thickness at a coronary artery branch. Atherosclerosis. 1987;68(1–2):27–33. doi: 10.1016/0021-9150(87)90090-6. [DOI] [PubMed] [Google Scholar]
- 16.Giddens DP, Zarins CK, Glagov S. The Role of Fluid Mechanics in the Localization and Detection of Atherosclerosis. Journal of Biomechanical Engineering. 1993;115(4B):588–594. doi: 10.1115/1.2895545. [DOI] [PubMed] [Google Scholar]
- 17.Caro CG. Discovery of the Role of Wall Shear in Atherosclerosis. Arteriosclerosis, Thrombosis, and Vascular Biology. 2009;29(2):158–161. doi: 10.1161/ATVBAHA.108.166736. [DOI] [PubMed] [Google Scholar]
- 18.Nerem RM. Vascular Fluid Mechanics, the Arterial Wall, and Atherosclerosis. Journal of Biomechanical Engineering. 1992;114(3):274–282. doi: 10.1115/1.2891384. [DOI] [PubMed] [Google Scholar]
- 19.Malek AM, Alper SL, Izumo S. Hemodynamic shear stress and its role in atherosclerosis. JAMA. 1999;282(21):2035–2042. doi: 10.1001/jama.282.21.2035. [DOI] [PubMed] [Google Scholar]
- 20.Markl M, et al. In Vivo Wall Shear Stress Distribution in the Carotid Artery: Effect of Bifurcation Geometry, Internal Carotid Artery Stenosis, and Recanalization Therapy. Circulation: Cardiovascular Imaging. 2010;3(6):647–655. doi: 10.1161/CIRCIMAGING.110.958504. [DOI] [PubMed] [Google Scholar]
- 21.Calamante F, Yim PJ, Central JR. Estimation of bolus dispersion effects in perfusion MRI using image-based computational fluid dynamics. NeuroImage. 2003;19(2):341–353. doi: 10.1016/s1053-8119(03)00090-9. [DOI] [PubMed] [Google Scholar]
- 22.Steinman DA, et al. Reconstruction of carotid bifurcation hemodynamics and wall thickness using computational fluid dynamics and MRI. Magnetic Resonance in Medicine. 2002;47(1):149–159. doi: 10.1002/mrm.10025. [DOI] [PubMed] [Google Scholar]
- 23.Perktold K, Hilbert D. Numerical simulation of pulsatile flow in a carotid bifurcation model. Journal of Biomedical Engineering. 1986;8(3):193–199. doi: 10.1016/0141-5425(86)90083-x. [DOI] [PubMed] [Google Scholar]
- 24.Chatzizisis YS, et al. Prediction of the localization of high-risk coronary atherosclerotic plaques on the basis of low endothelial shear stress - An intravascular ultrasound and histopathology natural history study. Circulation. 2008;117(8):993–1002. doi: 10.1161/CIRCULATIONAHA.107.695254. [DOI] [PubMed] [Google Scholar]
- 25.Lantz J, Renner J, Karlsson M. Wall shear stress in a subject-specific human aorta: Influence of fluid-structure interaction. International Journal of Applied Mechanics. 2011;03(04):759–778. [Google Scholar]
- 26.Karmonik C, et al. Integration of the computational fluid dynamics technique with MRI in aortic dissections. Magnetic Resonance in Medicine. 2013;69(5):1438–1442. doi: 10.1002/mrm.24376. [DOI] [PubMed] [Google Scholar]
- 27.Goubergrits L, et al. MRI-based computational fluid dynamics for diagnosis and treatment prediction: Clinical validation study in patients with coarctation of the aorta. Journal of Magnetic Resonance Imaging. 2014 doi: 10.1002/jmri.24639. n/an/a. [DOI] [PubMed] [Google Scholar]
- 28.Harloff A, et al. In vivo assessment of wall shear stress in the atherosclerotic aorta using flow-sensitive 4D MRI. Magnetic Resonance in Medicine. 2010;63(6):1529–1536. doi: 10.1002/mrm.22383. [DOI] [PubMed] [Google Scholar]
- 29.Markl M, et al. Time-resolved three-dimensional phase-contrast MRI. Journal of Magnetic Resonance Imaging. 2003;17(4):499–506. doi: 10.1002/jmri.10272. [DOI] [PubMed] [Google Scholar]
- 30.Shah DJ, et al. Magnetic Resonance Evaluation of Peripheral Arterial Disease. Magnetic Resonance Imaging Clinics of North America. 2007;15(4):653–679. doi: 10.1016/j.mric.2007.08.012. [DOI] [PubMed] [Google Scholar]
- 31.Yuan C, et al. MRI of Carotid Atherosclerosis. Journal of nuclear cardiology : official publication of the American Society of Nuclear Cardiology. 2008;15(2):266–275. doi: 10.1016/j.nuclcard.2008.02.001. [DOI] [PMC free article] [PubMed] [Google Scholar]
- 32.Amira. FEI VSG. www.vsg3d.com/amira.
- 33.The MathWorks, I. MATLAB, and Statistics Toolbox. Natick; Massachusetts, United States: 2012b. [Google Scholar]
- 34.Ansys. ANSYS FLUENT 15.0. Feb, 2015. [Google Scholar]
- 35.Yang N, et al. Comparative Study of Continuous and Pulsatile Left Ventricular Assist Devices on Hemodynamics of a Pediatric End-to-Side Anastomotic Graft. Cardiovascular engineering and technology. 2010;1(1) doi: 10.1007/s13239-010-0006-6. [DOI] [PMC free article] [PubMed] [Google Scholar]
- 36.Lee SW, Steinman DA. On the relative importance of rheology for image-based CFD models of the carotid bifurcation. Journal of Biomechanics. 39:S283. doi: 10.1115/1.2540836. [DOI] [PubMed] [Google Scholar]
- 37.Wang SH, Lee LP, Lee JS. A linear relation between the compressibility and density of blood. The Journal of the Acoustical Society of America. 2001;109(1):390–396. doi: 10.1121/1.1333419. [DOI] [PubMed] [Google Scholar]
- 38.Pletcher RH, Tannehill JC, Anderson D. Computational Fluid Mechanics, and Heat Transfer. 3. CRC Press; 2011. [Google Scholar]
- 39.He X, Ku DN. Pulsatile Flow in the Human Left Coronary Artery Bifurcation: Average Conditions. Journal of Biomechanical Engineering. 1996;118(1):74–82. doi: 10.1115/1.2795948. [DOI] [PubMed] [Google Scholar]
- 40.Lee SW, Antiga L, Steinman DA. Correlations Among Indicators of Disturbed Flow at the Normal Carotid Bifurcation. Journal of Biomechanical Engineering. 2009;131(6):061013–061013. doi: 10.1115/1.3127252. [DOI] [PubMed] [Google Scholar]
- 41.Saam T, et al. Predictors of carotid atherosclerotic plaque progression as measured by noninvasive magnetic resonance imaging. Atherosclerosis. 2007;194(2):e34–e42. doi: 10.1016/j.atherosclerosis.2006.08.016. [DOI] [PMC free article] [PubMed] [Google Scholar]
- 42.Mani V, et al. Cardiovascular magnetic resonance parameters of atherosclerotic plaque burden improve discrimination of prior major adverse cardiovascular events. Journal of Cardiovascular Magnetic Resonance. 2009;11(1):10–10. doi: 10.1186/1532-429X-11-10. [DOI] [PMC free article] [PubMed] [Google Scholar]
- 43.Hayashi K, et al. Variations in atherosclerosis and remodeling patterns in aorta and carotids. Journal of Cardiovascular Magnetic Resonance. 2010;12(1):10–10. doi: 10.1186/1532-429X-12-10. [DOI] [PMC free article] [PubMed] [Google Scholar]
- 44.Audi HE, et al. MRI plaque burden of the carotid arteries and aorta : Reproducibility, Age, Sex, and Systemic Distribution. Nature Clinical Practice Cardiovascular Medicine. 2009;6(3):219–228. doi: 10.1038/ncpcardio1444. [DOI] [PMC free article] [PubMed] [Google Scholar]
- 45.Fayad ZA, et al. Safety and efficacy of dalcetrapib on atherosclerotic disease using novel non-invasive multimodality imaging (dal-PLAQUE): a randomized clinical trial. The Lancet. 378(9802):1547–1559. doi: 10.1016/S0140-6736(11)61383-4. [DOI] [PMC free article] [PubMed] [Google Scholar]
- 46.Chatzizisis YS, et al. Prediction of the Localization of High-Risk Coronary Atherosclerotic Plaques on the Basis of Low Endothelial Shear Stress: An Intravascular Ultrasound and Histopathology Natural History Study. Circulation. 2008;117(8):993–1002. doi: 10.1161/CIRCULATIONAHA.107.695254. [DOI] [PubMed] [Google Scholar]
- 47.Chen SH, et al. Prediction of the initial thickness of shear band localization based on a reduced strain gradient theory. International Journal of Solids and Structures. 2011;48(21):3099–3111. [Google Scholar]
- 48.Arzani A, et al. A longitudinal comparison of hemodynamics and intraluminal thrombus deposition in abdominal aortic aneurysms. American Journal of Physiology - Heart and Circulatory Physiology. 2014;307(12):H1786–H1795. doi: 10.1152/ajpheart.00461.2014. [DOI] [PMC free article] [PubMed] [Google Scholar]
- 49.Buchanan JR, et al. Hemodynamics simulation and identification of susceptible sites of atherosclerotic lesion formation in a model abdominal aorta. Journal of Biomechanics. 2003;36(8):1185–1196. doi: 10.1016/s0021-9290(03)00088-5. [DOI] [PubMed] [Google Scholar]
- 50.Assemat P, et al. Haemodynamic stress in mouse aortic arch with atherosclerotic plaques: Preliminary study of plaque progression. Computational and Structural Biotechnology Journal. 2014;10(17):98–106. doi: 10.1016/j.csbj.2014.07.004. [DOI] [PMC free article] [PubMed] [Google Scholar]
- 51.Frydrychowicz A, et al. Three-dimensional analysis of segmental wall shear stress in the aorta by flow-sensitive four-dimensional-MRI. Journal of Magnetic Resonance Imaging. 2009;30(1):77–84. doi: 10.1002/jmri.21790. [DOI] [PubMed] [Google Scholar]
- 52.Steinman DA. Image-based Computational Fluid Dynamics: A New Paradigm for Monitoring Hemodynamics and Atherosclerosis. Current Drug Targets -Cardiovascular & Haematological Disorders. 2004;4(2):183–197. doi: 10.2174/1568006043336302. [DOI] [PubMed] [Google Scholar]
- 53.Chiastra C, et al. Computational fluid dynamic simulations of image-based stented coronary bifurcation models. Journal of The Royal Society Interface. 2013;10(84) doi: 10.1098/rsif.2013.0193. [DOI] [PMC free article] [PubMed] [Google Scholar]
- 54.Chiastra C, et al. On the necessity of modeling fluid–structure interaction for stented coronary arteries. Journal of the Mechanical Behavior of Biomedical Materials. 2014;34:217–230. doi: 10.1016/j.jmbbm.2014.02.009. [DOI] [PubMed] [Google Scholar]
- 55.Taylor C, Steinman D. Image-Based Modeling of Blood Flow and Vessel Wall Dynamics: Applications, Methods, and Future Directions. Annals of Biomedical Engineering. 2010;38(3):1188–1203. doi: 10.1007/s10439-010-9901-0. [DOI] [PubMed] [Google Scholar]
- 56.Johnston BM, et al. Non-Newtonian blood flow in human right coronary arteries: Transient simulations. Journal of Biomechanics. 39(6):1116–1128. doi: 10.1016/j.jbiomech.2005.01.034. [DOI] [PubMed] [Google Scholar]
- 57.Liu B, Tang D. Influence of non-Newtonian Properties of Blood on the Wall Shear Stress in Human Atherosclerotic Right Coronary Arteries. Molecular & cellular biomechanics : MCB. 2011;8(1):73–90. doi: 10.3970/mcb.2011.008.073. [DOI] [PMC free article] [PubMed] [Google Scholar]
Associated Data
This section collects any data citations, data availability statements, or supplementary materials included in this article.
Supplementary Materials
Supplementary Table. 1. Pearson correlation coefficients for co-registered MRI slices taken at each visit (case-1, 2 and 3). A number of MRI slices was 27.
Supplementary Table. 2 Pearson correlation coefficients for co-registered MRI slices taken at each visit (case-4, 5 and 6). A number of MRI slices was 27.
SF.1 Velocity profile for patient-1(case-1, 2, 3) and patient-2 (case-3, 4, 5) at 0, 12 and 24-months.
SF.2 Plot of a local region of interest (ROI) where the ROI consists of 4 MRI slices.


