Abstract
We present the use of a commercially available electrically tunable lens to achieve axial scanning in a reflectance confocal microscope. Over a 255 μm axial scan range, the lateral and axial resolutions varied from 1–2 μm and 4–14 μm, respectively, dependent on the variable focal length of the tunable lens. Confocal imaging was performed on normal human biopsies from the oral cavity ex vivo. Sub-cellular morphologic features were seen throughout the depth of the epithelium while axially scanning using the focus tunable lens.
Keywords: Confocal microscopy, tunable focus lens, cancer
1. INTRODUCTION
Many optical imaging modalities have been explored to improve early detection of epithelial oral cancer in vivo and increase survival rate. [1, 2] Reflectance confocal microscopy is one example that provides high resolution images of the tissue throughout the epithelium by collecting only in focus light passed through a collection pinhole. [3] Sub-cellular refractive index variations provide contrast in these images. Since confocal microscopy is a point scanning technique providing images from a specific depth, the need for axial scanning has been a challenging problem for in vivo applications. For in vivo imaging, there is a need for faster axial scanning to reduce motion artifacts in smaller and less complex packaging to be incorporated into an endoscopic probe. Therefore, some research groups have used mechanical movement by hydraulic, pneumatic or mechanical scanners, [2, 4, 5] while others have axially scanned the sample using light by benefiting from chromatic aberrations, variable focus lenses, or adaptive phase compensation techniques. [6–9] We present the use of an electrically focus tunable lens (ETL) in a reflectance confocal microscopy system for imaging of epithelial tissue.
2. INSTRUMENTATION
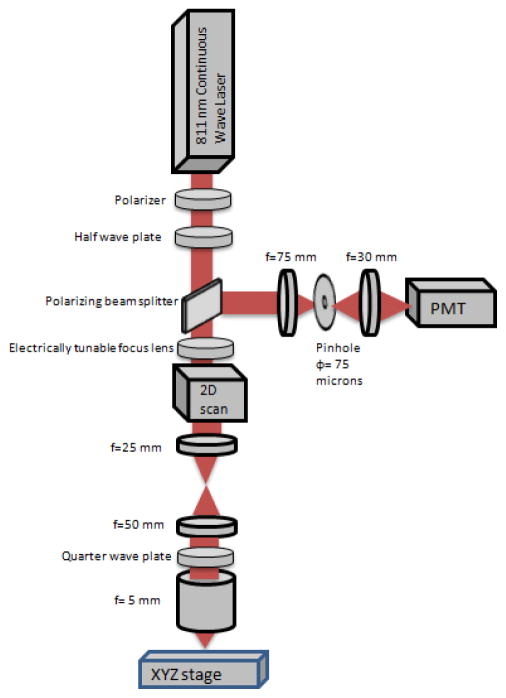
Figure 1 shows the schematic of the microscope used in this paper, based on a system reported previously [1, 2]. An 811 nm continuous wave laser, a linear polarizer, and a half wave plate are used to illuminate the sample with near infrared light with power ranging between less than 1 mW and more than 60 mW. A scanner resonating at 7910 Hz is used for line scanning and a galvanometer scanner set at 7 Hz are supported in one mount and have their mirrors spaced by 0.61 cm. An electrically tunable lens (EL-6-18, Optotune, Switzerland), with a focus tunable range of −500 mm to infinity to +50 mm, was placed as near as possible to the scanners. Two achromatic doublet lenses of focal lengths of 25 mm and 50 mm, placed in a 4F system, expand the collimated laser beam size from 3.7 mm to 7.4 mm and form an image of the scanners on the back focal plane of the objective lens. The objective lens has an effective focal length of 5 mm and is water immersion to better match the tissue refractive index. An achromatic doublet lens focuses the collected reflected light from the sample onto a 75 μm pinhole, which is imaged on a photomultiplier tube (PMT). Output signal from the PMT is converted to a voltage signal then given to a digitizer for image formation and distortion correction.
Figure 1.
Schematic of the reflectance confocal microscope using the electrically tunable focus lens.
3. PERFORMANCE TESTING
Several tests were done to test the axial scan range, field of view, magnification, lateral resolution, and axial resolution of the reflectance confocal microscope with the electrically focus tunable lens. Using the lens driver, the electrically tunable focus lens was controlled by multiple DC current signals with levels ranging from 0 to 150 mA. At each new DC signal corresponding to a new focal length of the lens, a ronchi ruling is seen in focus at a different axial position. For example, 50 mA corresponds to f = ∞ for the electrically focus tunable lens and the focus in sample space positioned at the nominal working distance of the objective lens (axial focal position = 0). When the control current increases, the axial focal position in the sample moves up closer to the objective. These positions were plotted as a function of the control current and plotted in Figure 2.
Figure 2.
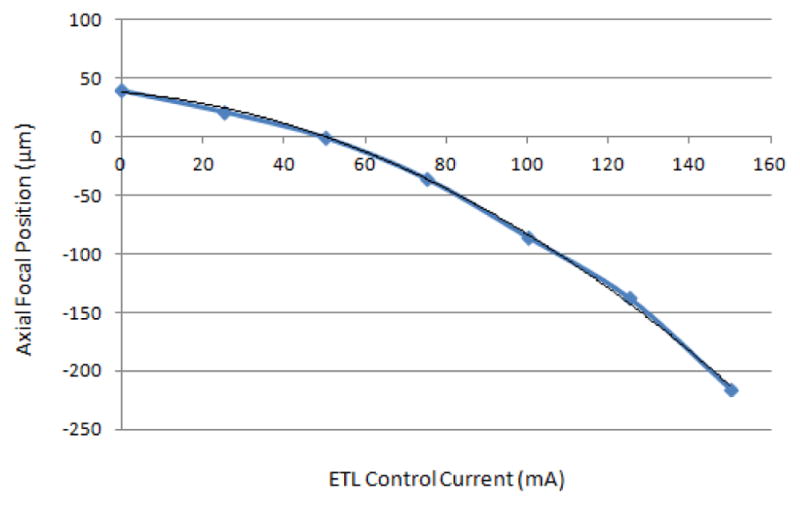
Depth below the surface in microns versus control current to ETL in mA.
To measure the maximum change in magnification with the change in focal lengths from electrically focus tunable lens, the scanners’ angles were decreased to decrease the field of view to include elements 4, 5 and 6 of group 6 of the United States Air Force (USAF) target. By changing the electrically focus tunable lens control current, the number of pixels per group 6 element 6 changes; therefore, we find the relative change in magnification and plot it as a function of axial position of the object, as shown in Figure 3. The measured magnification changes by less than 20% over the scan range. The total magnification of the microscope without the ETL, or with the ETL focal length set to infinity, is 30. To measure the field of view, the number of line pairs in the image of a Ronchi ruling immersed in water was counted to be 625 μm.
Figure 3.
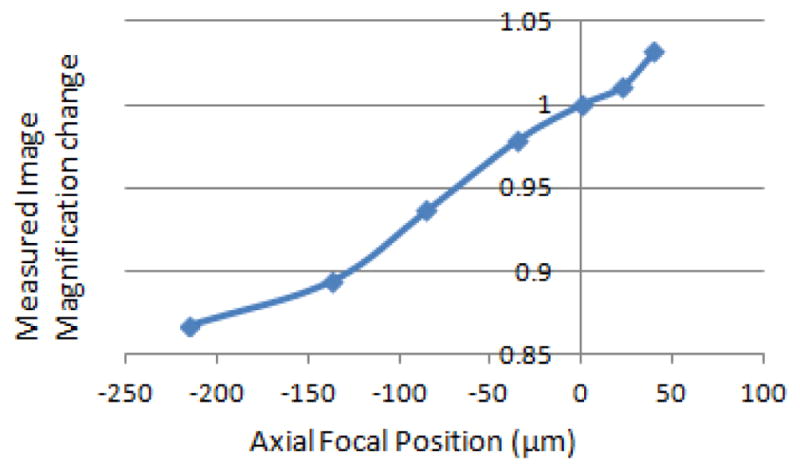
Measured relative magnification of the confocal microscope versus axial focal position.
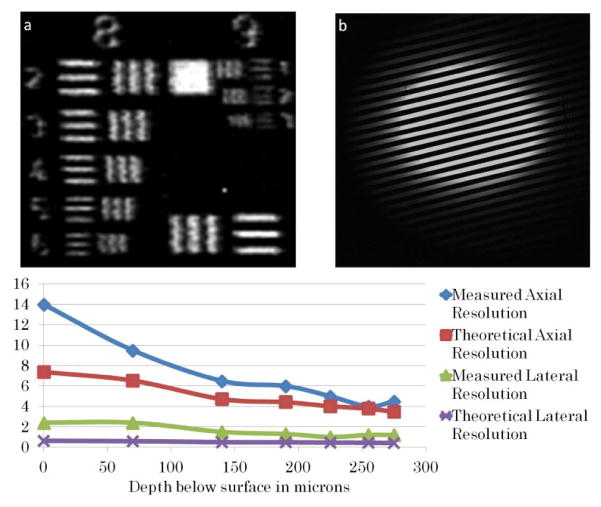
Lateral and axial resolutions were evaluated both qualitatively by looking at a reflective positive high-resolution USAF target immersed in water and quantitatively by measuring the full width half maximum of the derivative of the edge function at different image depths corresponding to different focal lengths of the electrically focus tunable lens. Without the electrically tunable focal length lens, the theoretical lateral and axial resolution of the system are 0.46 and 4.2 μm. To measure the axial resolution at each setting of the electrically focus tunable lens, a planar mirror immersed in water was translated axially using the stage in 0.5 μm steps. The axial resolution is measured from the full width half maximum of the reflectance plot collected by the PMT. Figure 4 shows an increase in the theoretical and measured lateral and axial resolution as the axial focus scans up in the sample or closer to the surface. This is due to the decrease in beam size before the objective, thus decrease in numerical aperture at the sample, as the electrically focus tunable lens focal length decreases to positive foci.
Figure 4.
Theoretical and measured lateral and axial resolution (in μm) along the axial range of 255 μm achieved by the electrically tunable focus lens. (a): image of USAF high resolution target showing that element 6 of group 8 is resolvable. (b): image of 40 line pairs/mm grating showing 25 line pairs which is equivalent to a field of view of 625 μm.
4. TISSUE IMAGING
To further test the performance of the electrically focus tunable lens, two ex vivo biopsies from normal and inflamed human oral sites were imaged first with the electrically focus tunable lens axial scan then with the motorized stage scan to compare the images. The protocol for imaging was as follows: obtaining consent from patients, obtaining the biopsy tissue from the doctor directly after excision, putting the biopsy tissue in phosphate buffered saline solution, transporting the tissue to the laboratory, soaking the biopsy for one minute in acetic acid to increase contrast between nuclei and cytoplasm, imaging the same location with electrically focus tunable lens then stage scan at steps of 2 μm within less than one hour after excision, and finally fixing the biopsy in formalin. This imaging protocol was approved by Texas A&M University and Baylor College of Dentistry Institutional Review Boards.
The electrically tunable focus lens was controlled with a triangular signal with a frequency, corresponding to the axial scan speed, of 0.2 Hz for the normal tissue and of 0.1 Hz for the inflamed tissue. Images from the electrically focus tunable lens axial scan were compared to corresponding images at the same depth taken with stage scan. All images and videos were cropped and contrast enhanced using ImageJ Software.
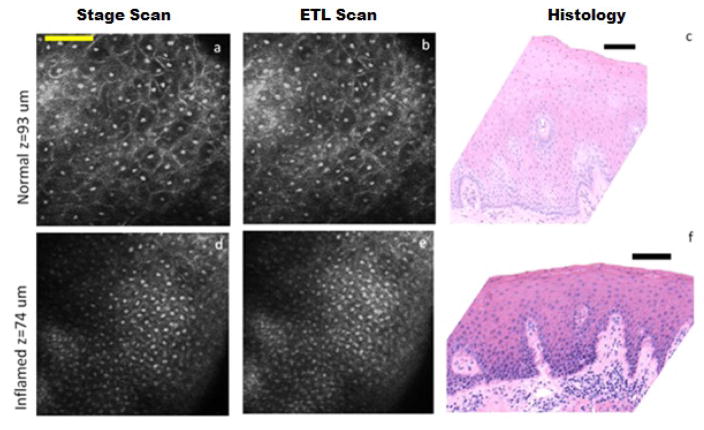
Figure 5(a–c) show confocal images extracted from videos (Video 1) obtained with (a) stage scan and (b) electrically focus tunable lens scan, and (c) the corresponding histology image of ex vivo normal gingival tissue, as diagnosed by histopathology. Nuclei, seen as bright spots, are distantly dispersed in the confocal images down to 180 microns below the surface. Cell borders are also seen as bright lines around the dark cytoplasm surrounding the nuclei. In the histology image, the distribution of the darkly stained nuclei in the top part of the epithelium corresponds well to what is shown in the confocal videos.
Figure 5.
Confocal images from stage scan (a,d) and ETL scan (b,e) taken from 93 μm below surface of normal biopsy (a,b) and 74 μm below the surface of inflamed biopsy (d,e). (c,f) Corresponding histology images. Nuclei are clear bright spots surrounded by dark cytoplasmic matter. Scale bars: (a) 78 μm and (c,f) 100 μm. Video 1 and Video 2 show axial stage and ETF scans with depth below the surface shown at the top right for normal, and inflamed respectively.
Figure 5(d–f) show confocal images taken from videos (Video 2) with both (d) stage scan and (e) ETL scan of ex vivo inflammatory gingival hyperplasia, as diagnosed by histopathology (f). The nuclear to cytoplasmic ratio increases as the cytoplasm area shrinks and the nuclei increase in size; the nuclei are more crowded than its normal counterpart. The hyperchromatism of the nuclei is also in favor of clearer and brighter nuclei in reflectance confocal microscopy images. Even with these changes, the cells still show maturation from the base to the surface of the epithelium. The papillae, connective tissue protruding into epithelium between rete ridges, are seen as dark spots surrounded by bright basal cell nuclei in the deep layers of the confocal videos.
In both Video 1 and 2, the images of the ETL scan close to the surface of the tissue appear more clustered and blurry than those from the stage scan. This effect is due to the decrease in performance of the ETL at shallower depths as shown in Figure 4. The images of ETL scan at deeper locations are almost indistinguishable from stage scan showing the superior performance of the ETL at deeper depths. This change in performance with depth works in accordance with the morphology of the tissue where more nuclear crowding is seen closer to the basement membrane and higher scattering and wavefront distortion affects imaging deeper in tissue.
5. CONCLUSION
In summary, the use of an electrically focus tunable lens in a reflectance confocal microscopy system for optical axial scanning was tested and validated. The performance of this lens over the axial scan range was evaluated in terms of lateral and axial resolution change. This axial scanning technique was later demonstrated by imaging oral epithelial tissue ex vivo. With this technique, it is possible to choose a specific depth below the tissue to look at in vivo by setting the ETL lens at a certain focal length. Another advantage is the choice among multiple speeds of axial scanning, depending on the application used, by changing the frequency of the ETL control current. In conclusion, the ETL axial scanning offers a tremendous potential for endoscopic in vivo confocal imaging applications.
Supplementary Material
Acknowledgments
The authors would like to thank Research Assistant Mrs. Lee Jordan from the Department of Diagnostic Sciences, Texas A&M Health Science Center - Baylor College of Dentistry for her help with tissue collection and the National Institutes of Health (R01 CA138653) for funding.
References
- 1.Jabbour JM, Cheng S, Malik BH, et al. Fluorescence lifetime imaging and reflectance confocal microscopy for multiscale imaging of oral precancer. Journal of Biomedical Optics. 2013;18(4):046012. doi: 10.1117/1.JBO.18.4.046012. [DOI] [PMC free article] [PubMed] [Google Scholar]
- 2.Maitland KC, Gillenwater AM, Williams MD, et al. In vivo imaging of oral neoplasia using a miniaturized fiber optic confocal reflectance microscope. Oral Oncology. 2008;44(11):1059–66. doi: 10.1016/j.oraloncology.2008.02.002. [DOI] [PMC free article] [PubMed] [Google Scholar]
- 3.Jabbour JM, Saldua MA, Bixler JN, et al. Confocal endomicroscopy: instrumentation and medical applications. Annals of Biomedical Engineering. 2012;40(2):378–97. doi: 10.1007/s10439-011-0426-y. [DOI] [PMC free article] [PubMed] [Google Scholar]
- 4.Tanbakuchi AA, Rouse AR, Udovich JA, et al. Clinical confocal microlaparoscope for real-time in vivo optical biopsies. Journal of Biomedical Optics. 2009;14(4):044030. doi: 10.1117/1.3207139. [DOI] [PMC free article] [PubMed] [Google Scholar]
- 5.Sung KB, Liang C, Descour M, et al. Fiber-optic confocal reflectance microscope with miniature objective for in vivo imaging of human tissues. IEEE Transactions on Biomedical Engineering. 2002;49(10):1168–72. doi: 10.1109/TBME.2002.803524. [DOI] [PubMed] [Google Scholar]
- 6.Olsovsky C, Shelton R, Carrasco-Zevallos O, et al. Chromatic confocal microscopy for multi-depth imaging of epithelial tissue. Biomedical Optics Express. 2013;4(5):732–40. doi: 10.1364/BOE.4.000732. [DOI] [PMC free article] [PubMed] [Google Scholar]
- 7.Thompson AJ, Paterson C, Neil MA, et al. Adaptive phase compensation for ultracompact laser scanning endomicroscopy. Optics Letters. 2011;36(9):1707–9. doi: 10.1364/OL.36.001707. [DOI] [PubMed] [Google Scholar]
- 8.Kumar S, Wilding D, Sikkel MB, et al. High-speed 2D and 3D fluorescence microscopy of cardiac myocytes. Optics Express. 2011;19(15):13839–47. doi: 10.1364/OE.19.013839. [DOI] [PubMed] [Google Scholar]
- 9.Jabbour JM, Malik BH, Olsovsky C, et al. Optical axial scanning in confocal microscopy using an electrically tunable lens. Biomedical Optics Express. 2014;5(2):645–652. doi: 10.1364/BOE.5.000645. [DOI] [PMC free article] [PubMed] [Google Scholar]
Associated Data
This section collects any data citations, data availability statements, or supplementary materials included in this article.


