Figure 5.
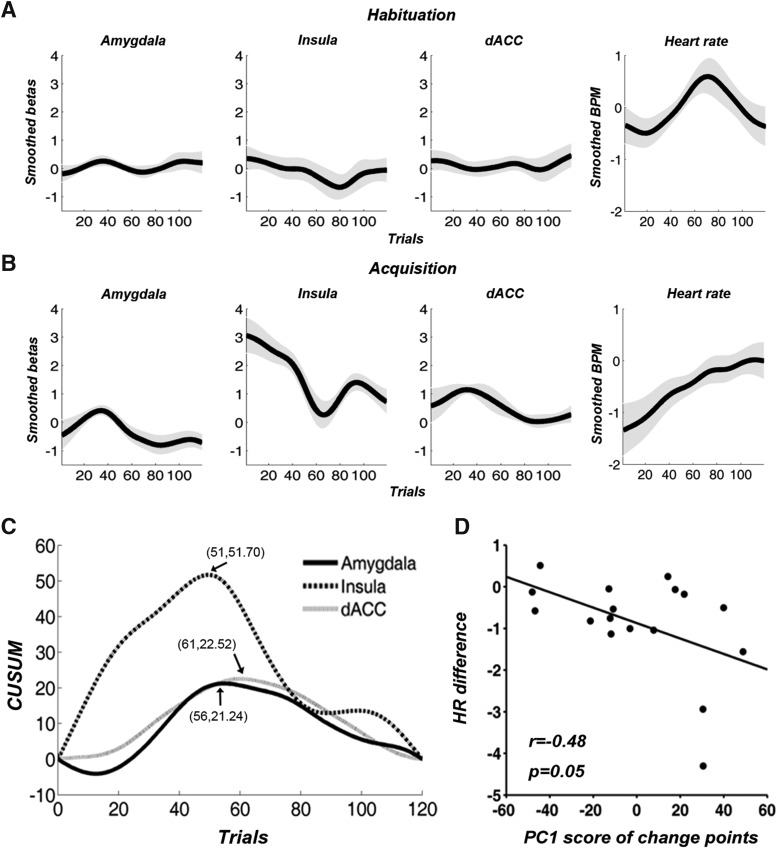
Temporal dynamics of brain activity in three ROIs and HR. A, During habituation, time courses of differential BOLD activity were flat in the three ROIs, and there was no systematic trend in differential HR. B, During acquisition, a general declining trend for BOLD as observed for each ROI, and HR difference also diminished. C, Three change points detected by CUSUM chart were marked by the arrows and the numbers in the bracket gave the corresponding trial number and the cumulative sum. D, HR difference (CS+ minus CS– over acquisition) was negatively associated with the score of the first principal component (PC1) from the three change points of the three ROIs. Gray shade in A, B represents standard error of the mean.

