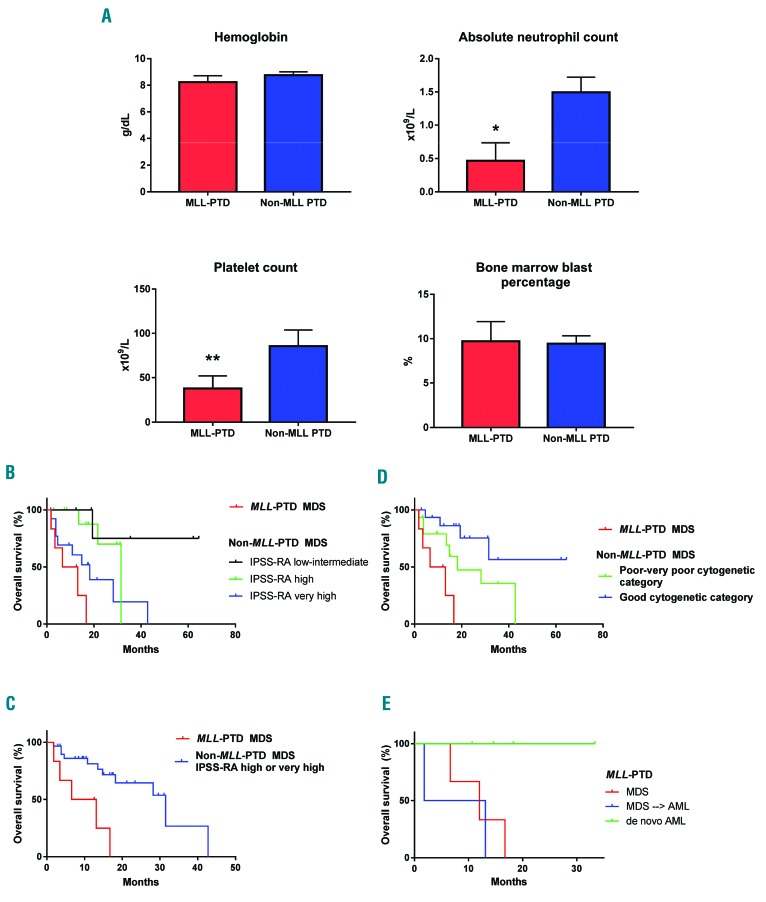
Figure 1.
MLL-PTD MDS presents with lower absolute neutrophil and platelet counts and displays worse prognosis than high risk non-MLL-PTD MDS. (A) Hemoglobin, absolute neutrophil count, platelet count, and bone marrow blast percentage were compared between MLL-PTD MDS and non-MLL-PTD MDS with high to very high IPSS-RA score [mean value and standard error of the mean are depicted; *(P=0.012) **(P=0.046)]. (B) Survival analysis comparing MLL-PTD MDS to non-MLL-PTD MDS based on IPSS-RA prognostic group (P<0.0001). (C) Survival analysis comparing MLL-PTD MDS to high or very high risk non-MLL-PTD MDS based on IPSS-RA score (P=0.002). (D) Survival analysis comparing MLL-PTD MDS to non-MLL-PTD MDS with poor to very poor cytogenetic and good cytogenetic groups (P=0.027). (E) Survival analysis comparing MLL-PTD MDS, transformed MLL-PTD MDS, and de novo MLL-PTD AML cases (P=0.043). PTD: partial tandem duplication; MDS: myelodysplastic syndrome; IPSS-RA: age-adjusted IPSS-R.

