Abstract
The microRNAs miR-144 and -451 are encoded by a bicistronic gene that is strongly induced during red blood cell formation (erythropoiesis). Ablation of the miR-144/451 gene in mice causes mild anemia under baseline conditions. Here we show that miR-144/451−/− erythroblasts exhibit increased apoptosis during recovery from acute anemia. Mechanistically, miR-144/451 depletion increases the expression of the miR-451 target mRNA Cab39, which encodes a co-factor for the serine-threonine kinase LKB1. During erythropoietic stress, miR-144/451−/− erythroblasts exhibit abnormally increased Cab39 protein, which activates LKB1 and its downstream AMPK/mTOR effector pathway. Suppression of this pathway via drugs or shRNAs enhances survival of the mutant erythroblasts. Thus, miR-144/451 facilitates recovery from acute anemia by repressing Cab39/AMPK/mTOR. Our findings suggest that miR-144/451 is a key protector of erythroblasts during pathological states associated with dramatically increased erythropoietic demand, including acute blood loss and hemolytic anemia.
Introduction
Dysregulation of microRNAs (miRNAs) is implicated in the pathophysiology of many human diseases including cancer, cardiovascular disease, and anemia.1,2 There is increasing evidence that miRNAs regulate red blood cell (RBC) formation (erythropoiesis) by controlling the proliferation and differentiation of RBC precursors, termed erythroblasts.3 For example, miR-126 negatively regulates erythropoiesis by repressing mRNA encoding the tyrosine phosphatase PTPN9, which is required for erythroblast proliferation,4 whereas ectopic expression of miR-27a, miR-24, and miR-146b in CD34+ hematopoietic progenitor cells promotes erythroid maturation by repressing GATA-2 or increasing GATA-1, which activates the GATA switch, a key step in erythropoiesis.5,6 However, the role of miRNAs and their targets in regulating erythropoiesis is not fully understood.
The bicistronic miRNA locus encoding miRs-144 and -451 is strongly induced during erythropoiesis in zebrafish, mice, and humans.7–9 Chromatin immunoprecipitation (ChIP) and gene complementation studies show that miR-144/451 transcription is activated by GATA-1,10 a transcription factor that regulates many aspects of erythropoiesis, including precursor proliferation, maturation, and survival. Remarkably, miR-451 accounts for approximately 50% of the total miRNA pool in mouse fetal liver (FL) erythroblasts.11 Unlike most miRNAs, miR-451 biogenesis occurs independently of the RNA III enzyme Dicer. Rather, it is Argonaut 2 (Ago2) that catalyzes the cleavage of pre-miR-451 hairpins.12
Inhibition of miR-144/451 blocks erythropoiesis in tissue culture models.8,10,13–15 Fewer studies have been performed with in vivo models.13–15 Moreover, the phenotypes observed after manipulating miR-144/451 expression vary according to the model used and the mode of gene manipulation. For example, miR-144/451 inhibition appears to exert a greater effect on erythroblasts in culture than on those in vivo, suggesting that the phenotype depends on the cell environment (X Fang et al., unpublished data, 2017). Along with others, we have also demonstrated that miR-144/451 gene knockout (KO) mice exhibit mild baseline anemia that worsens upon oxidative stress.13,15 Similarly, loss of miR-451 in zebrafish renders erythroid precursors sensitive to oxidant stress.15 The anti-oxidant role of miR-144/451 during erythropoiesis is at least partially dependent on suppression of the mRNA target Ywhaz, which encodes the cytoplasmic adaptor protein 14-3-3ζ.13,15 miR-144/451 depletion increases 14-3-3ζ protein, which sequesters the transcription factor FoxO3 in the cytoplasm, thereby reducing expression of several target genes that encode anti-oxidant proteins. This mechanism explains the hypersensitivity of miR-144/451−/− RBCs to oxidant stress but is unlikely to account for all the activities of these miRs. For example, miR-144/451−/− mice exhibit ineffective erythropoiesis at baseline and delayed recovery after anemia caused by oxidant stress13–15 via unknown mechanisms.
We discovered that erythroblasts isolated from miR-144/451−/− FL during embryonic gestation or bone marrow and spleen during acute anemia exhibit increased apoptosis compared to wild-type (WT) counterparts. This effect is mediated by derepression of the direct miR-451 target mRNA Cab39 followed by activation of the downstream LKB1/AMPK/mTOR pathway. Thus, miR-144/451 enhances physiological responses to acute anemia by promoting the survival of RBC precursors.
Methods
Animals
miR-144/451 KO mice were described previously.15 p53ER knock-in (KI) mice were kindly provided by Gerard Evan (University of Cambridge, UK).16
Cell culture and treatment
G1E and G1E-ER4 erythroid cells were grown in culture as previously described.17 The isolation of erythroid progenitors from embryonic day 14.5 (E14.5) FLs, the growth of erythroid progenitors in maturation medium, and the retroviral infection of erythroid cells in expansion medium have all been described previously.18 Details of drug treatments of cells are described in the Online Supplementary Appendix.
Protein and miRNA expression
Western blot and real-time PCR analyses for gene expression were described in the Online Supplementary Appendix.
Fluorescence-activated cell sorting (FACS)
The expression of RBC surface markers and cell death were analyzed with an LSRII or LSRFortessa Cell Analyzer System (BD Biosciences). The Annexin V Early Apoptosis Detection Kit (cat. n. 553786) was obtained from BD Biosciences. The nucleation of erythroid cells was quantitated by staining with Hoechst 33342 (Sigma); cell viability was quantitated by staining cells with death markers 7AAD, propidium iodide (PI) or Live/Dead® Near-IR Fixable Dead Cell Stain (Invitrogen). Erythroid subpopulations were sorted on the basis of CD71/Ter119 expression (BD Biosciences).
Dual-luciferase reporter assay
Construction of the plasmids for luciferase assays is described in the Online Supplementary Appendix. The dual-luciferase reporter assay was performed as previously described.15
Retroviral shRNA delivery
The construction of retroviral plasmids and transduction of cells are described in the Online Supplementary Appendix.
Hematologic analysis
For hematocrit (HCT) and reticulocyte counts, blood from adult mice was sampled retro-orbitally, anticoagulated with EDTA, and analyzed on a Hemavet HV950FS analyzer (Drew Scientific, Dallas, TX, USA). Heparinized glass microhematocrit tubes (Globe Scientific, Paramus, NJ, USA) were used for manual spun hematocrits. Reticulocytes were counted using Retic-COUNT reagent (BD Biosciences) or Ter119/CD71 staining and analyzed on a FACSCalibur Flow Cytometer (BD Biosciences).
For phenylhydrazine (PHZ) treatment, mice were injected intraperitoneally (63 mg/kg). HCT and reticulocyte counts were analyzed for ten consecutive days thereafter.
To eradicate erythroid progenitors in adult mice, 5-FU (Sigma-Aldrich) at a single dose of 150 mg/kg was injected intraperitoneally, and the HCT and reticulocyte counts were analyzed for 25 consecutive days thereafter. Animal survival was monitored every day.
To generate acute anemia by bleeding, 400 μL of blood was drawn retro-orbitally every day. The HCT and reticulocyte counts were analyzed three days later.
Microarray analysis
CD71+/Ter119+/FSChigh nucleated bone marrow cells from miR-144/451−/− mice and WT controls were purified by flow cytometry, and samples were processed for microarray analysis using the GeneChip Mouse Genome 430 2.0 Array (Affymetrix), as described previously.15 The database for G1E-ER4 erythroid maturation has been described in an earlier paper.19
Statistical analysis
Statistical analyses were performed using Microsoft Office Excel 2011 (Microsoft Corporation, Redmond, WA, USA). Graphs were created using Adobe Photoshop CS6 (Adobe Systems Inc., San Jose, CA, USA). Data from triplicate experiments or 3 different samples are presented as the mean ± standard deviation. The differences were assessed by two-tailed Student t-tests. P<0.05 was considered statistically significant. All experiments were repeated at least 3 times.
Results
Increased apoptosis of miR-144/451−/− erythroblasts during erythropoietic stress
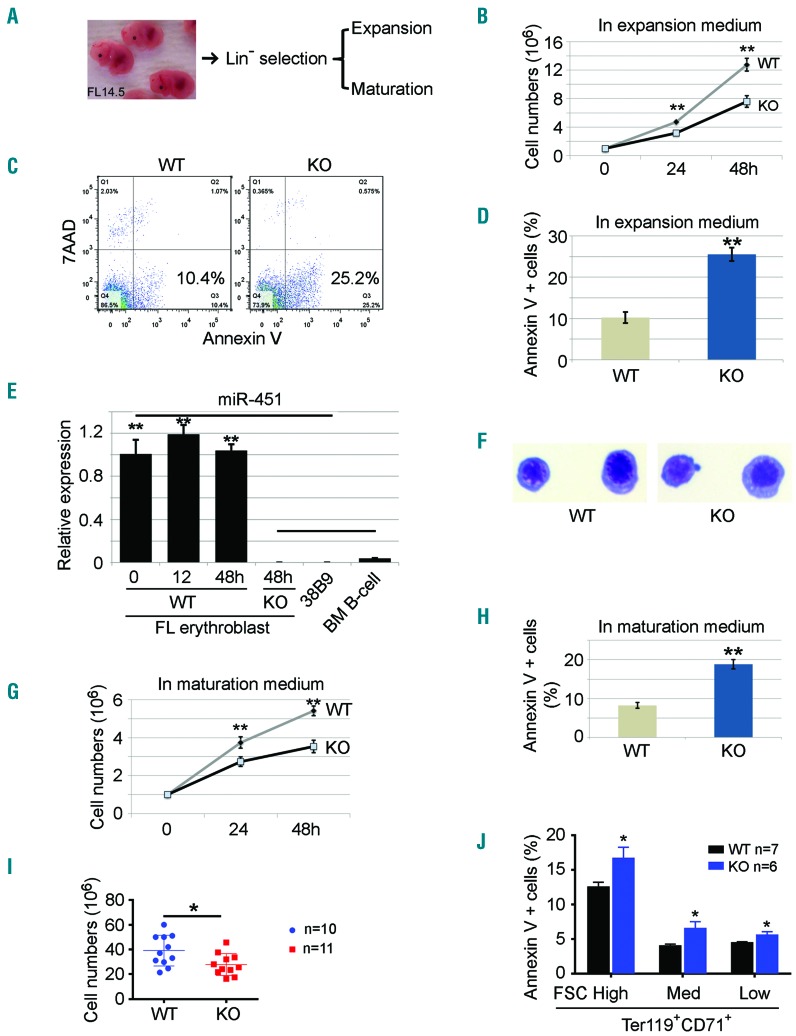
To study the effects of miR-144/451 on erythropoiesis, we cultured equal numbers of FL erythroid precursors from embryonic day (E) 14.5 KO or WT embryos in media that facilitated their expansion or terminal maturation18 (Figure 1A). After 48 hours (h) in expansion medium, miR-144/451−/− erythroblasts exhibited reduced cell numbers (Figure 1B) and increased apoptosis, which was quantified by Annexin V staining (Figure 1C and D). As expected, KO erythroblasts lacked miR-451 expression (Figure 1E). Both WT and KO cells maintained their erythroblast identity after 48 h in culture (Figure 1F). Similarly to the effects observed in expansion medium, miR-144/451−/− erythroid progenitors exhibited reduced cell numbers and increased apoptosis after 48 h culture in maturation medium (Figure 1G and H). Importantly, erythroid precursors isolated directly from miR-144/451−/− E14.5 FLs were reduced in number and exhibited increased apoptosis compared to controls (Figure 1I and J). However, we detected no increase in apoptosis of erythroblasts isolated directly (not cultured) from spleen or bone marrow from adult miR-144/451−/− mice (Online Supplementary Figure S1A and B). Fetal liver erythropoiesis is considered a “stress state” because production demands are extremely high compared to steady state bone marrow erythropoiesis in adults.20 Thus, miR-144/451 may protect erythroblasts from apoptosis during erythropoietic stress associated with increased demands for RBC production. Consistent with this, we had previously noted that recovery from (PHZ)-induced hemolytic anemia was delayed in miR-144/451−/− mice.15
Figure 1.
Increased apoptosis of miR-144/451−/− erythroblasts during erythropoietic stress. (A) miR-144/451−/− progenitor cells were isolated from E14.5 fetal liver (FL) erythroblasts and grown in culture in expansion medium or maturation medium. (B) Cell proliferation rates of FL erythroid blasts in expansion medium for 24 and 48 hours (h). n=3 FLs. **P<0.01 (t-test). Experiments were repeated 3 times. (C) Flow cytometry-based analysis of apoptosis using Annexin V. (D) Quantitative analysis of the flow cytometry data from (C). Data from 3 independent experiments. **P<0.01 (t-test). (E) Quantitative PCR analysis of miR-451 expression in FL progenitors grown in expansion medium for different lengths of time. Progenitor cells from miR-144/451−/− FLs, mouse B-lymphoma cell line 38B9, and normal B lymphocytes sorted from mouse bone marrow were used as negative controls. Note: the high miR-451 expression in the 0-h culture suggests the erythroid identity of the progenitors, whereas the lack of a significant increase in miR-451 after 48 h in culture suggests that there is no further differentiation of erythroid progenitors grown in culture. (F) FL progenitors grown in expansion medium for 48 h. Cells were cytospun onto slides and stained with May-Grunwald-Giemsa. (G) Cell proliferation rates of FL erythroid cells in maturation medium for 24 and 48 h. N=3. **P<0.01 (t-test). (H) Percentage of apoptotic cells in maturation medium based on flow cytometric analysis. Data represent 3 independent experiments. **P<0.01 (t-test). (I) Cell numbers in whole E14.5 FLs without in vitro expansion. WT n=10, KO n=11. *P<0.05 (t-test). (J) Percentage of apoptotic cells in different regions gated by CD71/Ter119 staining and FSC intensity. WT n=7, KO n=6. *P<0.05 (t-test).
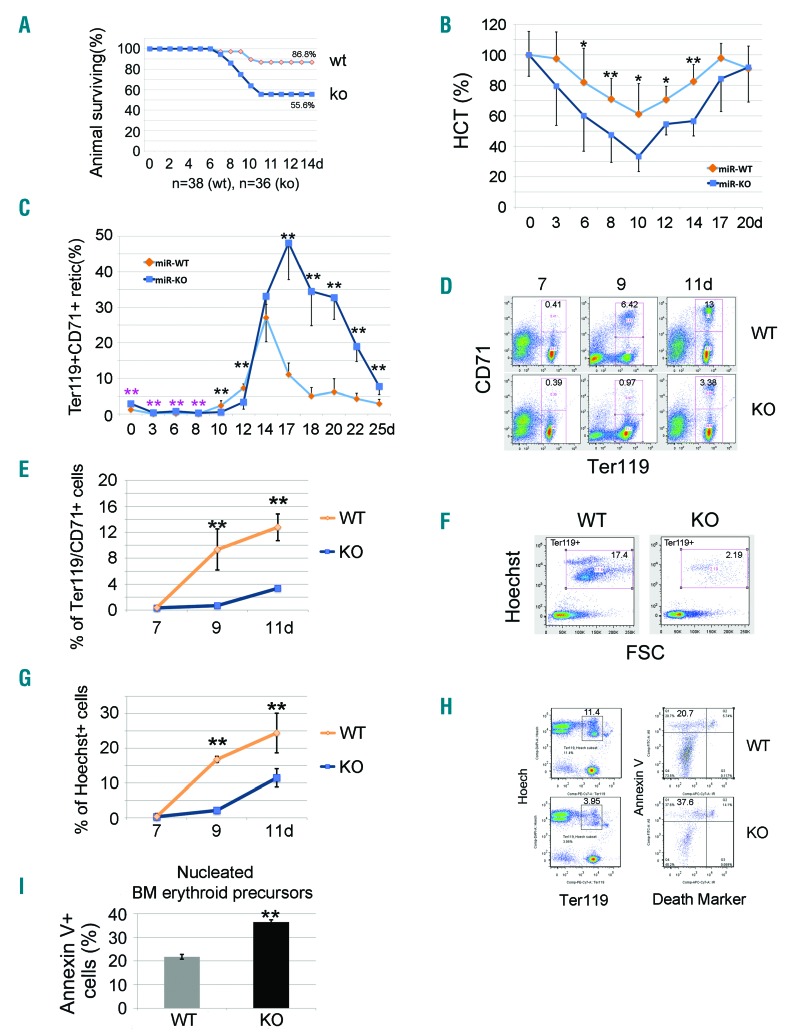
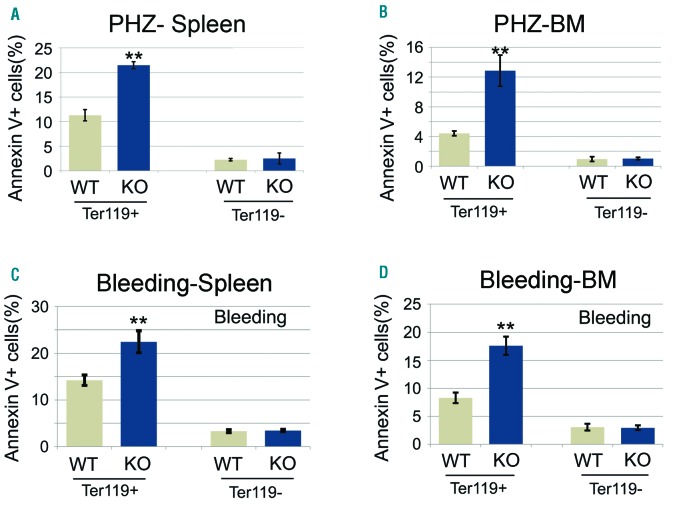
To examine further the effects of erythropoietic stress on adult miR-144/451−/− mice, we treated them with a single dose of 5-fluorouracil (5-FU), which destroys committed hematopoietic progenitors, including erythroblasts. Compared to WT mice, miR-144/451−/− mice exhibited increased mortality after 5-FU treatment (55.6% vs. 86.8% survival) (Figure 2A), which was associated with a greater decline in their hematocrit (Figure 2B). During the recovery phase after 5-FU treatment, the mutant mice exhibited higher levels of late stage circulating erythroid precursors (reticulocytes) (Figure 2C), probably in response to the more severe anemia (Figure 2B). However, the time to maximal reticulocyte response was delayed by several days in KO mice compared to WT controls (Figure 2C). Similarly, the emergence of bone marrow erythroid precursors was delayed in KO mice (Figure 2D–G). Moreover, bone marrow erythroblasts of miR-144/451−/− mice with 5-FU treatment exhibited increased apoptosis compared to WT controls (Figure 2H and I). We also observed increased apoptosis of miR-144/451−/− bone marrow and splenic erythroblasts during recovery from PHZ-induced anemia (Figure 3A and B) or phlebotomy (Figure 3C and D). Thus, miR-144/451−/− erythroblasts exhibit increased apoptosis under conditions of increased physiological demand for RBC production, i.e. under erythropoietic stress.
Figure 2.
Apoptotic erythroblasts in miR-144/451−/− bone marrow increase after administration of 5-fluorouracil (5-FU) in adult mice. (A) Survival rates after 5-FU treatment for n=38 (wild-type, WT) and n=36 (miR-144/451−/−, KO) mice. (B) Increased hemolysis of miR-144/451−/− erythrocytes after exposure to 5-FU, as determined by serial hematocrit measurement. N=12 miR-144/451−/− and n=12 WT mice were used. *P<0.05; **P<0.01 (t-test). (C) Flow cytometric analysis of Ter119+CD71+ reticulocytes in circulating blood after 5-FU treatment. N=5 mice of each genotype were used. **P<0.01 (t-test). Note: for the first eight days there were relatively more reticulocytes in miR-144/451−/− blood as compared to WT blood, but significantly fewer during days 8 to 12. The number of reticulocytes in miR-144/451−/− blood dramatically increased around day 14, and much higher levels were sustained than in WT animals. (D) Flow cytometric analysis of Ter119+CD71+ erythroid cells in bone marrow after 5-FU administration for 7–11 days. Note: the appearance of Ter119+CD71+ erythroid cells in bone marrow was delayed relative to that in WT mice, indicating a maturation arrest and/or sustained apoptosis of erythroid cells in miR-144/451−/− mice. (E) Quantitated analysis of Ter119+CD71+ erythroid cells in bone marrow after 5-FU administration for 7–11 days. There were n=5 mice of each genotype at each time point. **P<0.01 (t-test). (F) Flow cytometric analysis of nucleated cell numbers in bone marrow after 5-FU administration. All cells shown in the windows were Ter119+. Gated regions represent nucleated erythroblasts (Hoechst+FSChigh). (G) Quantitative analysis of flow cytometry data from (F). There were n=5 mice of each genotype at each time point. **P<0.01 (t-test). Note: there were far fewer nucleated erythroid cells in miR-144/451−/− bone marrow during days 9 to 11, indicating a maturation arrest and/or sustained apoptosis. (H) Flow cytometric analysis of early apoptosis using Annexin V. Ter119+/Hoechst+ cells are nucleated erythroid cells (left). Near-IR cell death marker−/Annexin V+ cells are early apoptotic cells (right). (I) Quantitative analysis of flow cytometry data from (H). We used n=5 mice of each genotype at day 11 after 5-FU treatment. **P<0.01 (t-test).
Figure 3.
Apoptosis of miR-144/451−/− bone marrow and spleen erythroblasts is increased under other stress conditions. (A and B) Results of flow cytometric analysis of nucleated erythroid cell apoptosis in spleen (A) and bone marrow (B) after phenylhydrazine (PHZ) administration. miR-144/451−/− mice (n=5) and wild-type (WT) littermates (n=5) were treated with PHZ (120 mg/kg) on days 0 and 1. Splenocytes and bone marrow cells were harvested four days after PHZ injection. Ter119+Hoechst+ cells are nucleated erythroid cells. Annexin V+PI− near IR− cells are early apoptotic cells. Ter119− cells are non-erythroid cells. **P<0.01 (t-test). (C and D) Flow cytometric analysis of early apoptosis rates of spleen (C) and bone marrow (D) nucleated erythroblasts after bleeding. miR-144/451−/− mice (n=5) and WT littermates (n=5) had 0.4 mL of blood drawn on two consecutive days. Splenocytes and bone marrow cells were harvested on day 3. **P<0.01 (t-test). Note: more early apoptotic erythroblasts were seen in miR-144/451−/− mice.
miR-451 targets Cab39 mRNA in erythroblasts
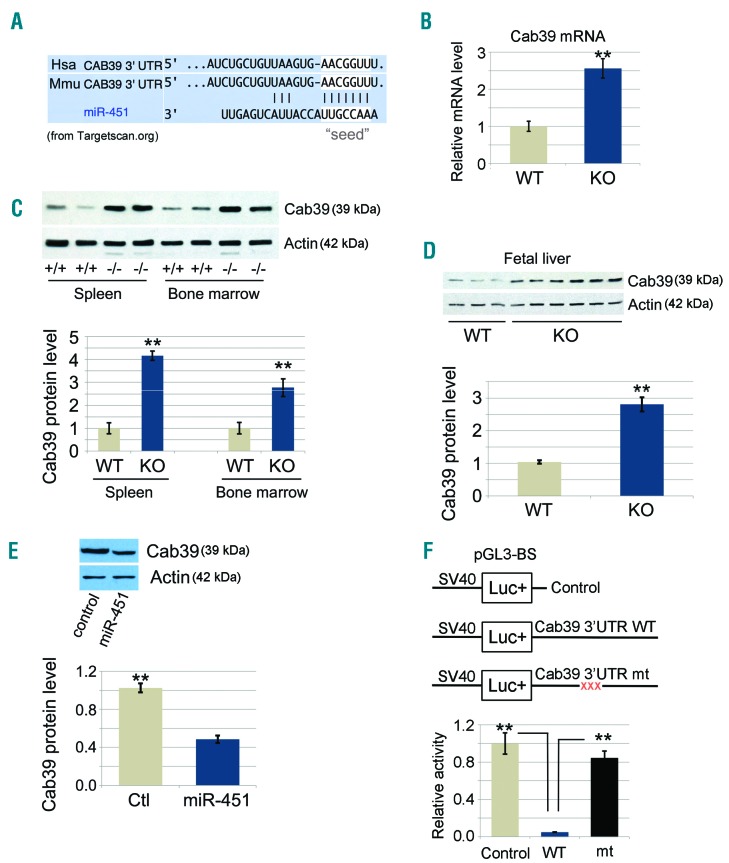
Several mRNAs previously identified as miR-451 target mRNAs, including Myc, Ywhaz/14-3-3ζ, and Cab39 (Figure 4A), encode general regulators of cell survival, proliferation, and maturation.13,15,21 Cab39 is an obligatory co-factor for the serine/threonine kinase LKB1, a tumor suppressor that regulates responses to metabolic stress, in part by activating AMP-activated protein kinase (AMPK).22 miR-451 drives human glioma cell expansion by inhibiting this pathway via direct repression of Cab39.21 Therefore, we investigated whether miR-451 repression of Cab39 regulates erythroblast survival during erythropoietic stress. Compared to controls, Cab39 mRNA and protein were up-regulated in miR-144/451−/− erythroblasts in spleen, bone marrow (Figure 4B and C) and FL (Figure 4D) compared to WT erythroblasts in the same tissues. Retroviral vector-mediated expression of miR-451 in the erythroid cell line G1E17 reduced Cab39 protein by approximately 50% (Figure 4E). The seed sequence of miR-451 is complementary to a conserved sequence within the 3′ untranslated region (UTR) of human and mouse Cab39 mRNA (Figure 4A). To verify whether miR-451 inhibited Cab39 mRNA expression via direct interaction with this region, we fused the 3′-UTR of Cab39 mRNA to the coding sequence of luciferase cDNA (Figure 4F). In 293T cells, luciferase reporter activity was inhibited approximately 200-fold after co-expression of miR-451. Mutations in the Cab39 mRNA 3′ UTR that disrupt complementarity to the miR-451 seed sequence abrogated repression of reporter activity. Together, these findings verify that miR-451 inhibits Cab39 mRNA expression directly and that this interaction occurs during erythropoiesis.
Figure 4.
miR-451 targets Cab39 mRNA in erythroblasts. (A) Nucleotide sequence alignments showing partial complementarity between the mouse and human 3′-UTRs of Cab39 mRNAs and miR-451. The miR-451 seed-sequence recognition sites in the mRNAs are boxed in white. (B) Fold change in the Cab39 mRNA level from quantitative RT-PCR analysis. Ter119+ nucleated cells were sorted from bone marrow, and a microarray was performed using an Affymetrix GeneChip.15 N=3 mice were used. **P<0.01 (t-test). (C) Cab39 protein levels in both spleen and bone marrow miR-144/451−/− erythroblasts were increased relative to those in wild-type (+/+, WT) controls (top). Ter119+ cells were purified from bone marrow, and whole-cell lysates were analyzed via Western blots with the Cab39 antibody. Representative results for 2 mice of each genotype are shown. (Bottom) Quantitative image analysis from multiple experiments. (D) Cab39 protein levels in miR-144/451−/− fetal liver (FL) erythroblasts were increased relative to those in WT controls (top). (Bottom) Quantitative image analysis for 3 WT and 6 miR-144/451−/− (KO) FLs. (E) G1E proerythroblast cells were transduced with retrovirus encoding miR-451 or empty vector as control. Transduced cells were selected with puromycin and analyzed for Cab39 via Western blots. (Top) Results of a representative experiment and (Bottom) of a quantitative analysis of the Western blot signal intensity from 3 independent experiments. **P<0.01 (t-test). (F) Interaction between miR-451 and the Cab39 3′-UTR inhibits the expression of a linked reporter gene. Firefly luciferase cDNA was fused to the normal 3′-UTR of Cab39 cDNA or a mutant version (mt) containing a 3-bp mutation within the region complementary to the miR-451 seed sequence. The reporter constructs were cloned into an expression vector and transfected into 293T cells, along with an miR-451 expression construct and a constitutively active Renilla luciferase control plasmid. Luciferase activities were determined 24 hours post transfection. (Bottom) Bars represent the Firefly/Renilla luciferase activity; levels from the reporter vector lacking the Cab39 3′-UTR were assigned an arbitrary value of 1. Results are given as the average of 3 separate experiments. **P<0.01 (t-test). Hsa: human; Mmu: mouse.
Activation of the Cab39/AMPK/mTOR pathway in miR-144/451−/− erythroblasts
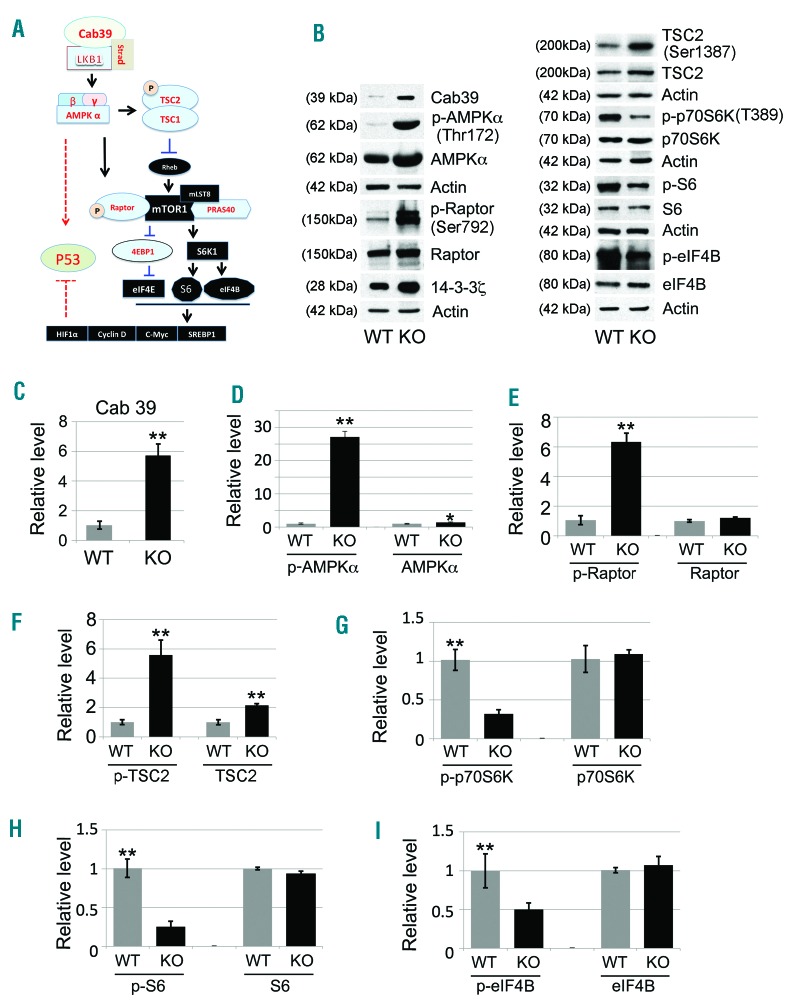
Cab39 binds LKB1 and STRAD to activate AMPK by phosphorylating the protein at Thr172 (Figure 5A).22,23 Of note, LKB1 and AMPK mRNAs are up-regulated during normal mouse and human erythroid maturation (Online Supplementary Figure S2A-E).19,24 Cab39 was up-regulated in cultured miR-144/451−/− FL erythroblasts compared to controls (Figures 4D and 5B and C). These cells also exhibited strongly increased phosphorylation of AMPK at Thr172, and to a lesser extent, upregulation of total AMPK protein (Figure 5B and D). AMPK can inhibit the mTOR pathway to inhibit cell growth and either induce or suppress apoptosis, depending on cellular context.25 To investigate this mechanism in miR-144/451−/− erythroblasts, we performed Western blot studies to interrogate upstream and downstream effectors.26,27 miR-144/451−/− FL erythroblasts grown in culture exhibited elevated phospho-Raptor and phos-pho-TSC2, along with reduced phosphorylation of p70S6K, S6, and eIF4B (Figure 5B and E–I), consistent with suppression of the mTOR by activated AMPK (Figure 5A). We observed similar patterns in primary erythroblasts from E14.5 FLs (Online Supplementary Figure S3). Together, these findings indicate that the loss of miR-144/451 during FL erythropoiesis derepresses the miR-451 target Cab39, resulting in mTOR repression.
Figure 5.
Activation of the Cab39/AMPK/mTOR pathway in miR-144/451−/− erythroblasts. (A) Schematic illustration of the major signaling components in the Cab39/AMPK/mTOR molecular pathway. Cab39 expression leads to increased LKB1 activity in the Cab39/LKB1/STRAD protein complex, which activates its substrate AMPK. AMPK activation is vital for modulation of the mTOR signaling cascade and for potential stabilization of p53 activity, which subsequently governs the fate of the target cells, including their apoptosis, survival, and/or proliferation. (B) Western blot analysis of the expression of Cab39, p-AMPKα, p-Raptor, p-TSC2, p-p70S6K, p-S6, and p-eIF4B, along with their non-phosphorylated counterparts, in fetal liver (FL) erythroblasts grown in maturation medium for 24 hours, when all the cells were nucleated erythroblasts. 14-3-3ζ was used as a positive control, and actin was used as a sample loading control. Quantitative analyses of the protein intensity are shown in (C-I) as follows: (C) Cab39, (D) p-AMPKα/AMPKα, (E) p-Raptor/Raptor, (F) p-TSC2/TSC2, (G) p-p70S6K/p70S6K, (H) p-S6/S6, and (I) p-eIF4B/eIF4B. Signals were normalized to actin. Data are the mean values from 3 separate experiments. *P<0.05; **P<0.01 (t-test).
Attenuation of Cab39/AMPK/mTOR signaling rescues erythroid apoptosis after miR-144/451 depletion
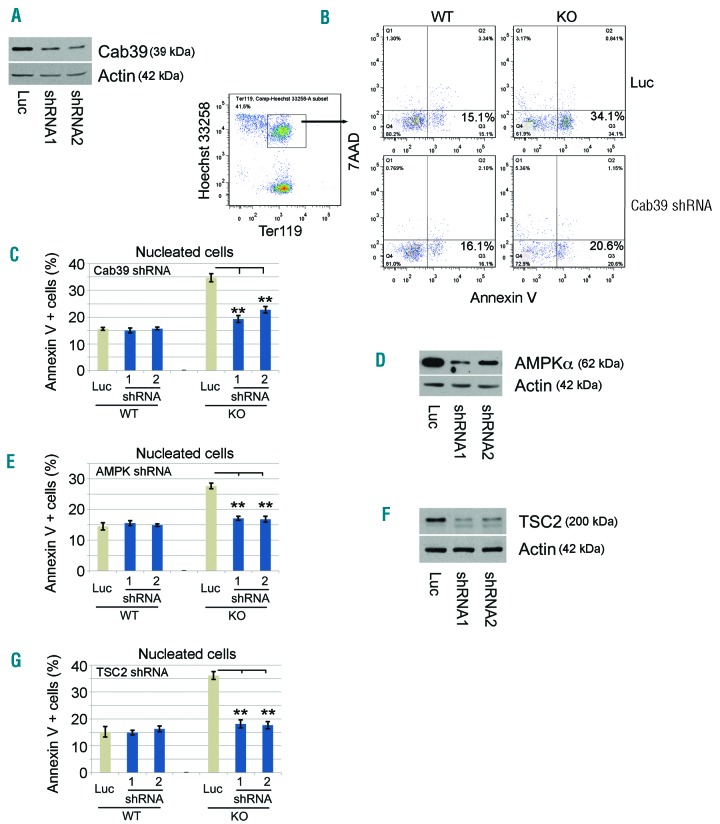
To determine whether miR-144/451 regulates survival of FL erythroblasts via Cab39/AMPK/mTOR, we designed shRNA-expressing retroviruses to knock down components of this pathway. We grew FL erythroblasts in expansion medium, infected them with individual shRNA retroviruses, induced erythroid maturation for 24 h, and then examined apoptosis in the cells. Inhibiting Cab39 expression in miR-144/451−/− erythroblasts by approximately 55-70% with 2 different shRNAs reduced apoptosis by approximately 45% (Figure 6A–C). In contrast, no significant change in apoptosis of WT erythroblasts occurred after shRNA suppression of Cab39 (Figure 6B and C). Similarly, shRNA inhibition of AMPKα and TSC2 inhibited apoptosis of miR-144/451−/− erythroblasts but not WT controls (Figure 6D–G).
Figure 6.
Attenuation of Cab39/AMPK/mTOR signaling rescues erythroid apoptosis after miR-144/451 depletion. (A) shRNA suppression of Cab39 in miR-144/451−/− erythroblasts as shown by Western blot. (B) Apoptosis was measured by flow cytometry, using Annexin V as an indicator. Cab39 shRNA-expressing nucleated erythroblasts were indicated as Ter119+Hoechst+ cells. (C) The apoptotic index in nucleated erythroid cells after knockdown of Cab39. Luciferase (luc) shRNA was used as a negative knockdown control. **P<0.01 (t-test). N=5 fetal liver (FL) erythroblasts of each genotype were used. (D) shRNA suppression of AMPKα in miR-144/451−/− erythroblasts, as shown by Western blot. (E) The percentage of apoptotic nucleated erythroblasts after knockdown of AMPKα. **P<0.01 (t-test). N=4 FLs of each genotype were used. (F) shRNA suppression of TSC2 in miR-144/451−/− erythroblasts, as shown by Western blot. (G) The apoptotic rates of nucleated erythroblasts after knockdown of TSC2. **P<0.01 (t-test). N=4 FLs of each genotype were used.
To further examine the effects of AMPK/mTOR signaling during WT and miR-144/451−/− FL erythropoiesis, we used drugs to manipulate the pathway. Consistent with the results of shRNA studies, the AMPK inhibitor Compound C (CC) reduced apoptosis significantly in miR-144/451−/−, but not WT erythroblasts (Online Supplementary Figure S4A and B). Conversely, inhibiting mTOR activity with rapamycin or activating AMPK with AICAR induced apoptosis in WT erythroblasts (Online Supplementary Figure S4C-F). Overall, our results with shRNAs and pharmacological inhibitors indicate that miR-451 facilitates fetal erythroblast survival by inhibiting expression of Cab39, resulting in suppression of LKB1 and AMPK and activation of the downstream mTOR pathway.
The increased apoptosis of miR-144/451−/− erythroblasts is p53-dependent
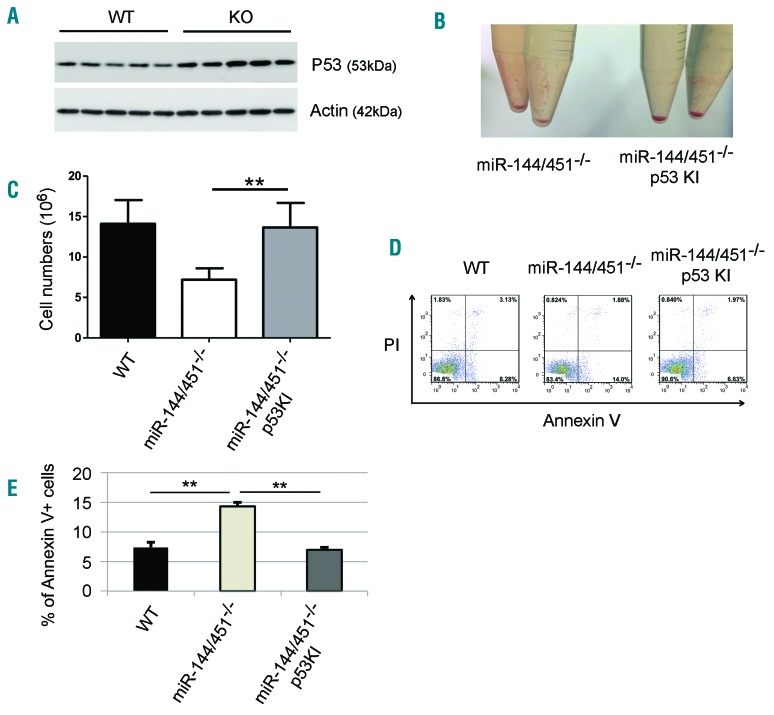
Depending on cell context, mTOR can regulate p53 positively or negatively to alter rates of apoptosis.28–30 Thus, we investigated p53 levels and effector functions in miR-144/451−/− erythroblasts that exhibit reduced mTOR activity. p53 level was increased in miR-144/451−/− E14.5 FL erythroblasts (Figure 7A). To investigate the functional implications of this finding, we crossed miR-144/451−/− mice with “p53 knock-in (KI)” mice, in which both alleles of the normal p53 gene are replaced by a cDNA encoding a 4-hydroxytamoxifen (4-OHT)-dependent form of the fusion protein, p53-estrogen receptor.16,31 There is a lack of endogenous p53 activity in the p53 KI mice unless 4-OHT is applied. In the absence of 4-OHT, loss of p53 function rescued the deficient erythroblast numbers in E14.5 FL from miR-144/451−/− mice (Figure 7B and C). Moreover, apoptosis of E14.5 miR-144/451−/− FL erythroblasts was significantly reduced in the absence of p53 activity (Figure 7D and E). Together, these results demonstrate that increased apoptosis of miR-144/451−/− erythroblasts is p53-dependent.
Figure 7.
The increased apoptosis of miR-144/451−/− erythroblasts is p53-dependent. (A) Western blot showing the protein levels of the tumor suppressor p53 in wild-type (WT) and miR-144/451−/− (KO) E14.5 fetal liver (FL) cells. Lineage negative-selected WT and KO E14.5 FL cells were grown in culture in erythroid maturation medium, and cells were harvested for Western blot analysis for p53 after 24 hours in culture. Actin was used as the loading control. (B) Gross view of the cell pellets from miR-144/451−/− and miR-144/451−/−/p53 knock-in (KI) double-mutant E14.5 FLs. (C) Total erythroblast number for whole E14.5 FLs from miR-144/451−/− and miR-144/451−/−/p53 KI double-mutant mice. miR-144/451−/− mice were crossed with p53-deficient KI mice.16,31 N=3 WT mice, n=6 KO mice, and n=6 double-mutant mice were used. **P<0.01 (t-test). (D) Flow cytometric analysis of apoptosis for miR-144/451−/− and miR-144/451−/−/p53 KI double-mutant E14.5 FL cells. WT FLs were used as controls. PI−Annexin V+ labeling was taken to indicate early apoptotic cells. (E) Quantitative analysis of flow cytometric data from (D).
Discussion
Although the biological functions of miR-144/451 have been studied extensively, few studies have been performed in animal models. Moreover, less is known about the miR-144/451-regulated molecular pathways underlying the phenotypes observed after miR-144/451 depletion. Our results provide further explanation, in addition to that of elevated oxidative stress caused by aberrant 14-3-3ζ accumulation and consequent FoxO3 sequestration, for the defective erythropoiesis and hemolytic anemia seen in miR-144/451−/− mice.13,15 Upon various erythropoietic stresses, miR-144/451 depletion up-regulated expression of the miR-451 target Cab39 with consequent activation of the AMPK/mTOR pathway, leading to increased erythroid apoptosis. Manipulating both AMPK and mTOR activities altered the apoptotic rate in miR-144/451−/− erythroblasts. In contrast, reduced miR-451 levels in glioma cells as an adaptation to metabolic stress derepress Cab39 to activate the LKB1/AMPK/mTOR pathway and enhance survival.21 Thus, miR-451 may employ a common pathway to regulate stress responses in different cell types, but the net effects are context-dependent. During erythropoiesis, mTOR activity is relatively high, and the pathway appears to exert a positive effect on precursor expansion and protection against erythropoietic stress,32 consistent with the current study.
Contrasting effects of AMPK activity on apoptosis have been observed during various cellular stresses.25 In some cases, AMPK functions to balance cellular redox state and promote survival during metabolic or genotoxic stress.33,34 In other cases, AMPK activation during stress causes increased apoptosis.35,36 In this study, we showed that in miR-144/451−/− erythroblasts, AMPK is activated by overexpressed Cab39 and promotes apoptosis by inhibiting mTOR activity. It is unclear how levels of stress affect the regulatory role of AMPK in apoptosis, i.e. does AMPK favor cell survival under mild stress but enhance apoptosis under severe stress?
In this study, we found that loss of miR-144/451 induces apoptosis in a p53-dependent fashion. Some evidence from a study in Diamond-Blackfan anemia (DBA) has shown that haploinsufficiency of ribosomal protein subunits can induce erythroblast apoptosis via p53-dependent mechanisms.37 Stabilization of p53 by the MDM2 antagonist SAR405838 induces major hematopoietic defects including erythroid precursor apoptosis in vitro.38 How p53 is activated after miR-144/451 depletion remains to be elucidated. In some cell types, AMPK induces apoptosis by activating p53 through phosphorylation,34,35 whereas others have reported that p53 activates AMPK/mTOR signaling to suppress cell growth by targeting sestrin 1 and sestrin 2 upon stress.39 In addition, several groups report an inhibitory role of mTOR activity on p53 function.28,29 It is possible that a positive feedback loop involving AMPK, p53, and mTOR signaling regulates apoptosis of miR-144/451−/− erythroid cells under stress conditions, although further investigations are required to fully define the process.
Anemia is a common complication after orthotopic kidney transplantation due to multifactorial effects including iron deficiency, reduced erythropoietin production, and chronic or acute inflammation. Additionally, mTOR inhibition by sirolimus is a possible risk factor for the development of anemia in kidney transplant recipients.40,41 There is also a substantial risk of anemia from the mTOR inhibitor everolimus in cancer therapy.42 Interestingly, studies in animal models and cell cultures demonstrate that treatment with mTOR inhibitors reduces RBC size, independent of alterations in kidney function.32,43 Consistent with this finding, miR-144/451−/− mice exhibit microcytic anemia,15 perhaps due to mTOR inhibition. Moreover, the current study shows that these mice exhibit enhanced erythroblast apoptosis with various erythropoietic stresses including developmental expansion of FL, hemolysis, acute blood loss, and precursor depletion by 5-FU, a chemotherapeutic drug. Accelerated apoptosis in the absence of miR-144/451 is caused by overexpression of the miR-451 target Cab39, which activates AMPK, thus inhibiting mTOR signaling. Therefore, our data explain why erythroid apoptosis is an underlying mechanism of profound anemia when the enzymatic activity of Cab39/LKB1/AMPK is significantly increased and mTOR signaling is perturbed.
A mechanistic understanding of the differences between steady state and stress erythropoiesis could be of benefit in multiple clinical settings.44 Moreover, these processes are likely to be impacted differently by various disease states. Common causes of acquired anemia include dietary iron deficiency, malaria, chronic infectious diseases, autoimmune or rheumatological disorders, chemotherapy, and chronic kidney disease. Genetic causes of anemia include DBA and hemoglobinopathies such as sickle cell disease (SCD) and thalassemia.45 Of note, while numerous studies, including the current one, reveal a positive effect of mTOR on erythropoiesis, other studies show that mTOR inhibition may have beneficial effects in some forms of anemia including SCD and thalassemia,46,47 again emphasizing context- or disease-dependent functions for this pathway. Our mouse model makes it possible to investigate further the roles of miR-144/451, including its effects on mTOR, in physiological adaptations to various red cell disorders.
miR-144/451 is a bicistronic gene whose expression is directly controlled by GATA1 in erythroid cells.10,15 Interestingly, our research and that of others had previously observed that: 1) miR-144 level is always lower than miR-451 level in both fetal and adult erythroid cells;10,14 and 2) the expression of miR-144 is ubiquitous whereas the expression of miR-451 is much more constrained in hematopoietic compartments during embryonic development.48,49 These data suggest that overlapping and independent mechanisms regulate the differential expression of miR-144 and miR-451. The current study focuses on an miR-451-dependent mechanism for regulating stress erythropoiesis. However, it is not clear whether miR-144 impacts this process. Of note, suppression of miR-144 inhibits erythropoiesis in cultured human CD34+ cells.50 In future studies, it will be interesting to investigate the effects of miR-144 and miR-451 on erythropoiesis separately by examining mice that harbor single miR-specific mutations.
Supplementary Material
Acknowledgments
The authors would like to thank Keith Laycock (St. Jude Children’s Research Hospital) and Yuanjun Yu for language editing.
Footnotes
Check the online version for the most updated information on this article, online supplements, and information on authorship & disclosures: www.haematologica.org/content/103/3/406
Funding
This work is supported by the National Natural Science Foundation of China (grant n. 81470277 to DY), a grant from the Ministry of Finance of China for the “Biology & Medical Science Innovation Team” program (to DY), and the Priority Academic Program Development of Jiangsu Higher Education Institution (Veterinary Medicine) (to DY) and R01 DK092318 (to MW). XF is also supported by the National Natural Science Foundation of China (grant n. 81402484), the Jiangsu Provincial Natural Science Foundation (grant n. BK20140497) and Natural Science Fund for Colleges and Universities in Jiangsu Province (grant n. 14KJB310024).
References
- 1.Hosokawa K, Muranski P, Feng X, et al. Identification of novel microRNA signatures linked to acquired aplastic anemia. Haematologica. 2015;100(12):1534–1545. [DOI] [PMC free article] [PubMed] [Google Scholar]
- 2.Mendell JT, Olson EN. MicroRNAs in stress signaling and human disease. Cell. 2012;148(6):1172–1187. [DOI] [PMC free article] [PubMed] [Google Scholar]
- 3.Hattangadi SM, Wong P, Zhang L, Flygare J, Lodish HF. From stem cell to red cell: regulation of erythropoiesis at multiple levels by multiple proteins, RNAs, and chromatin modifications. Blood. 2011;118(24):6258–6268. [DOI] [PMC free article] [PubMed] [Google Scholar]
- 4.Huang X, Gschweng E, Van Handel B, Cheng D, Mikkola HK, Witte ON. Regulated expression of microRNAs-126/126* inhibits erythropoiesis from human embryonic stem cells. Blood. 2011;117(7):2157–2165. [DOI] [PMC free article] [PubMed] [Google Scholar]
- 5.Wang F, Zhu Y, Guo L, et al. A regulatory circuit comprising GATA1/2 switch and microRNA-27a/24 promotes erythropoiesis. Nucleic Acids Res. 2014;42(1):442–457. [DOI] [PMC free article] [PubMed] [Google Scholar]
- 6.Zhai PF, Wang F, Su R, et al. The regulatory roles of microRNA-146b-5p and its target platelet-derived growth factor receptor α (PDGFRA) in erythropoiesis and megakaryocytopoiesis. J Biol Chem. 2014;289(33):22600–22613. [DOI] [PMC free article] [PubMed] [Google Scholar]
- 7.Fu YF, Du TT, Dong M, et al. Mir-144 selectively regulates embryonic α-hemoglobin synthesis during primitive erythropoiesis. Blood. 2008;113(6):1340–1349. [DOI] [PubMed] [Google Scholar]
- 8.Pase L, Layton JE, Kloosterman WP, Carradice D, Waterhouse PM, Lieschke GJ. miR-451 regulates zebrafish erythroid maturation in vivo via its target gata2. Blood. 2009;113(8):1794–1804. [DOI] [PMC free article] [PubMed] [Google Scholar]
- 9.Zhan M, Miller CP, Papayannopoulou T, Stamatoyannopoulos G, Song CZ. MicroRNA expression dynamics during murine and human erythroid differentiation. Exp Hematol. 2007;35(7):1015–1025. [DOI] [PMC free article] [PubMed] [Google Scholar]
- 10.Dore LC, Amigo JD, Dos Santos CO, et al. A GATA-1-regulated microRNA locus essential for erythropoiesis. Proc Natl Acad Sci USA. 2008;105(9):3333–3338. [DOI] [PMC free article] [PubMed] [Google Scholar]
- 11.Zhang L, Flygare J, Wong P, Lim B, Lodish HF. miR-191 regulates mouse erythroblast enucleation by down-regulating Riok3 and Mxi1. Genes Dev. 2011;25(2):119–124. [DOI] [PMC free article] [PubMed] [Google Scholar]
- 12.Yang JS, Maurin T, Robine N, et al. Conserved vertebrate mir-451 provides a platform for Dicer-independent, Ago2-mediated microRNA biogenesis. Proc Natl Acad Sci USA. 2010;107(34):15163–15168. [DOI] [PMC free article] [PubMed] [Google Scholar]
- 13.Patrick DM, Zhang CC, Tao Y, et al. Defective erythroid differentiation in miR-451 mutant mice mediated by 14-3-3zeta. Genes Dev. 2010;24(15):1614–1619. [DOI] [PMC free article] [PubMed] [Google Scholar]
- 14.Rasmussen KD, Simmini S, Abreu-Goodger C, et al. The miR-144/451 locus is required for erythroid homeostasis. J Exp Med. 2010;207(7):1351–1358. [DOI] [PMC free article] [PubMed] [Google Scholar]
- 15.Yu D, dos Santos CO, Zhao G, et al. miR-451 protects against erythroid oxidant stress by repressing 14-3-3ζ. Genes Dev. 2010;24(15):1620–1633. [DOI] [PMC free article] [PubMed] [Google Scholar]
- 16.Yu D, Carroll M, Thomas-Tikhonenko A. p53 status dictates responses of B lymphomas to monotherapy with proteasome inhibitors. Blood. 2007;109(11):4936–4943. [DOI] [PMC free article] [PubMed] [Google Scholar]
- 17.Gregory T, Yu C, Ma A, Orkin SH, Blobel GA, Weiss MJ. GATA-1 and erythropoietin cooperate to promote erythroid cell survival by regulating bcl-xL expression. Blood. 1999;94(1):87–96. [PubMed] [Google Scholar]
- 18.Khandros E, Thom CS, D’Souza J, Weiss MJ. Integrated protein quality-control pathways regulate free α-globin in murine β-thalassemia. Blood. 2012;119(22):5265–5275. [DOI] [PMC free article] [PubMed] [Google Scholar]
- 19.Cheng Y, Wu W, Kumar SA, et al. Erythroid GATA1 function revealed by genome-wide analysis of transcription factor occupancy, histone modifications, and mRNA expression. Genome Res. 2009;19(12):2172–2184. [DOI] [PMC free article] [PubMed] [Google Scholar]
- 20.Palis J, Segel GB. Developmental biology of erythropoiesis. Blood Rev. 1998;12(2):106–114. [DOI] [PubMed] [Google Scholar]
- 21.Godlewski J, Nowicki MO, Bronisz A, et al. MicroRNA-451 regulates LKB1/AMPK signaling and allows adaptation to metabolic stress in glioma cells. Mol Cell. 2010;37(5):620–632. [DOI] [PMC free article] [PubMed] [Google Scholar]
- 22.Shackelford DB, Shaw RJ. The LKB1-AMPK pathway: metabolism and growth control in tumour suppression. Nat Rev Cancer. 2009;9(8):563–575. [DOI] [PMC free article] [PubMed] [Google Scholar]
- 23.Hawley SA, Boudeau J, Reid JL, et al. Complexes between the LKB1 tumor suppressor, STRAD α/β and MO25 α/β are upstream kinases in the AMP-activated protein kinase cascade. J Biol. 2003;2(4):28. [DOI] [PMC free article] [PubMed] [Google Scholar]
- 24.An X, Schulz VP, Li J, et al. Global transcriptome analyses of human and murine terminal erythroid differentiation. Blood. 2014;123(22):3466–3477. [DOI] [PMC free article] [PubMed] [Google Scholar]
- 25.Dasgupta B, Chhipa RR. Evolving lessons on the complex role of AMPK in normal physiology and cancer. Trends Pharmacol Sci. 2016;37(3):192–206. [DOI] [PMC free article] [PubMed] [Google Scholar]
- 26.Ginion A, Auquier J, Benton CR, et al. Inhibition of the mTOR/p70S6K pathway is not involved in the insulin-sensitizing effect of AMPK on cardiac glucose uptake. Am J Physiol Heart Circ Physiol. 2011;301(2):H469–H477. [DOI] [PubMed] [Google Scholar]
- 27.Laplante M, Sabatini DM. mTOR signaling in growth control and disease. Cell. 2012;149(2):274–293. [DOI] [PMC free article] [PubMed] [Google Scholar]
- 28.Kwon S, Jeon JS, Ahn C, Sung JS, Choi I. Rapamycin regulates the proliferation of Huh7, a hepatocellular carcinoma cell line, by up-regulating p53 expression. Biochem Biophys Res Commun. 2016;479(1):74–79. [DOI] [PubMed] [Google Scholar]
- 29.Lee JY, Nakada D, Yilmaz OH, et al. mTOR activation induces tumor suppressors that inhibit leukemogenesis and deplete hematopoietic stem cells after Pten deletion. Cell Stem Cell. 2010;7(5):593–605. [DOI] [PMC free article] [PubMed] [Google Scholar]
- 30.Wang C, Gao D, Guo K, et al. Novel synergistic antitumor effects of rapamycin with bortezomib on hepatocellular carcinoma cells and orthotopic tumor model. BMC Cancer. 2012;12:166. [DOI] [PMC free article] [PubMed] [Google Scholar]
- 31.Christophorou MA, Martin-Zanca D, Soucek L, et al. Temporal dissection of p53 function in vitro and in vivo. Nat Genet. 2005;37(7):718–726. [DOI] [PubMed] [Google Scholar]
- 32.Knight ZA, Schmidt SF, Birsoy K, Tan K, Friedman JM. A critical role for mTORC1 in erythropoiesis and anemia. Elife. 2014;3:e01913. [DOI] [PMC free article] [PubMed] [Google Scholar]
- 33.Jeon SM, Chandel NS, Hay N. AMPK regulates NADPH homeostasis to promote tumour cell survival during energy stress. Nature. 2012;485(7400):661–665. [DOI] [PMC free article] [PubMed] [Google Scholar]
- 34.Jones RG, Plas DR, Kubek S, et al. AMP-activated protein kinase induces a p53-dependent metabolic checkpoint. Mol Cell. 2005;18(3):283–293. [DOI] [PubMed] [Google Scholar]
- 35.Okoshi R, Ozaki T, Yamamoto H, et al. Activation of AMP-activated protein kinase induces p53-dependent apoptotic cell death in response to energetic stress. J Biol Chem. 2008;283(7):3979–3987. [DOI] [PubMed] [Google Scholar]
- 36.Tzatsos A, Tsichlis PN. Energy depletion inhibits phosphatidylinositol 3-kinase/Akt signaling and induces apoptosis via AMP-activated protein kinase-dependent phosphorylation of IRS-1 at Ser-794. J Biol Chem. 2007;282(25):18069–18082. [DOI] [PubMed] [Google Scholar]
- 37.Chakraborty A, Uechi T, Kenmochi N. Guarding the ‘translation apparatus’: defective ribosome biogenesis and the p53 signaling pathway. Wiley Interdiscip Rev RNA. 2011;2(4):507–522. [DOI] [PubMed] [Google Scholar]
- 38.Mahfoudhi E, Lordier L, Marty C, et al. P53 activation inhibits all types of hematopoietic progenitors and all stages of megakaryopoiesis. Oncotarget. 2016;7(22):31980–31992. [DOI] [PMC free article] [PubMed] [Google Scholar]
- 39.Budanov AV, Karin M. p53 target genes ses-trin1 and sestrin2 connect genotoxic stress and mTOR signaling. Cell. 2008;134(3):451–460. [DOI] [PMC free article] [PubMed] [Google Scholar]
- 40.Augustine JJ, Knauss TC, Schulak JA, Bodziak KA, Siegel C, Hricik DE. Comparative effects of sirolimus and mycophenolate mofetil on erythropoiesis in kidney transplant patients. Am J Transplant. 2004;4(12):2001–2006. [DOI] [PubMed] [Google Scholar]
- 41.Ekberg H, Bernasconi C, Nöldeke J, et al. Cyclosporine, tacrolimus and sirolimus retain their distinct toxicity profiles despite low doses in the Symphony study. Nephrol Dial Transplant. 2010;25(6):2004–2010. [DOI] [PubMed] [Google Scholar]
- 42.Shameem R, Hamid MS, Wu S. Risk of anemia attributable to everolimus in patients with cancer: a meta-analysis of randomized controlled trials. Anticancer Res. 2015;35(4):2333–2340. [PubMed] [Google Scholar]
- 43.Diekmann F, Rovira J, Diaz-Ricart M, et al. mTOR inhibition and erythropoiesis: microcytosis or anaemia? Nephrol Dial Transplant. 2012;27(2):537–541. [DOI] [PubMed] [Google Scholar]
- 44.Socolovsky M. Molecular insights into stress erythropoiesis. Curr Opin Hematol. 2007;14(3):215–224. [DOI] [PubMed] [Google Scholar]
- 45.Sankaran VG, Weiss MJ. Anemia: progress in molecular mechanisms and therapies. Nat Med. 2015;21(3):221–230. [DOI] [PMC free article] [PubMed] [Google Scholar]
- 46.Zhang X, Camprecios G, Rimmele P, et al. FOXO3-mTOR metabolic cooperation in the regulation of erythroid cell maturation and homeostasis. Am J Hematol. 2014;89(10):954–963. [DOI] [PMC free article] [PubMed] [Google Scholar]
- 47.Green RJ, Herget M. Outcomes of systemic/strategic team consultation: I. Overview and one-month results. Fam Process. 1989;28(1):37–58. [DOI] [PubMed] [Google Scholar]
- 48.Kloosterman WP, Wienholds E, de Bruijn E, Kauppinen S, Plasterk RH. In situ detection of miRNAs in animal embryos using LNA-modified oligonucleotide probes. Nat Methods. 2006;3(1):27–29. [DOI] [PubMed] [Google Scholar]
- 49.Diez-Roux G, Banfi S, Sultan M, et al. A high-resolution anatomical atlas of the transcriptome in the mouse embryo. PLoS Biol. 2011;9(1):e1000582. [DOI] [PMC free article] [PubMed] [Google Scholar]
- 50.Kim M, Tan YS, Cheng WC, Kingsbury TJ, Heimfeld S, Civin CI. MIR144 and MIR451 regulate human erythropoiesis via RAB14. Br J Haematol. 2015;168(4):583–597. [DOI] [PMC free article] [PubMed] [Google Scholar]
Associated Data
This section collects any data citations, data availability statements, or supplementary materials included in this article.


