Abstract
Primary therapy resistance is a major problem in acute myeloid leukemia treatment. We set out to develop a powerful and robust predictor for therapy resistance for intensively treated adult patients. We used two large gene expression data sets (n=856) to develop a predictor of therapy resistance, which was validated in an independent cohort analyzed by RNA sequencing (n=250). In addition to gene expression markers, standard clinical and laboratory variables as well as the mutation status of 68 genes were considered during construction of the model. The final predictor (PS29MRC) consisted of 29 gene expression markers and a cytogenetic risk classification. A continuous predictor is calculated as a weighted linear sum of the individual variables. In addition, a cut off was defined to divide patients into a high-risk and a low-risk group for resistant disease. PS29MRC was highly significant in the validation set, both as a continuous score (OR=2.39, P=8.63·10−9, AUC=0.76) and as a dichotomous classifier (OR=8.03, P=4.29·10−9); accuracy was 77%. In multivariable models, only TP53 mutation, age and PS29MRC (continuous: OR=1.75, P=0.0011; dichotomous: OR=4.44, P=0.00021) were left as significant variables. PS29MRC dominated all models when compared with currently used predictors, and also predicted overall survival independently of established markers. When integrated into the European LeukemiaNet (ELN) 2017 genetic risk stratification, four groups (median survival of 8, 18, 41 months, and not reached) could be defined (P=4.01·10−10). PS29MRC will make it possible to design trials which stratify induction treatment according to the probability of response, and refines the ELN 2017 classification.
Introduction
Approximately 20–30% of younger adult patients with acute myeloid leukemia (AML) and up to 50% of older adults are refractory to induction treatment.1 There are several definitions of treatment failure due to resistant disease (RD) or primary refractory AML.1–5 One of the earliest consensus definitions classified RD as the persistence of leukemic blasts in either the peripheral blood or the bone marrow in a patient alive at least seven days following treatment, excluding patients with death in aplasia or death due to indeterminate cause.4 More recent recommendations define primary refractory disease as a failure to achieve complete remission (CR) or CR with incomplete hematologic regeneration (CRi) after two courses of induction treatment.2 Regardless of the definition, RD is associated with extremely poor survival. Patients with RD can currently not be identified with high specificity before the start of treatment and therapeutic resistance remains one of the main problems in AML therapy.3
It is difficult to quantify predictive ability. Usually, area under receiver-operating characteristic curve (AUC) is used to describe predictive ability, where a value of 1 indicates perfect prediction and 0.5 indicates no prediction.3,6 AUC values of 0.6–0.7, 0.7–0.8 and 0.8–0.9 are considered as poor, fair and good, respectively.3,6 An AUC of more than 0.9 would be desirable.
Several tools have been developed to predict therapeutic response in AML. The AML-score by Krug et al., based on standard clinical and laboratory variables including genetics, was developed to predict CR or early death of older patients (≥60 years) treated with intensive chemotherapy.7 The score reached a “poor” prognostic ability of AUC=0.68 in the validation set.7 A study using comparable variables to identify RD analyzing 4601 patients of all age groups from the MRC/NCRI, HOVON/SAKK, SWOG and MD Anderson Cancer Center achieved an AUC prediction of AUC=0.78 by bootstrap adjusted validation in the training sets.3 The inclusion of extensive genetic testing data from the initial diagnostic workup in this classifier was not able to significantly improve the ability to predict primary resistance to treatment in younger patients.6,8 These ‘maximal’ models yielded AUCs of 0.77–0.80 but were not validated in independent data sets.6
We hypothesized that we could improve the prediction of RD by combining standard clinical and laboratory variables, mutation data and gene expression data of large homogeneously treated patient cohorts to design a new classifier.
Methods
Patients
In this study, we used three independent data sets, hereafter referred to as training set 1, 2 and validation set. All patients included in the analysis received cytarabine- and anthracycline-based induction treatment. All patients included in the German AML Cooperative Group (AMLCG) trials were scheduled to receive at least one high-dose cytarabine-containing course as part of their double induction treatment before they were considered resistant.
Training set 1 consisted of 407 patients randomized and treated in the multicenter phase III AMLCG-1999 trial (clinicaltrials.gov identifier 00266136) between 1999 and 2005.9,10 The patients are part of a previously published gene expression data set (GSE37642) and samples were analyzed on Affymetrix arrays.11,12 Patient selection was based on the availability of information on response to induction treatment. All patients with a t(15;17), myelodysplastic syndrome (MDS), or an overall survival (OS) of less than 16 days were excluded.
Training set 2 consisted of samples from 462 AML patients treated in various trials of the Haemato-Oncology Foundation for Adults in the Netherlands (HOVON). These samples were analyzed by Affymetrix arrays and clinical and gene expression data are publicly available (GSE14468).13,14 Thirteen patients had to be excluded due to early death (OS <16 days) or missing follow-up data.
Finally, the validation set consisted of all patients with available material treated in the AMLCG-2008 study (clinicaltrials.gov identifier 01382147), a randomized, multicenter phase III trial (n=210).15 These patients were analyzed by RNAseq. Because of the high response rate in the AMLCG-2008 trial (CR and CRi: 289 of 387, 75%) and the low rate of resistant patients (48 of 387, 12%), we decided to include an additional 40 patients with RD in the validation set to increase the statistical power; these patients were treated in the AMLG-1999 trial. We selected these patients by including all patients with RD of the AMLCG-1999 trial that were not part of training set 1 and who had sufficient material for analysis. Subsequently, only patients matching the control treatment arm of the AMLCG-2008 trial were selected for RNAseq and included in the validation set (n=40). Cytogenetic data were missing in 8 cases from the validation set (not done: n=3; no cells dividing: n=5); since cytogenetic information is required to calculate most risk scores, these patients were excluded from subsequent analysis. The gene expression data are publicly available through the Gene Expression Omnibus Web site (GSE106291).
Details regarding the treatment regimens are described in the Online Supplementary Appendix. A detailed flow chart describing the patient cohorts and selection process is shown in Online Supplementary Figure S1. All study protocols were in accordance with the Declaration of Helsinki and were approved by the institutional review boards of the participating centers. All patients provided written informed consent for inclusion on the clinical trial and in the genetic analyses.
Molecular workup
Cytogenetic analyses in the AMLCG trials were performed centrally, and risk groups were defined according to the 2010 UK Medical Research Council (MRC) and the European LeukemiaNet (ELN) 2017 genetic risk classification (ELN2017). Patients were characterized for NPM1 and CEBPA mutations, FLT3 internal tandem duplications (FLT3-ITD), and KMT2A (formerly MLL) partial tandem duplications (KMT2A-PTD) using standard methods described recently.16 Targeted amplicon sequencing of 68 recurrently mutated genes as published recently was used for genetic characterization in training set 1 and the validation set.17 RNAseq libraries were prepared using the Sense mRNA Seq Library Prep Kit V2 (Lexogen, n=238) and the TruSeq RNA Library Preparation V2 Kit (Illumina, n=12). Between 500–1000 ng total RNA [RNA integrity number (RIN) >7] were used as input material. All sequencing was paired end and performed using polyadenylated-selected and, in case of the Lexogen libraries, stranded RNA sequencing. Processing details and sequencing metrics are provided in the Online Supplementary Appendix. Samples were sequenced on a HiSeq 1500 instrument (Illumina) as 100 bp reads to a targeted depth of 20 million mappable paired reads per sample according to the “Standards, Guidelines and Best Practices for RNA-Seq v.1.0 (June 2011)”18 recommendations of the ENCODE Consortium. Samples were aligned with STAR 2.4.019 to the human hg19 reference genome and analyzed by DESeq2.20 Details regarding the workflow are provided in the Online Supplementary Appendix.
Development of the predictive classifier
The aim of the study was to develop a predictor that accurately identifies patients with RD. To achieve this goal, we used clinical markers, cytogenetics (defined according to the MRC), mutational analysis of 68 recurrently mutated genes in AML and gene expression markers to construct a predictive model. All gene expression variables were scaled to a mean value of 0 and variance equal to 1. After pre-selection of variables in training set 1 and 2, penalized logistic regression (Lasso) in training set 1 was used to develop a predictive classifier that was able to identify patients with RD. Details regarding the development of the classifier are given in the Online Supplementary Appendix and Online Supplementary Figure S2, or were published previously.21
The predictor was validated in a fully independent cohort of patients where gene expression was analyzed by a different method, namely RNA-Seq. The final predictor and cut off were developed before the validation data set became available.
Cut-off development
Our aim was to provide a meaningful cut off to guide clinical decision making. In the case of AML, this means that patients should not be excluded from induction chemotherapy unless there is a very high likelihood that it will be ineffective. Therefore, from the clinical perspective, a high specificity of the predictor is desirable. The cut off was, therefore, designed to have a specificity of 0.9 in training set 1. However, by adjusting the cut off to achieve high specificity, the sensitivity of the predictor decreases.
Statistical analysis
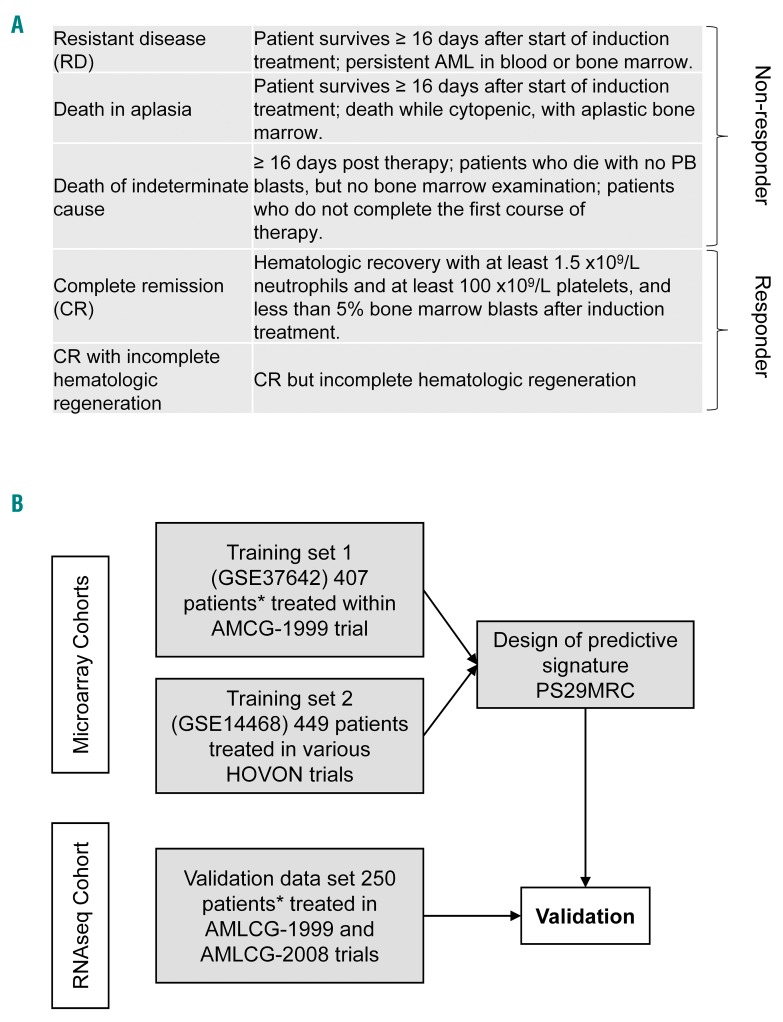
All statistical analyses were performed using the R 3.3.1 software package (R Foundation for Statistical Computing, Vienna, Austria). Definitions of response to treatment are shown in Figure 1A. We used a slightly modified definition of RD as recommended by Cheson et al.4 In the original definition, patients had to survive at least seven days post induction treatment and have persistent AML in blood or bone marrow after induction treatment. To address the difference in treatment length between various induction regimens [HAM (5 days), “7+3” [7 days], TAD (9 days) or sHAM (11 days)], only patients surviving at least 16 days after the start of treatment, independently of the treatment arm, were considered for the development of the predictor in the training sets. Day 16 was selected because the first induction response testing in AMLCG trials was scheduled at this time point. Only patients who started study treatment and those with a definite induction result (CR/CRi or RD) were included in training set 1 and in the analysis of RD in the validation set. Patients with death in aplasia or of indeterminate cause were excluded from training set 1 (but not from the validation set). This subgroup of patients (n=15) in combination with patients with RD (non-responder; see Figure 1A) was analyzed separately in the validation set.
Figure 1.
Definitions of response and study design. (A) Figure showing the details of the response definition. (B) Flow chart showing the study design and distribution of patients. *Patients analyzed by targeted sequencing for 68 genes recurrently mutated in acute myeloid leukemia. RD: resistant disease; AML: acute myeloid leukemia; PB: peripheral blood; PS29MRC: Predictive Score 29 MRC; HOVON: Haemato-Oncology Foundation for Aults in the Netherlands.
Overall survival was defined as time from study entry until death from any cause. Patients alive were censored at the time of their last follow up. The prognostic impact of the classifier was evaluated by the Kaplan-Meier method and the log-rank test. Because resistant AML can only be cured by stem cell transplantation (SCT), all survival analyses were censored for SCT if not otherwise indicated. The χ2-test was applied for categorical variables and the Wilcoxon test for continuous variables for statistical comparisons. For three-way comparison of numerical variables, we used the Kruskal-Wallis Test. Multivariable logistic models for resistance to induction treatment and multivariable Cox models for OS were used to adjust for potential confounders. P≤≤0.05 was considered statistically significant.
Results
Patients
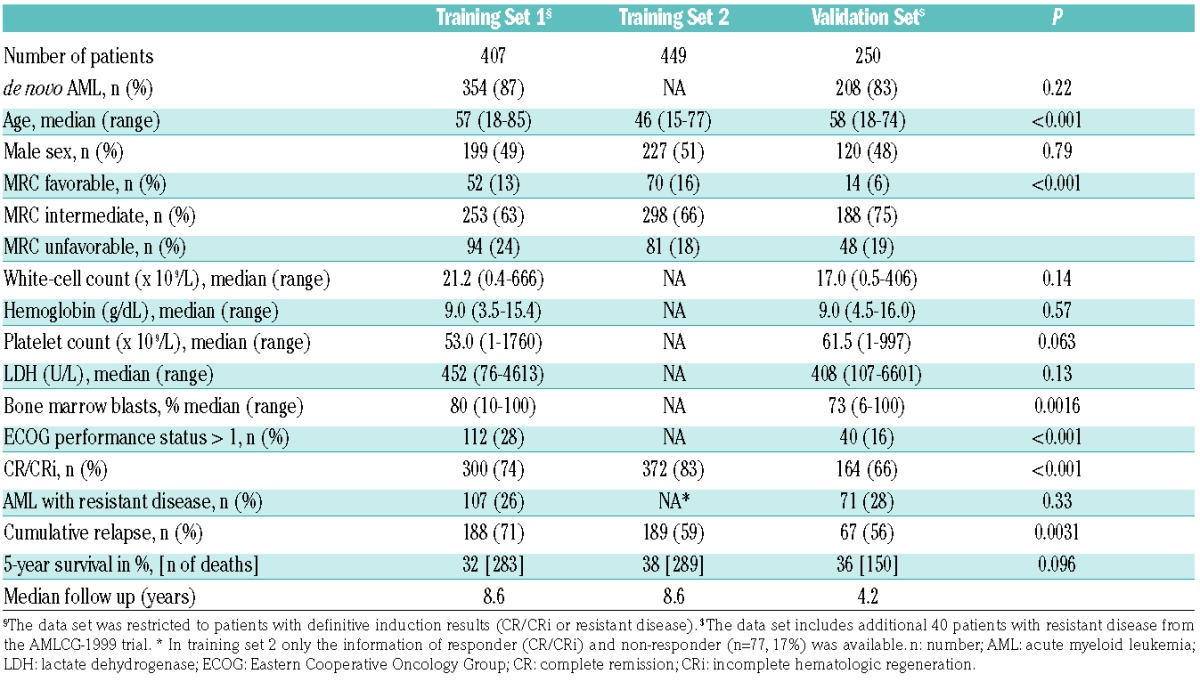
A flow chart of the study is given in Figure 1B. A total of 1106 patients were included in the analysis. Patients’ characteristics are shown in Table 1. Patients in training set 2 were significantly younger and had a higher response rate than patients in the other two sets. Due to the addition of resistant patients, the validation set included significantly fewer patients with favorable cytogenetics. The median follow up was more than eight years in the training sets and 4.2 years in the validation set.
Table 1.
Patients’ characteristics.
Validation of the final predictor
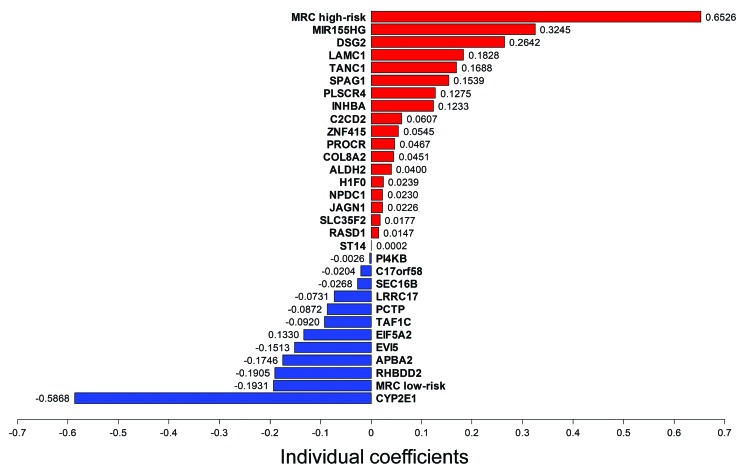
The final score (Predictive Score 29 MRC, PS29MRC) consists of 29 gene expression markers and the cytogenetic risk groups defined according to the MRC classification,22 and is calculated as a weighted linear sum of the individual predictors (Figure 2).
Figure 2.
Signature and weights. Variables included in the predictive score PS29MRC. The final score is calculated as the weighted sum of these values (MRC high risk/low risk as 1 or −1, respectively). The final classifier consisted of 29 gene expression markers and the favorable and unfavorable cytogenetic MRC groups. Variables in red are associated with resistant disease; variables in blue are predictive for a response to induction treatment.
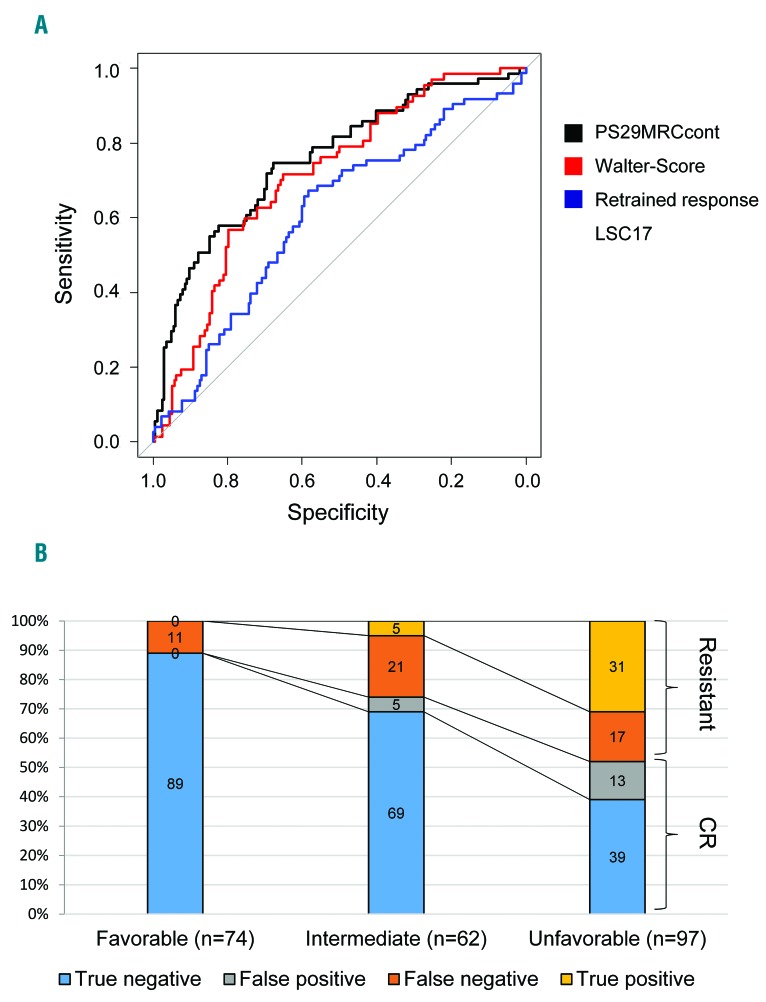
The score in the validation set ranged from −2.75 to +3.72. In univariate analysis, PS29MRC as a continuous variable (PS29MRCcont) was a highly significant predictor of RD in the validation set with an odds ratio (OR) of 2.39 (95%CI: 1.80, 3.26; P=8.63·10−9, AUC=0.76) (Figure 3A). Similar results were seen with PS29MRC as a dichotomous variable (PS29MRCdic) applying the pre-defined cut off (Online Supplementary Appendix) defined in training set 1 (OR 8.03, 95%CI: 4.07, 16.46; P=4.29·10−9). We subsequently designed multivariable models including all variables with P≤0.05 in training set 1 and the validation set for the prediction of RD. The results of PS29MRCdic are shown in Table 2. Only PS29MRCdic, age and TP53 mutations remained significant in the model. Comparable results were seen with PS29MRC as a continuous variable (Online Supplementary Table S1).
Figure 3.
Receiver operating characteristic curve (ROC) of predictive score PS29MRC as a continuous variable (PS29MRCcont) and barplots showing the predictive performance of the PS29MRC as a dichotomous variable (PS29MRCdic) in the validation set. (A) ROC curve showing the performance of PS29MRCcont and other predictive scores in the validation set at varying thresholds. Area under receiver-operating characteristic curve (AUC): PS29MRCcont: 0.76; Walter-Score: 0.71; Retrained response LSC17: 0.61. (B) Bar plots showing the performance of PS29MRCdic in subgroups defined by the European LeukemiaNet (ELN) 2017 genetic risk classification (ELN2017). CR: complete remission.
Table 2.
Univariate and multivariable analysis of the prediction of resistant disease in the validation set.

When we included all non-responders in the analysis (Figure 1A), PS29MRCcont (OR 2.34, 95%CI: 1.80, 3.13; P=1.48·10−9, AUC=0.75) and PS29MRCdic (OR 8.04, 95%CI: 4.20, 16.06; P=9.27·10−10) remained highly significant. In the multivariable model, only PS29MRCdic, age and TP53 mutations remained significant (PS29MRCdic: OR 5.08, 95%CI: 2.39; 11.19; P=3.41·10−5; age: OR 1.06, 95%CI: 1.03, 1.09; P=0.00013; TP53: OR 6.13, 95%CI: 1.56, 31.90; P=0.016). Comparable results were seen when only patients treated in the AMLCG 2008 trial were considered (Online Supplementary Table S2).
To exclude the possibility that patients that achieve a CR after two courses of induction treatment are misclassified as resistant, we also tested if PS29MRC was able to correctly forecast RD at day 60. In univariate, as well as in multivariable analysis, PS29MRC showed comparable results (Online Supplementary Table S3).
Characterization of the dichotomized classifier
PS29MRCdic was designed in the training set to identify resistant AML patients with high specificity. By applying the pre-defined cut off, we were able to reach a specificity of 148 of 164 (90%) and sensitivity of 33 of 71 (46%) in the independent validation set. The performance of the classifier in the training sets and the validation set is shown in Online Supplementary Figure S3. The accuracy of PS29MRCdic was 77% in the validation set.
When we included all patients with death in aplasia or of indeterminate cause in the analysis (Figure 1A), the sensitivity of PS29MRCdic in predicting non-response to induction treatment was 40 of 86 (47%) and the accuracy 75%.
In the cytogenetic subgroups favorable (n=14; resistant: n=0; CR/CRi: n=13), intermediate (n=188; resistant: n=42; CR/CRi: n=136) and adverse (n=48; resistant: n=29; CR/CRi: n=15), the classifier showed an accuracy of 100%, 78% and 66%, respectively (Online Supplementary Figure S4). When we applied the ELN2017 genetic risk stratification, the accuracy of PS29MRCdic in the subgroups favorable, intermediate and unfavorable was 89%, 74% and 70%, respectively (Figure 3B).
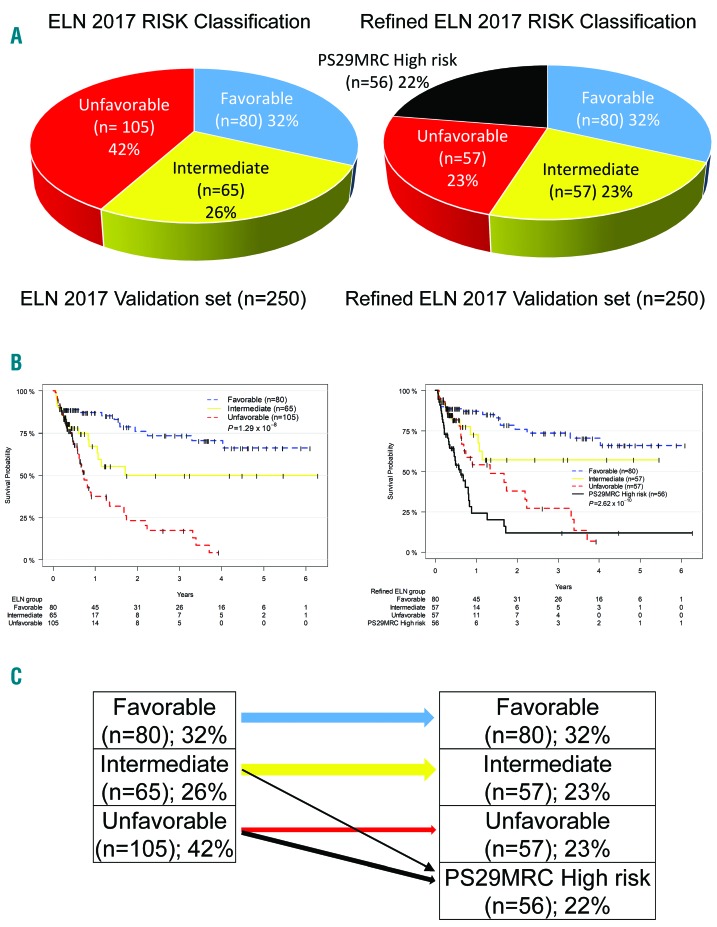
Since not achieving a CR/CRi is highly correlated with OS, we analyzed the performance of PS29MRCdic to serve as a prognostic tool. The classifier was a highly significant predictor of survival in univariate (HR 2.81, 95%CI: 1.98, 3.99; P=7.73·10−9) and multivariable (HR 2.15, 95%CI: 1.39, 3.31; P=0.00052) models, including all variables significant (P≤0.05) in training set 1 and the validation set (Online Supplementary Table S4). When we integrated PS29MRCdic in the ELN2017 genetic risk stratification, four risk groups with a median OS of 8 months (95%CI: 5–10) in the PS29MRCdic high-risk group, 16 (95%CI: 8–41) months in the ELN2017 unfavorable group, and ‘not reached’ in the intermediate and favorable risk groups could be defined (Figure 4A–C). Approximately 50% of all ELN2017 unfavorable and approximately 12% of all ELN2017 intermediate-risk patients were classified as high risk according to PS29MRCdic. The probability of survival in the four risk groups at 24 months was 12%, 38%, 57% and 76%, respectively. Comparable results were seen when OS was not censored for SCT (Online Supplementary Figure S5).
Figure 4.
Refinement of the European LeukemiaNet (ELN) 2017 genetic risk classification (ELN2017) by predictive score PS29MRC. (A) Pie charts showing the distribution of patients according to ELN2017 and refined risk criteria. (B) Kaplan-Meier estimates of acute myeloid leukemia (AML) patients in the validation set according to ELN2017 and the refined ELN2017 classification. (C) Scheme of reclassification of the three ELN2017 risk groups into four groups by integrating PS29MRC as a dichotomous variable (PS29MRCdic) (high risk) with the ELN2017 risk classification.
We also classified the heterogeneously treated AML patients included in the TCGA analysis23 with PS29MRCdic (available gene expression samples n=183). The predictor was highly predictive for OS in the independent data set (Online Supplementary Figure S6).
Performance of the classifier in genetic subgroups
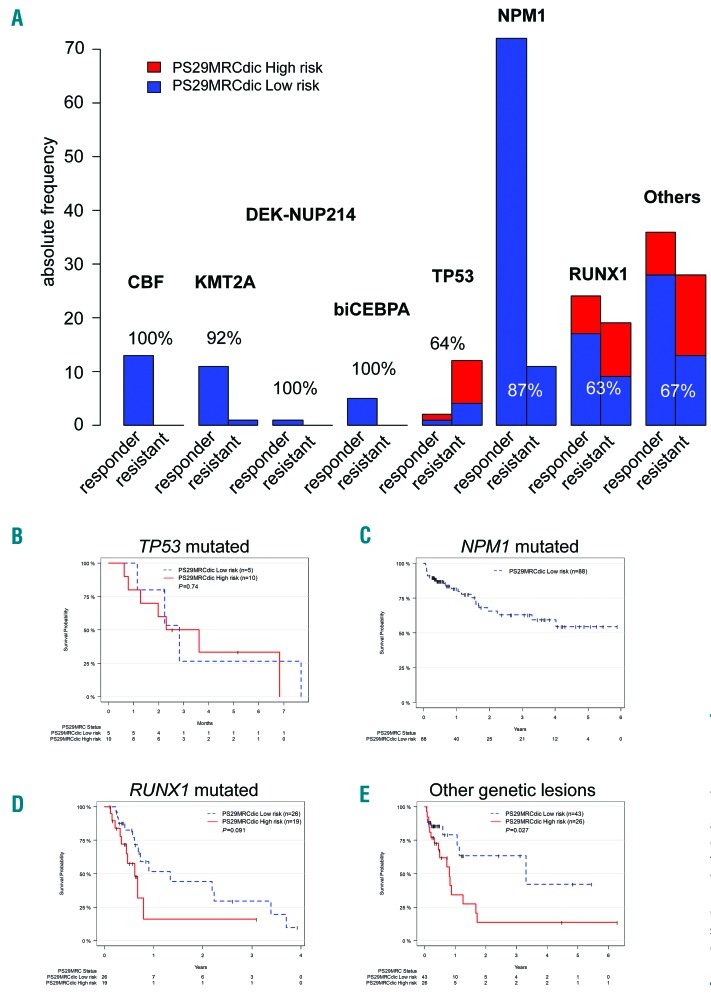
Mutation profiles defining genetic subgroups in AML have been recently defined.17,24 We used these subgroups to further characterize the predictive potential of PS29MRCdic. A detailed picture of the analysis is shown in Figure 5A and Online Supplementary Figure S7A. The classifier reached very high accuracy in the genetic subgroups defined by Metzeler et al.17 as core binding factor alterations (CBF), KMT2A rearranged AML, AML with biallelic CEBPA mutations, and AML with NPM1 mutations. Moderate predictive accuracy was achieved in the high-risk subgroups defined by TP53 and RUNX1 alterations. Here, PS29MRCdic was not able to significantly predict OS (Figure 5B and D). In the large subgroup of patients without classifiable genetic alterations, PS29MRCdic was able to significantly predict survival (P=0.027) (Figure 5E).
Figure 5.
Predictive ability of predictive score PS29MRC in genetic subgroups of acute myeloid leukemia (AML). (A) Bar plots showing the predictive ability of PS29MRC as a dichotomous variable (PS29MRCdic) in various genetic subgroups. The y-axis shows the absolute number of patients included. Patients in blue were predicted to respond to treatment (PS29MRCdic, low risk). Patients in red were predicted as resistant disease (PS29MRCdic, high risk). The accuracy is given in percentage. (B-E) Overall survival of AML patients in selected genetic subgroups. Kaplan-Meier estimates of AML patients classified according to PS29MRCdic as low risk and high risk.
The results of the classification of genetic subgroups according to Papaemmanuil et al.24 show comparable results with a moderate predictive accuracy of PS29MRC in high-risk subgroups defined by TP53 mutations, chromosomal aneuploidy or both, AML with mutated chromatin, RNA-splicing genes or both, and AML with driver mutations but no class-defining lesions. In all other subgroups, even though some had small sample sizes, PS29MRC reached very high predictive accuracy. In contrast to the results seen with the classification according to Metzeler et al.,17 significantly, OS could only be predicted in the subgroup of patients with mutated chromatin, RNA-splicing genes, or both (Online Supplementary Figure S7B).
Performance of the classifier in comparison to currently used models
In pairwise comparisons to published, predictive classifiers like the model by Walter et al.3 (integrating information on age, performance status, white blood cell count, platelet count, bone marrow blasts, sex, type of AML, cytogenetics and NPM1 and FLT3-ITD status), or the modified molecular version of this score,6 PS29MRCdic reached superior predictive power (Table 3). When we restricted the analysis to patients aged 60 years or over (n=118), only PS29MRCdic was left as significant variable (HR=2.04, 95%CI: 1.35, 3.21; P=0.0012).
Table 3.
Univariate and multivariable analysis of the prediction of resistant disease of PS29MRCdic and alternative models in the validation set.
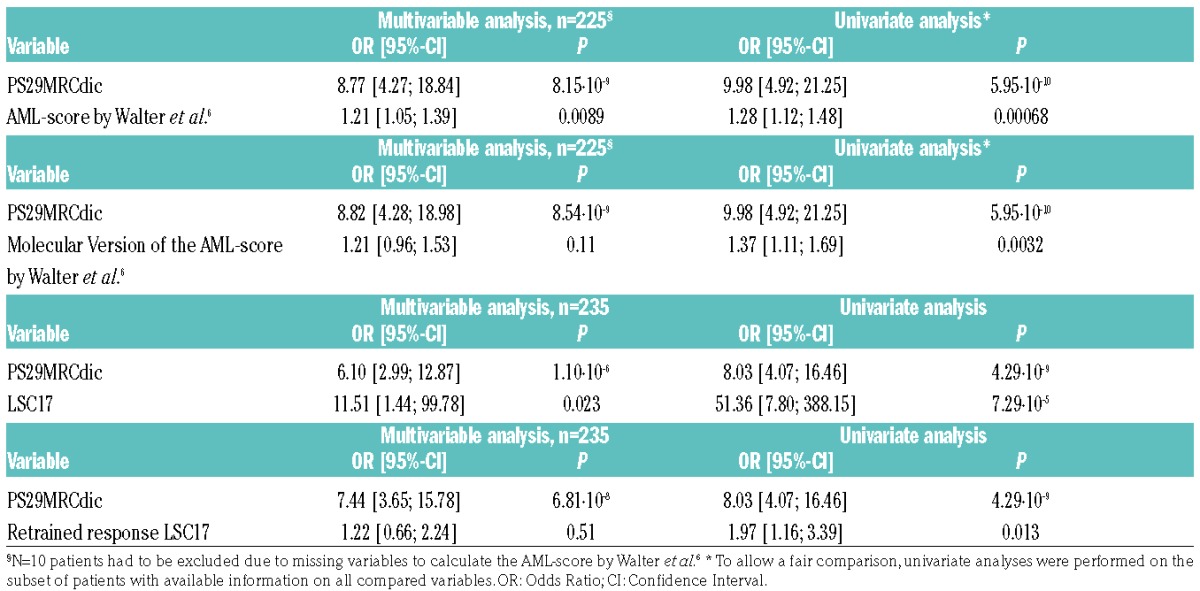
Recently, a highly significant prognostic tool based on “stemness” gene expression markers (LSC17) was published.25 A modified version of this classifier (retrained response LSC17) was developed to predict resistant disease. In multivariable testing, PS29MRCdic outperformed these predictors that are solely based on gene expression variables (Table 3). The extremely high OR is the result of a very low variance of LSC17 (range −0.40 to 0.41).
Comparable results were achieved for PS29MRC as continuous variable (Online Supplementary Table S5 and Online Supplementary Figure S3A).
Discussion
We developed a powerful predictor for primary therapy resistance in AML. PS29MRC was validated in a fully independent patient cohort using a different technique to measure gene expression. The predictor also strongly associated with survival, which emphasizes the importance of the initial response to therapy. In our analysis, the predictive power for survival was limited to the intermediate and unfavorable ELN2017 genetic risk groups, possibly due to the low rate of resistant patients in the favorable genetic risk subgroup. PS29MRC identified a high-risk patient group of approximately 20% of all intensively treated AML patients with a median survival of only eight months, and a survival probability of only 12% at 24 months. Therefore, regarding the toxicity and side effects of induction treatment, it appears questionable as to whether this treatment can be still considered “standard” for this patient subgroup. PS29MRC showed limited effectiveness in high-risk groups defined by, for example, TP53 alterations, but was stronger in patients without currently established predictive markers and the intermediate cytogenetic risk group.
The development process of PS29MRC included extensive evaluation of mutational data from recurrently mutated genes in AML. Interestingly, as shown previously by Walter et al.,6 we were not able to improve the predictive ability of our model by including information on the mutational status of these AML associated genes in the classifier.6
The gene expression markers included in our signature can only be surrogates of cellular pathways predicting resistant disease or directly responsible for the refractory phenotype. MIR155HG, the host gene of miR-155, is one of the most important markers in our signature. High expression of the microRNA miR-155 has already been shown to be associated with an aggressive phenotype in AML with normal karyotype.26 mir-155 is regulated by NF-κB and could be repressed by the inhibitor MLN4924 (Pevonedistat) which has already entered phase II clinical trials (clinicaltrials.gov identifier: 02610777).27
Allogeneic SCT is currently the only curative option for patients with RD.2 However, to our knowledge there is currently no accepted standard treatment that can be offered to patients with a very high probability of RD before undergoing SCT.28 Approaches including low-dose chemotherapy or hypomethylating agents are possible options.29 Of note, the rate of SCT was lower in AMLCG patients that were resistant to induction treatment than for patients with an indication for SCT in the post-remission phase due to unfavorable cytogenetic markers (data not shown). One explanation could be the usually poor physical condition of resistant AML patients due to prolonged cytopenia after induction treatment and refractory disease. However, so far no randomized trial has demonstrated that avoiding intensive induction treatment and selecting other approaches would result in a higher SCT rate. The extremely poor prognosis of patients with RD shows an urgent need for alternative treatment approaches since a substantial number of patients do not benefit from induction treatment. PS29MRC would offer an accurate tool to design and implement such trials.
We were able to demonstrate that the information on treatment response is included in the AML bulk itself at initial diagnosis. However, even though our study included a large amount of data in order to construct a better predictor, we still were only just able to reach a fair AUC in an independent validation set which is higher, but still in the range, of recent publications.3,6,7 Similar to the work of Walter et al.,6 we seem to have reached an obstacle that could not be overcome even by the addition of more information. Since all patients were considered eligible for intensive treatment, there seem to be additional, currently unknown variables that influence the response to induction treatment. It is tempting to speculate which other variables in addition to the disease itself affect response. Maybe clonal heterogeneity, individual drug metabolism or co-medications and interactions are more important than currently assumed. For example, CYP2E1 expression levels, which are associated with response to treatment in our study, influence cytarabine metabolism,30 and CYP2E1 expression levels might be influenced by smoking.31 Furthermore, maybe the inclusion of more patients could help to increase the predictive ability. A recent publication analyzing 1540 AML patients and 231 predictor variables suggested that large knowledge banks of matched genomic-clinical data can support clinical decision making.32 Considering, for example, the work by Walter et al.6 and our study, we would strongly recommend including gene expression markers into these approaches because of their predictive potential. Gene expression data sets published by TCGA,23 HOVON,13,14 AMLSG33 and AMLCG,11,12 as well as the LEUCEGENE Project,34 already summarize more than 2000 AML patients that could be used to improve our prognostic and predictive abilities to personalize AML treatment.
The implementation of a gene expression-based classifier in routine clincial practice is difficult because gene expression analysis is currently not included in the recommended molecular work up of newly diagnosed AML.35 However, advances in next generation sequencing result in more cost effective and robust methods to measure gene expression, such as NanoString or RNAseq.36,37 It is highly probable that these techniques will be available in future clinical settings and this will help to improve risk classification of patients.
In summary, failure of induction treatment is one of the remaining challenges in the treatment of AML. From a clinical perspective, risk stratification before the start of treatment would be desirable. Patients with a high risk of RD could avoid the side effects of intensive induction and might be assigned to novel, experimental treatment strategies. We were able to validate a predictor that reached outstanding specificity and accuracy in an independent data set. PS29MRC could be instrumental in helping design clinical trials that overcome the current paradigm of intensive induction as standard treatment in all eligible patients.
Supplementary Material
Acknowledgments
This work is in memory of Thomas Büchner, who died while helping the authors with this project.
The authors thank all participants of the AMLCG trials and recruiting centers.
Footnotes
Check the online version for the most updated information on this article, online supplements, and information on authorship & disclosures: www.haematologica.org/content/103/2/xxx
Funding
This work was supported by the Wilhelm-Sander-Stiftung (grant 2013.086.1) to TH, UM and KS; by funding from Deutsche Forschungsgemeinschaft (DFG Collaborative Research Centre SFB 1243) to PAG, HB, MS, WH, KHM and KS; by the “Verein zur Förderung von Wissenschaft und Forschung an der Medizinischen Fakultät der LMU München” to TH. SKB is supported by Leukaemia & Blood Cancer New Zealand and the family of Marijanna Kumerich.
Contribution: TH, UM and KS conceived and designed the experiments. TH, MR-T, BK, LH and KHM performed experiments. TH, VJ, AMNB, SAB, MR-T and KHM analyzed data. VJ, AMNB, SAB and UM provided bioinformatics support. JP-M, SK and HB managed the Genome Analyzer IIx platform and the RNA sequencing. MR-T, BK, LH, PAG, SS, NK, JT, MS, JB, SKB and KS characterized patient samples; MCS, DG, JB, SA, WEB, BJW and WH coordinated the AMLCG clinical trials. UM and KS supervised the project. TH, VJ, SAB, KHM and SKB wrote the manuscript.
References
- 1.Dohner H, Estey EH, Amadori S, et al. Diagnosis and management of acute myeloid leukemia in adults: recommendations from an international expert panel, on behalf of the European LeukemiaNet. Blood. 2010;115(3):453–474. [DOI] [PubMed] [Google Scholar]
- 2.Döhner H, Estey E, Grimwade D, et al. Diagnosis and management of AML in adults: 2017 ELN recommendations from an international expert panel. Blood. 2017;129(4):424–447. [DOI] [PMC free article] [PubMed] [Google Scholar]
- 3.Walter RB, Othus M, Burnett AK, et al. Resistance prediction in AML: analysis of 4601 patients from MRC/NCRI, HOVON/SAKK, SWOG and MD Anderson Cancer Center. Leukemia. 2015;29(2):312–320. [DOI] [PMC free article] [PubMed] [Google Scholar]
- 4.Cheson BD, Bennett JM, Kopecky KJ, et al. Revised recommendations of the International Working Group for Diagnosis, Standardization of Response Criteria, Treatment Outcomes, and Reporting Standards for Therapeutic Trials in Acute Myeloid Leukemia. J Clin Oncol. 2003;21(24):4642–4649. [DOI] [PubMed] [Google Scholar]
- 5.Ferguson P, Hills RK, Grech A, et al. An operational definition of primary refractory acute myeloid leukemia allowing early identification of patients who may benefit from allogeneic stem cell transplantation. Haematologica. 2016;101(11):1351–1358. [DOI] [PMC free article] [PubMed] [Google Scholar]
- 6.Walter RB, Othus M, Paietta EM, et al. Effect of genetic profiling on prediction of therapeutic resistance and survival in adult acute myeloid leukemia. Leukemia. 2015;29(10):2104–2107. [DOI] [PMC free article] [PubMed] [Google Scholar]
- 7.Krug U, Rollig C, Koschmieder A, et al. Complete remission and early death after intensive chemotherapy in patients aged 60 years or older with acute myeloid leukaemia: a web-based application for prediction of outcomes. Lancet. 2010;376(9757):2000–2008. [DOI] [PubMed] [Google Scholar]
- 8.Dohner H, Weisdorf DJ, Bloomfield CD. Acute Myeloid Leukemia. N Engl J Med. 2015;373(12):1136–1152. [DOI] [PubMed] [Google Scholar]
- 9.Buchner T, Krug UO, Peter Gale R, et al. Age, not therapy intensity, determines outcomes of adults with acute myeloid leukemia. Leukemia. 2016;30(8):1781–1784. [DOI] [PubMed] [Google Scholar]
- 10.Buchner T, Berdel WE, Schoch C, et al. Double induction containing either two courses or one course of high-dose cytarabine plus mitoxantrone and postremission therapy by either autologous stem-cell transplantation or by prolonged maintenance for acute myeloid leukemia. J Clin Oncol. 2006;24(16):2480–2489. [DOI] [PubMed] [Google Scholar]
- 11.Herold T, Metzeler KH, Vosberg S, et al. Isolated trisomy 13 defines a homogeneous AML subgroup with high frequency of mutations in spliceosome genes and poor prognosis. Blood. 2014;124(8):1304–1311. [DOI] [PubMed] [Google Scholar]
- 12.Li Z, Herold T, He C, et al. Identification of a 24-gene prognostic signature that improves the European LeukemiaNet risk classification of acute myeloid leukemia: an international collaborative study. J Clin Oncol. 2013;31(9):1172–1181. [DOI] [PMC free article] [PubMed] [Google Scholar]
- 13.Wouters BJ, Lowenberg B, Erpelinck-Verschueren CA, van Putten WL, Valk PJ, Delwel R. Double CEBPA mutations, but not single CEBPA mutations, define a subgroup of acute myeloid leukemia with a distinctive gene expression profile that is uniquely associated with a favorable outcome. Blood. 2009;113(13):3088–3091. [DOI] [PMC free article] [PubMed] [Google Scholar]
- 14.Taskesen E, Bullinger L, Corbacioglu A, et al. Prognostic impact, concurrent genetic mutations, and gene expression features of AML with CEBPA mutations in a cohort of 1182 cytogenetically normal AML patients: further evidence for CEBPA double mutant AML as a distinctive disease entity. Blood. 2011;117(8):2469–2475. [DOI] [PubMed] [Google Scholar]
- 15.Braess J, Kreuzer K-A, Spiekermann K, et al. High Efficacy and Significantly Shortened Neutropenia Of Dose-Dense S-HAM As Compared To Standard Double Induction: First Results Of a Prospective Randomized Trial (AML-CG 2008). Blood. 2013;122(21):619–619.23908438 [Google Scholar]
- 16.Greif PA, Dufour A, Konstandin NP, et al. GATA2 zinc finger 1 mutations associated with biallelic CEBPA mutations define a unique genetic entity of acute myeloid leukemia. Blood. 2012;120(2):395–403. [DOI] [PubMed] [Google Scholar]
- 17.Metzeler KH, Herold T, Rothenberg-Thurley M, et al. Spectrum and prognostic relevance of driver gene mutations in acute myeloid leukemia. Blood. 2016;128(5):686–698. [DOI] [PubMed] [Google Scholar]
- 18.ENCODE Consortium. Standards, Guidelines and Best Practices for RNA-Seq v.1.0. June 2011. [Available from: https://genome.ucsc.edu/encode/protocols/dataStandards/ENCODE_RNAseq_Standards_V1.0.pdf Last accessed: 31st January 2018].
- 19.Dobin A, Davis CA, Schlesinger F, et al. STAR: ultrafast universal RNA-seq aligner. Bioinformatics. 2013;29(1):15–21. [DOI] [PMC free article] [PubMed] [Google Scholar]
- 20.Love MI, Huber W, Anders S. Moderated estimation of fold change and dispersion for RNA-seq data with DESeq2. Genome Biol. 2014;15(12):550. [DOI] [PMC free article] [PubMed] [Google Scholar]
- 21.Herold T, Jurinovic V, Metzeler KH, et al. An eight-gene expression signature for the prediction of survival and time to treatment in chronic lymphocytic leukemia. Leukemia. 2011;25(10):1639–1645. [DOI] [PubMed] [Google Scholar]
- 22.Grimwade D, Hills RK, Moorman AV, et al. Refinement of cytogenetic classification in acute myeloid leukemia: determination of prognostic significance of rare recurring chromosomal abnormalities among 5876 younger adult patients treated in the United Kingdom Medical Research Council trials. Blood. 2010;116(3):354–365. [DOI] [PubMed] [Google Scholar]
- 23.TCGA. Genomic and epigenomic landscapes of adult de novo acute myeloid leukemia. N Engl J Med. 2013;368(22):2059–2074. [DOI] [PMC free article] [PubMed] [Google Scholar]
- 24.Papaemmanuil E, Gerstung M, Bullinger L, et al. Genomic Classification and Prognosis in Acute Myeloid Leukemia. N Engl J Med. 2016;374(23):2209–2221. [DOI] [PMC free article] [PubMed] [Google Scholar]
- 25.Ng SW, Mitchell A, Kennedy JA, et al. A 17-gene stemness score for rapid determination of risk in acute leukaemia. Nature. 2016;540(7633):433–437. [DOI] [PubMed] [Google Scholar]
- 26.Marcucci G, Maharry KS, Metzeler KH, et al. Clinical role of microRNAs in cytogenetically normal acute myeloid leukemia: miR-155 upregulation independently identifies high-risk patients. J Clin Oncol. 2013;31(17):2086–2093. [DOI] [PMC free article] [PubMed] [Google Scholar]
- 27.Khalife J, Radomska HS, Santhanam R, et al. Pharmacological targeting of miR-155 via the NEDD8-activating enzyme inhibitor MLN4924 (Pevonedistat) in FLT3-ITD acute myeloid leukemia. Leukemia. 2015;29(10):1981–1992. [DOI] [PMC free article] [PubMed] [Google Scholar]
- 28.Thol F, Schlenk RF, Heuser M, Ganser A. How I treat refractory and early relapsed acute myeloid leukemia. Blood. 2015;126(3):319–327. [DOI] [PubMed] [Google Scholar]
- 29.Welch JS, Petti AA, Miller CA, et al. TP53 and Decitabine in Acute Myeloid Leukemia and Myelodysplastic Syndromes. N Engl J Med. 2016;375(21):2023–2036. [DOI] [PMC free article] [PubMed] [Google Scholar]
- 30.Iacobucci I, Lonetti A, Candoni A, et al. Profiling of drug-metabolizing enzymes/transporters in CD33+ acute myeloid leukemia patients treated with Gemtuzumab-Ozogamicin and Fludarabine, Cytarabine and Idarubicin. Pharmacogenomics J. 2013;13(4):335–341. [DOI] [PubMed] [Google Scholar]
- 31.Zevin S, Benowitz NL. Drug interactions with tobacco smoking. An update. Clin Pharmacokinet. 1999;36(6):425–438. [DOI] [PubMed] [Google Scholar]
- 32.Gerstung M, Papaemmanuil E, Martincorena I, et al. Precision oncology for acute myeloid leukemia using a knowledge bank approach. Nat Genet. 2017;49(3):332–340. [DOI] [PMC free article] [PubMed] [Google Scholar]
- 33.Gaidzik VI, Paschka P, Spath D, et al. TET2 mutations in acute myeloid leukemia (AML): results from a comprehensive genetic and clinical analysis of the AML study group. J Clin Oncol. 2012;30(12):1350–1357. [DOI] [PubMed] [Google Scholar]
- 34.Pabst C, Bergeron A, Lavallee VP, et al. GPR56 identifies primary human acute myeloid leukemia cells with high repopulating potential in vivo. Blood. 2016;127(16):2018–2027. [DOI] [PubMed] [Google Scholar]
- 35.Dohner H, Estey E, Grimwade D, et al. Diagnosis and management of AML in adults: 2017 ELN recommendations from an international expert panel. Blood. 2017;129(4):424–447. [DOI] [PMC free article] [PubMed] [Google Scholar]
- 36.Wang M, Lindberg J, Klevebring D, et al. Validation of risk stratification models in acute myeloid leukemia using sequencing-based molecular profiling. Leukemia. 2017;31(10):2029–2036. [DOI] [PMC free article] [PubMed] [Google Scholar]
- 37.Ng SW, Mitchell A, Kennedy JA, et al. A 17-gene stemness score for rapid determination of risk in acute leukaemia. Nature. 2016;540(7633):433–437. [DOI] [PubMed] [Google Scholar]
Associated Data
This section collects any data citations, data availability statements, or supplementary materials included in this article.


