Abstract
Tyrosine kinase inhibitors (TKIs) are highly effective for the treatment of chronic myeloid leukemia (CML), but very few patients are cured. The major drawbacks regarding TKIs are their low efficacy in eradicating the leukemic stem cells responsible for disease maintenance and relapse upon drug cessation. Herein, we performed ribonucleic acid sequencing of flow-sorted primitive (CD34+CD38low) and progenitor (CD34+ CD38+) chronic phase CML cells, and identified transcriptional upregulation of 32 cell surface molecules relative to corresponding normal bone marrow cells. Focusing on novel markers with increased expression on primitive CML cells, we confirmed upregulation of the scavenger receptor CD36 and the leptin receptor by flow cytometry. We also delineate a subpopulation of primitive CML cells expressing CD36 that is less sensitive to imatinib treatment. Using CD36 targeting antibodies, we show that the CD36 positive cells can be targeted and killed by antibody-dependent cellular cytotoxicity. In summary, CD36 defines a subpopulation of primitive CML cells with decreased imatinib sensitivity that can be effectively targeted and killed using an anti-CD36 antibody.
Introduction
Chronic myeloid leukemia (CML) arises when a reciprocal t(9;22) translocation, generating the BCR/ABL1 fusion gene, occurs in a hematopoietic stem cell (HSC).1,2 Currently, the disease is often controlled by daily administered tyrosine kinase inhibitors (TKIs) and patients rarely progress into an accelerated phase or blast crisis.3 However, BCR/ABL1 transcripts are still detectable during treatment, even in the majority of patients with complete clinical and cytogenetic responses.4 Among TKI-treated patients with undetectable minimal residual disease (MRD), 40–60% lose their molecular remission after TKI cessation.5 This is generally believed to be caused by CML stem cells, which are partially resistant to TKI treatment.6–8 Even patients with undetectable residual disease have been shown to harbor primitive CML cells.9 These primitive CML cells reside within the CD34+CD38low population, and have been shown by us and others to express both IL1RAP and CD26.10–14 However, the exact immunophenotype of these primitive CML cells is not clearly defined, and the identification of additional cell surface molecules on primitive CML cells may translate into new therapeutic opportunities.
Herein, we performed ribonucleic acid (RNA) sequencing of CML CD34+CD38low cells, and identified CD36 and the leptin receptor (LEPR) as being specifically upregulated on primitive CML cells compared to corresponding normal bone marrow (NBM) cells. We further demonstrate that the CD36 expressing subpopulation of primitive CML cells is less sensitive to imatinib treatment, and that CD36 antibodies can induce selective killing of CML cells by antibody-dependent cellular cytotoxicity (ADCC), thus providing a putative new therapeutic opportunity for targeting imatinib-resistant CML stem cells.
Methods
Patient samples and CD34 enrichment
Bone marrow (BM) and peripheral blood (PB) from TKI-naive chronic phase CML patients (n=34; Online Supplementary Table S1) were obtained after written informed consent and in accordance with the Declaration of Helsinki. Ten of these patients were included in the NordCML006 study (clinicaltrials.gov identifier: 00852566) and 15 in the ongoing BFORE study (clinicaltrials.gov identifier: 02130557).15,16 Mononuclear cells were isolated using lymphoprep (GE Healthcare Bio-Sciences AB, Sweden) and CD34 enrichment was performed using magnetic beads (Miltenyl Biotec, Germany) according to manufacturer’s instructions. The study was conducted with the approval of a regional ethics committee in Lund (Dnr 2011/289).
Flow cytometric analyses and FACS sorting of primary cells
Analyses of cell surface protein expression and fluorescence-activated cell sorting (FACS) was performed on a LSR Fortessa or a FACS Aria II (BD Bioscience, USA). The antibodies and viability dyes used are listed in Online Supplementary Table S2. Isotype controls were used at corresponding concentrations. Two or more CML samples were analyzed for each cell surface marker. Prior to RNA extraction, carried out according to the manufacturer’s instructions (Thermo Fisher Inc, USA), viable, single CD34+CD38low cells (5% lowest CD38 expressing cells of the CD34+ cells) from CML and NBM were sorted into a PicoPure RNA Isolation Kit Extraction Buffer (Thermo Fisher Scientific Inc).
RNA sequencing
To analyze gene expression, complementary (c)DNA was amplified using the SMARTer Ultra Low Input RNA Kit for Sequencing (Takara Bio Europe, France). Sequencing libraries were prepared from the amplified cDNA using the Nextera Library DNA Preparation Kit (Illumina, USA). Paired 2×151 base pair (bp) RNA sequencing was performed on a NextSeq 500 (Illumina). The reads were aligned to human reference genome hg19 using TopHat 2.0.7.17 Gene expression values were calculated as fragments per kilobase of transcript per million reads (fpkm) using Cufflinks 2.2.0.18 A total of ten diagnostic CML samples and four NBM controls were analyzed. RNA sequencing data have been deposited at the European Genome-phenome Archive (EGA) under the accession code EGAS00001002421. Qlucore Omics Explorer (v 3.1 Qlucore AB, Sweden) was used to identify differentially expressed genes.
Cell cycle status and cell culture with imatinib
To distinguish cells in G0/G1 phase from cells in S/G2/M phase in primary CML patient samples, deep red anthraquinone 5 (DRAQ5; BioStatus, UK) was added after staining for CD34, CD38, IL1RAP and CD36. Cells were incubated at room temperature for 20 minutes and subsequently analyzed using a LSR Fortessa (BD Bioscence). To determine sensitivity to imatinib treatment, 2000 CML cells per well were FACS sorted into 96-well plates according to CD34+CD38lowIL1RAP+CD36+ and CD34+CD38lowIL1RAP+CD36− phenotypes (Online Supplementary Figure S1) and challenged with imatinib at 5μM or dimethyl sulfoxide (DMSO) at a corresponding concentration for 72 hours. Viable cells were evaluated using CountBright Absolute Counting Beads (Thermo Fisher Inc) and 4′,6-diamidino-2-phenylindole (DAPI) on a LSR Fortessa (BD Bioscience) after three days in culture.
ADCC assay
For ADCC assays we used polyclonal antibodies targeting CD36 produced in rabbit (Innovagen, Sweden) and unspecific polyclonal rabbit immunoglobulin G (IgG) isotypes (Abcam) as control. Target cells subjected to ADCC were KU812 cells, CD34+-enriched CML samples and CD34+-enriched NBM samples. Target cells were labeled with PKH26 (Sigma-Aldrich, USA), plated at 10,000 cells/well and incubated for 30 minutes at room temperature with antibodies of concentrations between 0.001–10μg/ml. One hundred thousand natural killer (NK) cells harvested from healthy donors and isolated using magnetic beads (Milteny Biotec) were added to each well, and the ADCC effect was analyzed the following morning using DAPI as a viability marker. Specific ADCC-induced cell death was calculated according to the following formula:
Statistical Analyses
Prism 6 (GraphPad Software, USA) was used for statistical analyses. When possible, the Mann-Whitney U-test was used to determine statistically significant differences between groups, in other settings the Student’s t-test was used. The Spearman’s rank test was used to determine correlations.
Results
RNA sequencing of CD34+CD38low CML cells identifies a distinct gene expression profile
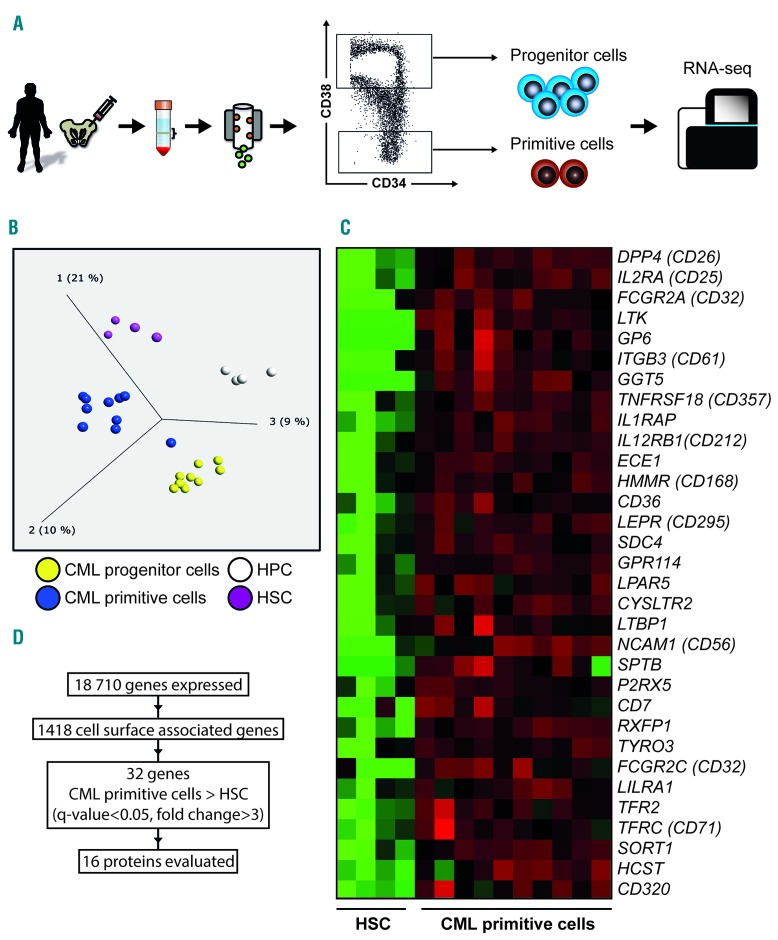
In order to identify cell surface markers that are upregulated on primitive CML cells, we performed RNA sequencing of sorted CD34+CD38+ progenitor cells and more primitive CD34+CD38low CML cells from ten newly diagnosed patients in chronic phase (Figure 1A). Corresponding healthy BM cells, sorted using the same strategy, were used as controls (n=4). The CML CD34+CD38low population had a distinct gene expression profile when compared to normal CD34+CD38low and CML CD34+CD38+ cells, visualized using unsupervised principal component analysis with a variance threshold of 0.27 retaining 1005 genes (Figure 1B). Using a previously curated list of 1418 genes encoding cell surface proteins, a two-group comparison revealed a statistically significant leukemia-specific upregulation of 32 genes (fold change >3, Q-value < 0.05) in the primitive CML cell compartment (Figure 1C,D). Correspondingly, 24 cell surface-associated genes were found to be significantly downregulated in the same cells (fold change <0.33, Q-value < 0.05, Online Supplementary Figure S2).
Figure 1.
RNA sequencing of sorted primary CML cells from bone marrow of ten newly diagnosed chronic phase patients. (A) Schematic illustration of cell populations analyzed by RNA sequencing. BM aspirates were used to isolate mononuclear cells and then enrich for CD34 expressing cells with subsequent FACS sorting. The cells displaying the lowest 5% according to CD38 expression were defined as the primitive population and the highest 80% as the more mature progenitor population. (B) Unsupervised principal component analysis of BM from CML patients (n=10) and healthy donors (n=4) sorted into hematopoietic and leukemic progenitor and primitive cell populations. (C) Heat map showing overexpression of cell surface genes in the primitive CML population (CD34+CD38low) as compared to healthy HSCs as determined by RNA sequencing. (D) Schematic figure of total number of transcribed genes detected, number of cell surface associated genes used to filter the results, number of upregulated genes in the primitive CML cell population, and genes available for validation on protein level. HPC: hematopoietic progenitor cells; HSC: hematopoietic stem cells; CML: chronic myeloid leukemia; RNA-seq: ribonucleic acid sequencing.
Validation of cell surface protein expression of upregulated genes
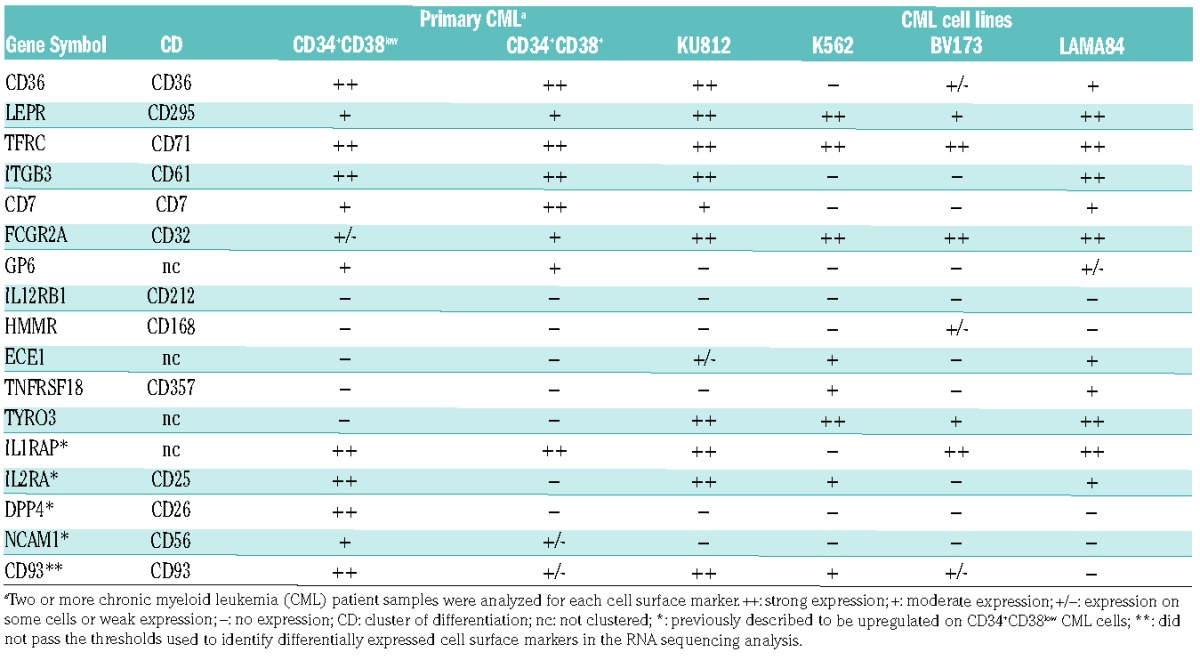
To assess if the upregulated genes identified by RNA sequencing corresponded to an increased protein expression at the cell surface, we performed flow cytometric analyses of 16 putative targets using commercially available antibodies (Table 1 and Online Supplementary Table S2). We confirmed the previously reported leukemia-specific upregulation of the following four markers: IL1RAP, IL2RA (CD25), DPP4 (CD26) and NCAM1 (CD56) within the CD34+CD38low compartment (Table 1).11–13,19 Seven additional proteins, including CD36, LEPR (CD295), TFRC (CD71), ITGB3 (CD61), CD7, FCGR2A (CD32), and GP6 were found to be expressed on primary CD34+CD38low CML cells by flow cytometry (Table 1). Most of these cell surface proteins were also expressed on the CML cell lines KU812 and BV173, whereas fewer displayed expression on K562 and LAMA84 cells. The remaining five candidate markers (IL12RBI, HMMR, ECE1, TNFRSF18, and TYRO3) could not be detected on primary CML cells, possibly due to suboptimal antibodies or absent or very low cell surface protein expression (Table 1). Finally, CD93, known to be expressed on acute myeloid leukemia (AML) cells and recently reported to be upregulated in CML,20,21 was also expressed on primitive CML cells, but did not show a significant upregulation in our gene expression data relative to corresponding NBM cells (Table 1).
Table 1.
Cell surface expression of 17 candidate markers in CML cells as determined by flow cytometry.
CD36 and LEPR are selectively expressed on CD34+CD38low CML cells compared to corresponding NBM cells
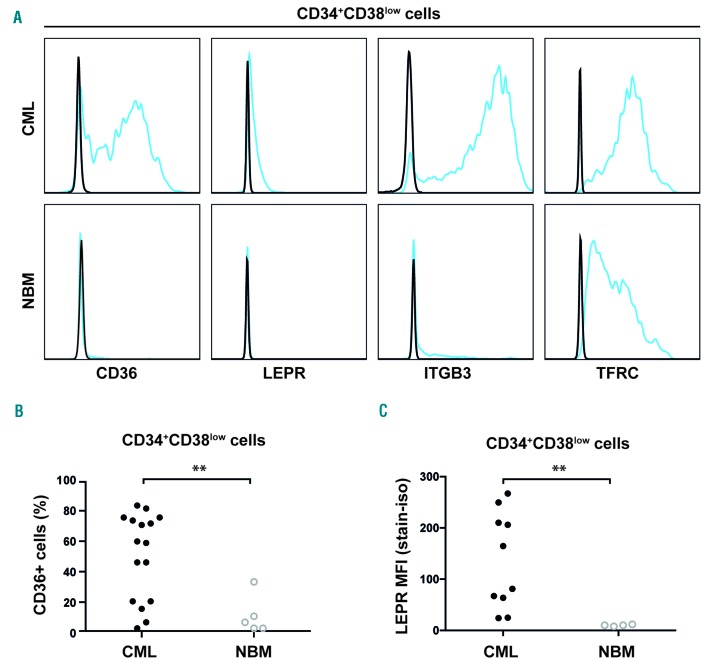
Of the newly identified cell surface proteins, CD36, LEPR, ITGB3 and TFRC showed the highest expression on CD34+CD38low CML cells, and were therefore evaluated for expression in NBM. Whereas CD36 and LEPR could not be detected or exhibited low expression on the cell surface of CD34+CD38low NBM cells, ITGB3 and TFRC showed a clearly detectable expression, albeit lower than in the corresponding CML cells (Figure 2A). Further, LEPR was not expressed on more mature CD34+CD38+ cells, whereas CD36 showed some expression in these cells (Online Supplementary Figure S3A). When examining specific sub-populations of normal hematopoietic cells, CD36 displayed a higher expression in more mature subsets (megakaryocyte-erythroid progenitors [MEP], granulocyte-machrophage progenitors [GMP], and common myeloid progenitors [CMP]) as compared to more primitive subsets [HSCs, multipotent progenitors [MPP], and lymphoid-primed multipotent progenitors [LMPP]; Online Supplementary Figure S3B).
Figure 2.
Differentially expressed proteins on primitive CML cells. (A) Representative histograms showing the specific expression of CD36 and LEPR but not ITGB3 and TFRC on leukemic CD34+CD38low cells compared to corresponding cells in NBM. (B) Dot plot showing consistent overexpression of CD36 in the CD34+CD38low cell fraction in CML samples (n=16) compared to NBM samples (n=5). (C) Overexpression of LEPR in the CD34+CD38low cell fraction in a cohort of ten CML patients with high IL1RAP expression as compared to NBM samples (n=4). **P<0.01. CML: chronic myeloid leukemia; NBM: normal bone marrow; MFI: mean fluorescence intensity; LEPR: leptin receptor.
Notably, the expression of CD36 separated the CD34+CD38low CML cells into distinct CD36 positive and negative populations. The overexpression of CD36 in CD34+CD38low cells in relation to corresponding cells from healthy BM samples was confirmed in an independent cohort of 16 CML patients (P=0.0089, Figure 2B). Staining for LEPR resulted in a weak signal, but extended analyses of ten primary CML samples with a high leukemic burden in the CD34+CD38low compartment (as defined by 50–100% IL1RAP expression, mean 86% IL1RAP+ cells), confirmed a significantly higher LEPR expression compared with corresponding healthy cells (P=0.002), devoid of LEPR (Figure 2C). Moreover, all CML samples displayed higher mean fluorescence intensity (MFI) for LEPR compared with paired isotype control stained samples, whereas the NBM samples did not (Online Supplementary Figure S4). Given the specific expression of LEPR in CML cells, we investigated if CML cells would respond to leptin.22 However, when assessing cell growth in vitro and colony forming capacity upon stimulation with leptin, no effects were observed (Online Supplementary Figure S5A-S5D). We conclude that CD36 and LEPR are specifically upregulated on the surface of primitive CML cells.
CD36 expression separates CD34+CD38lowIL1RAP+ CML cells into two distinct populations
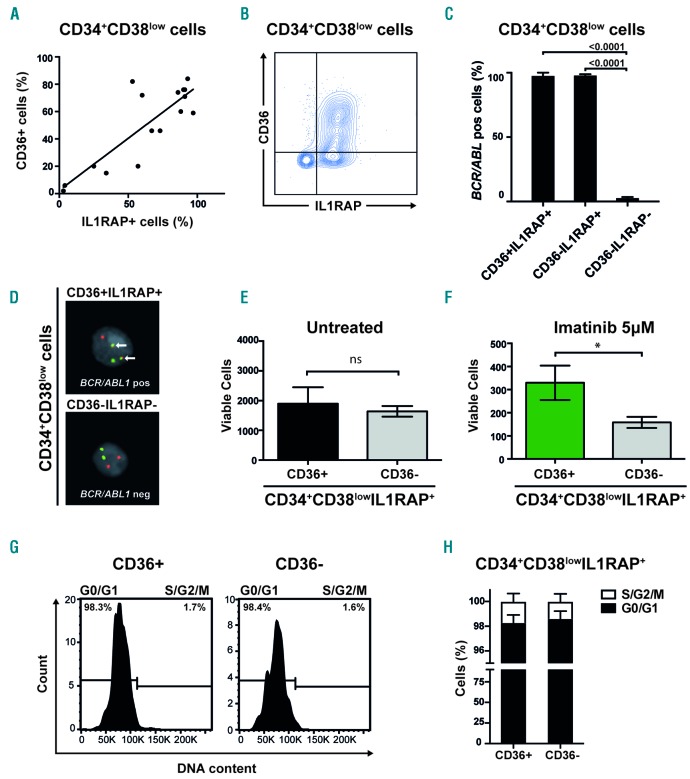
We previously demonstrated that IL1RAP expression can be used to identify BCR/ABL1 positive cells within the CD34+CD38low compartment of BM cells from CML patients, with all cells in the IL1RAP positive fraction being BCR/ABL1 positive.11,13 Because CD36 was found to be expressed on a subpopulation of the CD34+CD38low CML cells, we investigated the co-expression of CD36 and IL1RAP. Although a significant correlation between CD36 and IL1RAP expression was observed (r=0.679, P=0.0048, Figure 3A), CD36 was distinctly expressed on a subset of the CD34+CD38lowIL1RAP+ cells (Figure 3B; Online Supplementary Figure S6). To investigate the co-expression of IL1RAP and CD36 in relation to the BCR/ABL1 status of the cells, we sorted cells based on IL1RAP and CD36 expression within the CD34+CD38low cell fraction from three CML patients. By fluorescence in situ hybridization (FISH) analyses, we found that on average 98% of CD34+CD38lowIL1RAP+CD36+ cells and 98% of CD34+CD38lowIL1RAP+CD36− cells were BCR/ABL1 positive. By contrast, only 3% of the CD34+CD38lowIL1RAP−CD36− cells were BCR/ABL1 positive (Figure 3C,D). Hence, CD36 divides the CD34+CD38lowIL1RAP+ compartment into a CD36 positive and a CD36 negative population that are both predominantly BCR/ABL1 positive.
Figure 3.
A subgroup of primitive CML cells less sensitive to imatinib express CD36 (A) Linear regression and Spearman’s rank correlation show significant correlation between IL1RAP and CD36 expression in primitive CML cells, Y=0.76X + 2.4; r=0.68, P=0.0048. (B) Contour plot of co-expression of IL1RAP and CD36 in a representative CML sample (CML #5). (C) FISH on sorted cells from three CML patients showed a mean of 98% BCR/ABL1 positive cells within CD34+CD38lowIL1RAP+CD36+ cells and 98% BCR/ABL1 positive cells within CD34+CD38lowIL1RAP+CD36− cells. In the CD34+CD38lowIL1RAP−CD36− cell fraction a mean of 3% were BCR/ABL1 positive; mean based on cells from two CML patients, the third patient had no cells with a CD34+CD38lowIL1RAP−CD36− phenotype. (D) FISH showing a BCR/ABL1 positive (upper panel) and negative (lower panel) cell. (E) CD34+CD38lowIL1RAP+ CML cells FACS sorted according to CD36 expression does not appear to differ in cell growth and survival in vitro. The mean of three CML samples is shown; error bars depict standard deviation. (F) CD34+CD38lowIL1RAP+ CML cells FACS sorted according to CD36 expression and treated with imatinib at a concentration of 5μM show that CD36 expressing cells are more resistant to imatinib treatment in vitro. The mean of three CML samples is shown; error bars depict standard deviation. (G) Representative histograms from cell cycle analysis using DRAQ5 to determine DNA content show a majority of both CD36+ and CD36− cells in G0/G1 phase within the CD34+CD38lowIL1RAP+ population. (H) Data on cell cycle status from three CML patient samples are summarized showing mean and standard deviation. *P<0.05. ns; not significant.
Primitive CML cells expressing CD36 are less sensitive to imatinib treatment
To delineate the difference between the CD36 positive and negative cell populations of primitive CML cells, we sorted CD34+CD38lowIL1RAP+CD36+ and CD34+ CD38low IL1RAP+CD36− CML cells. Both populations are enriched for BCR/ABL1 positive cells, given that IL1RAP expression marks these cells.11,13 The two cell populations exhibited similar growth and survival after three days in cell culture (n=3, P=0.48, Figure 3E). Interestingly, the CD36 expressing cell population showed significantly decreased imatinib sensitivity as compared to cells lacking CD36 (n=3, P=0.019, Figure 3F). By contrast, the two cell populations exhibited a similar sensitivity to nilotinib, suggesting that the decreased in vitro sensitivity of CD36 expressing cells to imatinib can be overcome by the second generation TKI nilotinib (Online Supplementary Figure S7). In order to determine if the difference in response to imatinib was caused by differences in quiescence, cell cycle status was evaluated in three CML patient samples. No difference in cell cycle status was observed between CD36 positive and negative cells within the CD34+CD38lowIL1RAP+ population, with the majority of cells being in G0 or G1 phase (Figure 3G,H). As anticipated, more mature CD34+CD38+ cells were cycling to a higher degree (Online Supplementary Figure S8). These findings suggest that within the CD34+CD38lowIL1RAP+ compartment, CD36 defines cells that are quiescent and less sensitive to imatinib treatment. Morever, within the primitive CD34+CD38lowIL1RAP+ fraction, CD36 positive and CD36 negative cells showed similar expression of other putative CML stem cell markers, such as CD25 and CD26 (Online Supplementary Figure S9).
CD36 expression declines during TKI treatment
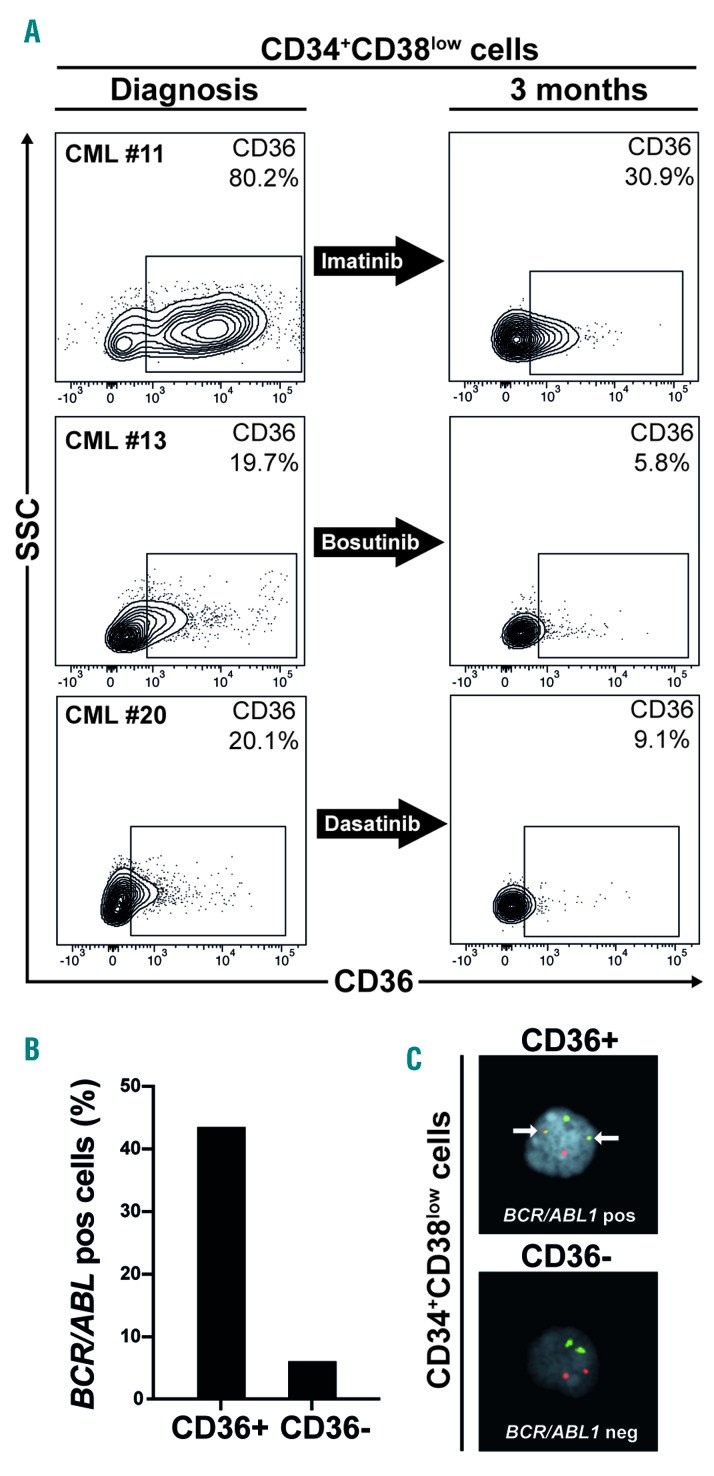
In order to investigate whether TKI treatment affects CD36 expression, we first cultured primary CML cells in vitro. However, CD36 expression rapidly decreased during in vitro culture even without the presence of TKI (Online Supplementary Figure S10A-S10C). Subsequently, in a more direct assay, we measured CD36 expression in BM cells from three CML patients treated for three months with imatinib, bosutinib or dasatinib, respectively. All three samples showed a substantial reduction of CD36 expression in the CD34+CD38low compartment as compared to matched diagnostic samples (Figure 4A). To assess the BCR/ABL1 status of the cells during treatment, only patient #11 treated with imatinib had a sufficient number of cells to allow for FACS sorting and subsequent FISH analyses. The CD34+CD38lowCD36+ cells contained 44% BCR/ABL1 positive cells, whereas CD34+CD38lowCD36− cells only contained 6% BCR/ABL1 positive cells (Figure 4B,C). This patient, with the highest CD36 expression after three months of TKI treatment, was subsequently the only one of the three patients that failed to achieve major molecular response (MMR) after 12 months of treatment, a definition of optimal response, according to the 2013 European LeukemiaNet Guidelines (Online Supplementary Table S1).3
Figure 4.
CD36 expression is reduced after TKI treatment. (A) BM aspirates from three CML patients treated with imatinib, bosutinib or dasatinib for three months showed a substantial reduction of CD36 expression in the CD34+CD38low compartment as compared to diagnosis. (B) FISH for BCR/ABL1 content on sorted CD34+CD38lowCD36+ and CD34+CD38lowCD36− cells from patient #11 after 3 months imatinib treatment show a higher BCR/ABL1 content in CD36 expressing cells. (C) FISH showing a BCR/ABL1 positive (upper panel) and negative (lower panel) cell. CML: chronic myeloid leukemia.
CD36 targeting antibodies induce specific killing of CML cells
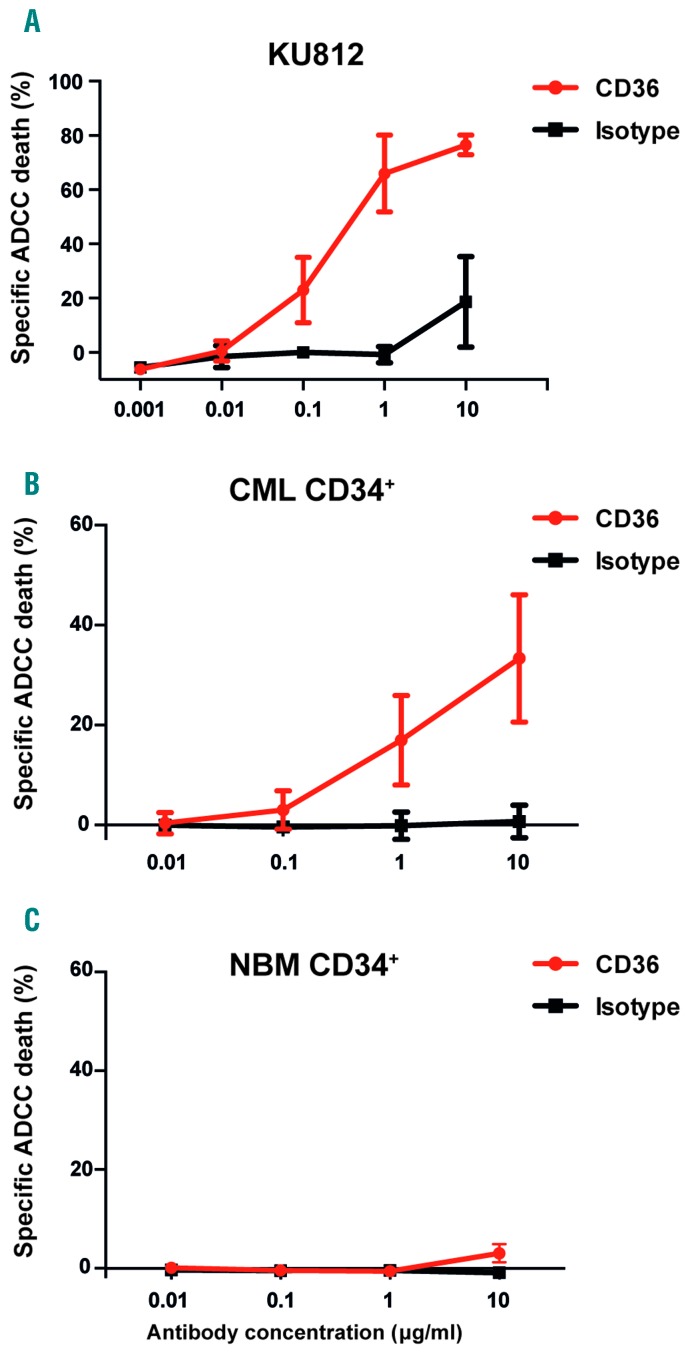
Having found that CD36 marks cells that are less sensitive to imatinib treatment, we next explored CD36 as a potential target for an antibody-based therapy. To this end, we generated a polyclonal antibody targeting CD36. In ADCC assays, we found specific and dose-dependent cell killing of CD36 expressing KU812 cells (Figure 5A). By contrast, the polyclonal CD36 antibody was not associated with direct toxic effects in the absence of human NK effector cells (Online Supplementary Figure S11). Notably, we also found that CD36 can be used as a target for ADCC-mediated cell killing of primary CD34+ CML cells (n=3, Figure 5B), whereas minimal cell death was observed in corresponding NBM cells (n=2, Figure 5C). We conclude that CD36 targeting antibodies can direct human NK cells to specifically eliminate CML cells by ADCC.
Figure 5.
Polyclonal antibodies targeting CD36 induce specific killing of CML cells. (A) The CML cell line KU812 with high CD36 expression can be specifically killed by a polyclonal rabbit anti-CD36 antibody in a dose-dependent manner by ADCC when incubated with human NK cells. (B) Primary CD34+ CML cells can be specifically killed by a polyclonal rabbit anti-CD36 antibody in a dose-dependent manner by ADCC. The mean of three CML samples is shown; error bars depict standard deviation. (C) NBM samples from healthy donors show a minute ADCC-induced cell death only at the highest tested concentration of antibody. The mean of two NBM samples is shown; error bars depict standard deviation. CML: chronic myeloid leukemia. ADCC: antibody-dependent cellular cytotoxicity; NBM: normal bone marrow.
Discussion
CML is propagated by leukemic stem cells which are partially insensitive to TKI-based therapies, and therefore believed to be responsible for disease relapse upon withdrawal of treatment.6–9,23 The identification of cell surface markers upregulated on primitive CML cells may provide important biological insights, allow for their prospective isolation and characterization, and provide novel means for therapeutic targeting of the treatment resistant cells.
Herein, we used RNA sequencing of CD34+CD38low CML cells to identify genes encoding cell surface proteins upregulated on primitive CML cells and with low or absent expression on corresponding normal cells. In total, we identified upregulation of 32 candidate cell surface markers, of which 16 were further evaluated for protein expression by flow cytometry. Previous studies aimed at identifying differentially expressed genes encoding cell surface markers on candidate CML stem cells mainly used microarray-based approaches.11,12,24,25 Of the identified markers, some have previously been described as being upregulated at the transcriptional level, but apart from IL2RA (CD25), DPP4 (CD26) and IL1RAP, their biological roles have not been functionally studied in the context of chronic phase CML.
We focused in particular on novel cell surface molecules present on primitive CML cells and with low to absent expression on corresponding normal cells, since this may reveal new therapeutic markers on primitive CML cells that can be selectively targeted.26 A similar approach recently allowed us to identify IL1RAP as a therapeutic target on CML stem cells.11,27 Of the 32 upregulated transcripts, we validated the cell surface protein expression of four previously well-studied molecules: IL1RAP, IL2RA, DPP4, and NCAM1.11–13,19,28 In addition, we identified seven novel cell surface markers expressed on primitive CML cells: CD36, LEPR (CD295), TFRC (CD71), ITGB3 (CD61), CD7, FCGR2A (CD32), and GP6. Of these markers, ITGB3 has been shown to be upregulated and functionally important for the growth and homing of AML cells,29 and TFRC has been described to be expressed at various levels in AML.30 However, we found that only CD36 and LEPR were specifically upregulated on primitive CML cells when compared to corresponding cells from healthy BM.
The CD36 molecule is a heavily glycosylated transmembrane protein and scavenger receptor expressed in adipose tissue as well as on thrombocytes, monocytes and macrophages with a role in phagocytosis.31 It has been suggested to have a role in the formation of atherosclerotic plaques and the associated inflammation.32 Interestingly, the expression of CD36 was recently shown to demark a metabolically distinct and treatment refractory subgroup of leukemic stem cells in AML and blast crisis CML.33 Moreover, CD36 has been shown to be essential in the metastatic spread of several forms of cancer.34 CD36 antibodies were found to block metastasis in xenograft models of oral carcinoma, malignant melanoma and breast cancer, possibly by interfering with the metabolic use of fatty acids.34 However, the expression of CD36 and its putative therapeutic importance in chronic phase CML has not been addressed thus far. We found that CD36 is upregulated on CD34+CD38low CML cells. Interestingly, we also discovered that the CD36 expressing subpopulation within the CD34+CD38lowIL1RAP+ CML fraction was less sensitive to imatinib treatment, and that these cells could be specifically killed by ADCC using CD36 antibodies. IL1RAP targeting has been shown to induce killing of CML cells in a similar fashion,11,27 but herein we describe that CD36 antibodies specifically target a cell population within the IL1RAP expressing population that is less sensitive to imatinib. This could provide new means with which to target the cells responsible for relapse after imatinib cessation. However, whether targeting IL1RAP or CD36 would be the best approach remains unclear; it is possible that it could be beneficial to target both markers for a potentially additive effect.
Many CML patients are treated with imatinib, and we therefore sought to determine the effect of imatinib on CD36 expression. However, CD36 expression is distinctly reduced during in vitro culture even in the absence of imatinib. Instead, a more direct approach was used, and we show that CD36 expression within the primitive CD34+CD38low population is drastically decreased during the first three months of therapy. It remains of interest, but is unclear whether the repeated measure of CD36 expression could act as a surrogate for response during imatinib treatment.
In addition to CD36, we also found LEPR to be upregulated on primitive CML cells. LEPR is the receptor for the well-studied peptide hormone leptin, which is mainly produced by adipocytes and is known to be involved in the regulation of bodyweight, BM microenvironment, normal hematopoiesis, and proliferation of AML cells.35–41 We observed no growth promoting effects in vitro on primitive CML cells following stimulation by the ligand leptin, but the mechanism of action in CML could be different. Indeed, we note with interest that both CD36 and LEPR are involved in adipose tissue homeostasis, and a potential interplay between the adipocyte containing BM microenvironment and CML stem cells could provide important growth or survival signals for the neoplastic stem cells.
In conclusion, we herein identify upregulation of several novel cell surface markers, including CD36 and LEPR, on primitive CML cells that may provide novel ways to study and target CML stem cells. In addition, we define CD36 as a marker of cells within the primitive CML cell population in chronic phase CML with decreased sensitivity to imatinib that are vulnerable to antibody-based therapeutic targeting.
Supplementary Material
Acknowledgments
The authors would like to thank the Nordic CML Study Group for their help in obtaining and distributing the CML samples between the Nordic countries, in particular we wish to thank Kimmo Porkka, Jesper Stentoft, Bjørn Tore Gjertsen, Jeroen Janssen, Kourosh Lotfi, Leif Stenke, and Ulla Strömberg. The NordCML006 and the BFORE studies were supported by research funding from Bristol-Myers Squibb and Pfizer, respectively. In addition, we wish to thank Linda Magnusson for critical experimental assistance.
Footnotes
Check the online version for the most updated information on this article, online supplements, and information on authorship & disclosures: www.haematologica.org/content/103/3/447
Funding
This work was supported by the Swedish Cancer Society, the Swedish Children’s Cancer Foundation, the Medical Faculty of Lund University, the Swedish Research Council, BioCARE, and the ISREC Foundation by a joint grant to Swiss Cancer Center, Lausanne, CREATE Health Cancer Center, and the Medical Faculty of Lund University from the Biltema Foundation. SM is supported by the Finnish Cancer Institute.
References
- 1.Ren R. Mechanisms of BCR–ABL in the pathogenesis of chronic myelogenous leukaemia. Nat Rev Cancer. 2005;5(3):172–183. [DOI] [PubMed] [Google Scholar]
- 2.Holyoake TL, Vetrie D. The chronic myeloid leukemia stem cell: stemming the tide of persistence. Blood. 2017;129(12):1595–1606 [DOI] [PubMed] [Google Scholar]
- 3.Baccarani M, Deininger MW, Rosti G, et al. European LeukemiaNet recommendations for the management of chronic myeloid leukemia: 2013. Blood. 2013;122(6):872–884. [DOI] [PMC free article] [PubMed] [Google Scholar]
- 4.Mahon FX, Etienne G. Deep molecular response in chronic myeloid leukemia: the new goal of therapy? Clin Cancer Res. 2014. January 16;20(2):310–322. [DOI] [PubMed] [Google Scholar]
- 5.Saussele S, Richter J, Hochhaus A, Mahon FX. The concept of treatment-free remission in chronic myeloid leukemia. Leukemia. 2016;30(8):1638–1647. [DOI] [PMC free article] [PubMed] [Google Scholar]
- 6.Jiang X, Zhao Y, Smith C, et al. Chronic myeloid leukemia stem cells possess multiple unique features of resistance to BCR-ABL targeted therapies. Leukemia. 2007;21(5):926–935. [DOI] [PubMed] [Google Scholar]
- 7.Corbin AS, Agarwal A, Loriaux M, Cortes J, Deininger MW, Druker BJ. Human chronic myeloid leukemia stem cells are insensitive to imatinib despite inhibition of BCR-ABL activity. J Clin Invest. 2011;121(1):396–409. [DOI] [PMC free article] [PubMed] [Google Scholar]
- 8.Hamilton A, Helgason GV, Schemionek M, et al. Chronic myeloid leukemia stem cells are not dependent on Bcr-Abl kinase activity for their survival. Blood. 2012;119(6):1501–1510. [DOI] [PMC free article] [PubMed] [Google Scholar]
- 9.Chomel JC, Bonnet ML, Sorel N, et al. Leukemic stem cell persistence in chronic myeloid leukemia patients with sustained undetectable molecular residual disease. Blood. 2011;118(13):3657–3660. [DOI] [PMC free article] [PubMed] [Google Scholar]
- 10.Eisterer W, Jiang X, Christ O, et al. Different subsets of primary chronic myeloid leukemia stem cells engraft immunodeficient mice and produce a model of the human disease. Leukemia. 2005;19(3):435–441. [DOI] [PubMed] [Google Scholar]
- 11.Jaras M, Johnels P, Hansen N, et al. Isolation and killing of candidate chronic myeloid leukemia stem cells by antibody targeting of IL-1 receptor accessory protein. Proc Natl Acad Sci USA. 2010;107(37):16280–16285. [DOI] [PMC free article] [PubMed] [Google Scholar]
- 12.Herrmann H, Sadovnik I, Cerny-Reiterer S, et al. Dipeptidylpeptidase IV (CD26) defines leukemic stem cells (LSC) in chronic myeloid leukemia. Blood. 2014;123(25):3951–3962. [DOI] [PubMed] [Google Scholar]
- 13.Landberg N, Hansen N, Askmyr M, et al. IL1RAP expression as a measure of leukemic stem cell burden at diagnosis of chronic myeloid leukemia predicts therapy outcome. Leukemia. 2015;30(1):253–257. [DOI] [PubMed] [Google Scholar]
- 14.Warfvinge R, Geironson Ulfsson L, Sommarin MNE, et al. Single-cell molecular analysis defines therapy response and immunophenotype of stem cell subpopulations in CML. Blood. 2017;129(17):2384–2394. [DOI] [PMC free article] [PubMed] [Google Scholar]
- 15.Mustjoki S, Richter J, Barbany G, et al. Impact of malignant stem cell burden on therapy outcome in newly diagnosed chronic myeloid leukemia patients. Leukemia. 2013;27(7):1520–1526. [DOI] [PubMed] [Google Scholar]
- 16.Hjorth-Hansen H, Stenke L, Söderlund S, et al. Dasatinib induces fast and deep responses in newly diagnosed chronic myeloid leukaemia patients in chronic phase: clinical results from a randomised phase-2 study (NordCML006). Eur J Haematol. 2014;94(3):243–250. [DOI] [PMC free article] [PubMed] [Google Scholar]
- 17.Kim D, Pertea G, Trapnell C, Pimentel H, Kelley R, Salzberg SL. TopHat2: accurate alignment of transcriptomes in the presence of insertions, deletions and gene fusions. Genome Biol. 2013;14(4):R36. [DOI] [PMC free article] [PubMed] [Google Scholar]
- 18.Trapnell C, Williams BA, Pertea G, et al. Transcript assembly and quantification by RNA-Seq reveals unannotated transcripts and isoform switching during cell differentiation. Nat Biotechnol. 2010;28(5):511–515. [DOI] [PMC free article] [PubMed] [Google Scholar]
- 19.Janssen JJWM, Deenik W, Smolders KGM, et al. Residual normal stem cells can be detected in newly diagnosed chronic myeloid leukemia patients by a new flow cytometric approach and predict for optimal response to imatinib. Leukemia. 2011;26(5):977–984. [DOI] [PubMed] [Google Scholar]
- 20.Iwasaki M, Liedtke M, Gentles AJ, Cleary ML. CD93 marks a non-quiescent human leukemia stem cell population and is required for development of MLL-rearranged acute myeloid leukemia. Cell Stem Cell. 2015;17(4):412–421. [DOI] [PMC free article] [PubMed] [Google Scholar]
- 21.Kinstrie R, Horne GA, Morrison H, et al. CD93 is a novel biomarker of leukemia stem cells in chronic myeloid leukemia. Blood. 2015;126(23):49. [Google Scholar]
- 22.Tartaglia LA. The Leptin Receptor. J Biol Chem. 1997;272(10):6093–6096. [DOI] [PubMed] [Google Scholar]
- 23.Dick JE. Stem cell concepts renew cancer research. Blood. 2008;112(13):4793–4807. [DOI] [PubMed] [Google Scholar]
- 24.Diaz-Blanco E, Bruns I, Neumann F, et al. Molecular signature of CD34+ hematopoietic stem and progenitor cells of patients with CML in chronic phase. Leukemia. 2007;21(3):494–504. [DOI] [PubMed] [Google Scholar]
- 25.Gerber JM, Gucwa JL, Esopi D, et al. Genome-wide comparison of the transcriptomes of highly enriched normal and chronic myeloid leukemia stem and progenitor cell populations. Oncotarget. 2013;4(5):715–728. [DOI] [PMC free article] [PubMed] [Google Scholar]
- 26.Majeti R. Monoclonal antibody therapy directed against human acute myeloid leukemia stem cells. Oncogene. 2010;30(9):1009–1019. [DOI] [PubMed] [Google Scholar]
- 27.Ågerstam H, Hansen N, Palffy von S, et al. IL1RAP antibodies block IL-1–induced expansion of candidate CML stem cells and mediate cell killing in xenograft models. Blood. 2016;128(23):2683–2693. [DOI] [PubMed] [Google Scholar]
- 28.Sadovnik I, Hoelbl-Kovacic A, Herrmann H, et al. Identification of CD25 as dependent growth-regulator of leukemic stem cells. Clin Cancer Res. 2016;22(8):2051–2061. [DOI] [PMC free article] [PubMed] [Google Scholar]
- 29.Miller PG, Al-Shahrour F, Hartwell KA, et al. In vivo RNAi screening identifies a leukemia-specific dependence on integrin beta 3 signaling. Cancer Cell. 2013;24(1):45–58. [DOI] [PMC free article] [PubMed] [Google Scholar]
- 30.Liu Q, Wang M, Hu Y, et al. Significance of CD71 expression by flow cytometry in diagnosis of acute leukemia. Leuk Lymphoma. 2014;55(4):892–898. [DOI] [PubMed] [Google Scholar]
- 31.Silverstein RL, Febbraio M. CD36, a scavenger receptor involved in immunity, metabolism, angiogenesis, and behavior. Sci Signal. 2009;2(72):re3. [DOI] [PMC free article] [PubMed] [Google Scholar]
- 32.Harb D, Bujold K, Febbraio M, Sirois MG, Ong H, Marleau S. The role of the scavenger receptor CD36 in regulating mononuclear phagocyte trafficking to atherosclerotic lesions and vascular inflammation. Cardiovasc Res. 2009;83(1):42–51. [DOI] [PubMed] [Google Scholar]
- 33.Ye H, Adane B, Khan N, et al. Leukemic stem cells evade chemotherapy by metabolic adaptation to an adipose tissue niche. Cell Stem Cell. 2016;19(1):23–37. [DOI] [PMC free article] [PubMed] [Google Scholar]
- 34.Pascual G, Avgustinova A, Mejetta S, et al. Targeting metastasis-initiating cells through the fatty acid receptor CD36. Nature. 2016;541(7635):41–45. [DOI] [PubMed] [Google Scholar]
- 35.Mantzoros CS, Magkos F, Brinkoetter M, et al. Leptin in human physiology and pathophysiology. Am J Physiol Endocrinol Metab. 2011;301(4):E567–84. [DOI] [PMC free article] [PubMed] [Google Scholar]
- 36.Chen H, Charlat O, Tartaglia LA, et al. Evidence that the diabetes gene encodes the leptin receptor: identification of a mutation in the leptin receptor gene in db/db mice. Cell. 1996;84(3):491–495. [DOI] [PubMed] [Google Scholar]
- 37.Bennett BD, Solar GP, Yuan JQ, Mathias J, Thomas GR, Matthews W. A role for leptin and its cognate receptor in hematopoiesis. Curr Biol. 1996;6(9):1170–1180. [DOI] [PubMed] [Google Scholar]
- 38.Feldmana DE, Chena C, Punjb V, Hidekazu Tsukamotoc DE, Machida K. Pluripotency factor-mediated expression of the leptin receptor (OB-R) links obesity to oncogenesis through tumor-initiating stem cells. Proc Natl Acad Sci USA. 2012;109(3):829–834. [DOI] [PMC free article] [PubMed] [Google Scholar]
- 39.Yue R, Zhou BO, Shimada IS, Zhao Z, Morrison SJ. Leptin receptor promotes adipogenesis and reduces osteogenesis by regulating mesenchymal stromal cells in adult bone marrow. Cell Stem Cell. 2016;18(6):782–796. [DOI] [PubMed] [Google Scholar]
- 40.Uddin S, Mohammad RM. Role of leptin and leptin receptors in hematological malignancies. Leuk Lymphoma. 2016;57(1):10–16. [DOI] [PubMed] [Google Scholar]
- 41.Ozturk K, Avcu F, Ural AU. Aberrant expressions of leptin and adiponectin receptor iso-forms in chronic myeloid leukemia patients. Cytokine. 2012;57(1):61–67. [DOI] [PubMed] [Google Scholar]
Associated Data
This section collects any data citations, data availability statements, or supplementary materials included in this article.


