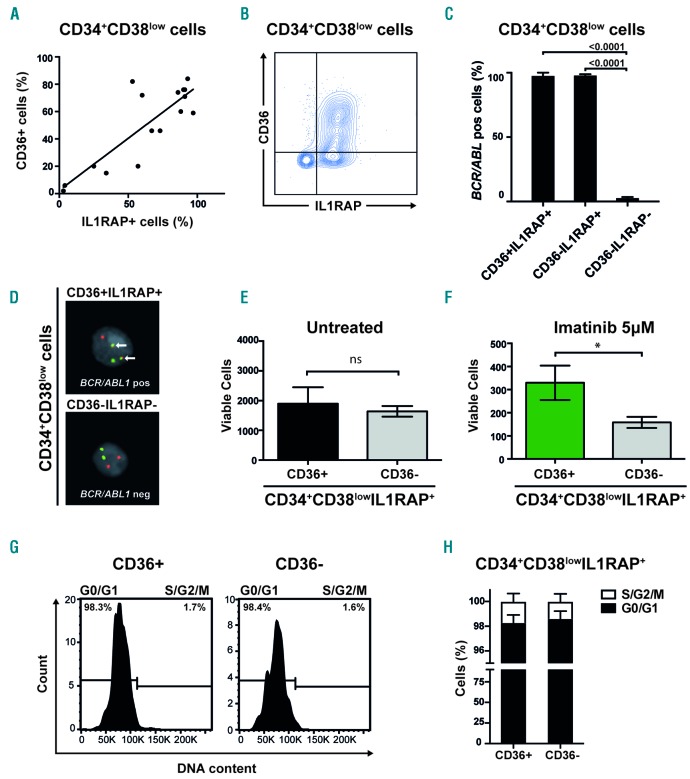
Figure 3.
A subgroup of primitive CML cells less sensitive to imatinib express CD36 (A) Linear regression and Spearman’s rank correlation show significant correlation between IL1RAP and CD36 expression in primitive CML cells, Y=0.76X + 2.4; r=0.68, P=0.0048. (B) Contour plot of co-expression of IL1RAP and CD36 in a representative CML sample (CML #5). (C) FISH on sorted cells from three CML patients showed a mean of 98% BCR/ABL1 positive cells within CD34+CD38lowIL1RAP+CD36+ cells and 98% BCR/ABL1 positive cells within CD34+CD38lowIL1RAP+CD36− cells. In the CD34+CD38lowIL1RAP−CD36− cell fraction a mean of 3% were BCR/ABL1 positive; mean based on cells from two CML patients, the third patient had no cells with a CD34+CD38lowIL1RAP−CD36− phenotype. (D) FISH showing a BCR/ABL1 positive (upper panel) and negative (lower panel) cell. (E) CD34+CD38lowIL1RAP+ CML cells FACS sorted according to CD36 expression does not appear to differ in cell growth and survival in vitro. The mean of three CML samples is shown; error bars depict standard deviation. (F) CD34+CD38lowIL1RAP+ CML cells FACS sorted according to CD36 expression and treated with imatinib at a concentration of 5μM show that CD36 expressing cells are more resistant to imatinib treatment in vitro. The mean of three CML samples is shown; error bars depict standard deviation. (G) Representative histograms from cell cycle analysis using DRAQ5 to determine DNA content show a majority of both CD36+ and CD36− cells in G0/G1 phase within the CD34+CD38lowIL1RAP+ population. (H) Data on cell cycle status from three CML patient samples are summarized showing mean and standard deviation. *P<0.05. ns; not significant.

