

Abstract
Key points
Oxygen pressure gradients across the microvascular walls are essential for oxygen diffusion from blood to tissue cells. At any given flux, the magnitude of these transmural gradients is proportional to the local resistance.
The greatest resistance to oxygen transport into skeletal muscle is considered to reside in the short distance between red blood cells and myocytes. Although crucial to oxygen transport, little is known about transmural pressure gradients within skeletal muscle during contractions.
We evaluated oxygen pressures within both the skeletal muscle microvascular and interstitial spaces to determine transmural gradients during the rest–contraction transient in anaesthetized rats.
The significant transmural gradient observed at rest was sustained during submaximal muscle contractions.
Our findings support that the blood–myocyte interface provides substantial resistance to oxygen diffusion at rest and during contractions and suggest that modulations in microvascular haemodynamics and red blood cell distribution constitute primary mechanisms driving increased transmural oxygen flux with contractions.
Abstract
Oxygen pressure () gradients across the blood–myocyte interface are required for diffusive O2 transport, thereby supporting oxidative metabolism. The greatest resistance to O2 flux into skeletal muscle is considered to reside between the erythrocyte surface and adjacent sarcolemma, although this has not been measured during contractions. We tested the hypothesis that O2 gradients between skeletal muscle microvascular () and interstitial () spaces would be present at rest and maintained or increased during contractions. and were determined via phosphorescence quenching (Oxyphor probes G2 and G4, respectively) in the exposed rat spinotrapezius during the rest–contraction transient (1 Hz, 6 V; n = 8). was higher than in all instances from rest (34.9 ± 6.0 versus 15.7 ± 6.4) to contractions (28.4 ± 5.3 versus 10.6 ± 5.2 mmHg, respectively) such that the mean gradient throughout the transient was 16.9 ± 6.6 mmHg (P < 0.05 for all). No differences in the amplitude of fall with contractions were observed between the microvasculature and interstitium (10.9 ± 2.3 versus 9.0 ± 3.5 mmHg, respectively; P > 0.05). However, the speed of the fall during contractions was slower than that of (time constant: 12.8 ± 4.7 versus 9.0 ± 5.1 s, respectively; P < 0.05). Consistent with our hypothesis, a significant transmural gradient was sustained (but not increased) from rest to contractions. This supports that the blood–myocyte interface is the site of a substantial gradient driving O2 diffusion during metabolic transients. Based on Fick's law, elevated O2 flux with contractions must thus rely primarily on modulations in effective diffusing capacity (mainly erythrocyte haemodynamics and distribution) as the gradient is not increased.
Keywords: diffusion, dynamics, kinetics, oxygen gradients
Key points
Oxygen pressure gradients across the microvascular walls are essential for oxygen diffusion from blood to tissue cells. At any given flux, the magnitude of these transmural gradients is proportional to the local resistance.
The greatest resistance to oxygen transport into skeletal muscle is considered to reside in the short distance between red blood cells and myocytes. Although crucial to oxygen transport, little is known about transmural pressure gradients within skeletal muscle during contractions.
We evaluated oxygen pressures within both the skeletal muscle microvascular and interstitial spaces to determine transmural gradients during the rest–contraction transient in anaesthetized rats.
The significant transmural gradient observed at rest was sustained during submaximal muscle contractions.
Our findings support that the blood–myocyte interface provides substantial resistance to oxygen diffusion at rest and during contractions and suggest that modulations in microvascular haemodynamics and red blood cell distribution constitute primary mechanisms driving increased transmural oxygen flux with contractions.
Introduction
The pathway for oxygen from lungs down to mitochondria involves a series of transfer steps within closely integrated systems (pulmonary, cardiovascular and metabolic) (Weibel, 1984). Minimal oxygen stores in most mammalian species mandate an exquisitely tight coupling between oxygen delivery and utilization (i.e. matching). Appropriate changes in flux rates through the O2 cascade are thus required to support alterations in oxidative metabolism. Within the skeletal muscle microcirculation, transcapillary O2 movement is dictated by the pressure gradient across and conductance of the boundary layer as described by Fick's law of diffusion: , where corresponds to the rate of O2 flux, is the diffusing capacity and is the O2 partial pressure difference between the microvascular and interstitial spaces ( and , respectively). This relationship establishes that elevations in O2 flux imposed by muscle contractions must be matched by commensurate changes in driving force (i.e. ) and/or effective diffusing capacity (; determined mainly by the aggregate number of red blood cells within capillaries adjacent to the myocyte at any given moment; Federspiel & Popel, 1986; Groebe & Thews, 1990).
The short diffusion distance from the red blood cell surface to muscle sarcolemma (i.e. encompassing plasma, endothelium and interstitium) is considered to pose the greatest resistance to O2 flux into the myocyte (Federspiel & Popel, 1986; Groebe & Thews, 1990; Honig & Gayeski, 1993; Wagner, 2000). Two main mechanisms are associated with this feature. First, absence of an O2 carrier (such as haemoglobin or myoglobin) negates facilitated transport in this diffusion path (also known as the carrier‐free region, CFR) (Honig & Gayeski, 1993). Second, because the entire O2 flux reaching the mitochondrial membrane traverses the capillary endothelium, high flux density (i.e. flux per unit area) within the CFR raises resistance as a result of (i) the particulate nature of blood (which renders only a fraction of the capillary surface area functional for O2 flux at any instant) and (ii) differences between capillary and mitochondria aggregate surface areas (the latter being at least two orders of magnitude greater than the former) (Federspiel & Popel, 1986; Groebe & Thews, 1990; Honig & Gayeski, 1993; Golub & Pittman, 2005). As such, the CFR constitutes a functional barrier to transcapillary O2 transport, thus predicting a relatively large gradient between the microvascular and interstitial spaces to support the presiding flux (Federspiel & Popel, 1986; Groebe & Thews, 1990; Honig & Gayeski, 1993; Wagner, 2000).
Oxygen gradients within the skeletal muscle microcirculatory network have been evaluated using a variety of techniques, including oxygen microelectrodes, (cryo)microspectrophotometry, proton magnetic resonance spectroscopy and phosphorescence quenching (Tsai et al. 2003; Pittman, 2011; Poole et al. 2011). An invaluable mechanistic framework for microcirculatory O2 transfer has been acquired with these tools since the work by August Krogh in skeletal muscle capillaries during the early 20th century (Krogh, 1919a, b). Unfortunately, experimental challenges (e.g. microelectrode catchment volumes, inability to obtain continuous data and an inability to assess haeme protein‐free compartments) have limited the investigation of skeletal muscle and , particularly during the rest–contraction transient. This is not a trivial issue but rather represents a critical obstacle to evaluating the dynamics of transcapillary (i.e. the sole driving force for blood–myocyte O2 flux) and, consequently, resolving control mechanisms of muscle energetics and oxidative function (Rossiter, 2011; Poole & Jones, 2012). Among the techniques available presently, phosphorescence quenching is suitable for the continuous assessment of transcapillary with excellent temporal resolution and precision during metabolic transitions (Rumsey et al. 1988; Behnke et al. 2001; Smith et al. 2002; Poole et al. 2004). Phosphorescent probes can be used to interrogate separate physiological compartments within the contracting skeletal muscle (Dunphy et al. 2002; Esipova et al. 2011) but, to date, the dynamics of (and, thus, transcapillary ) have not been described formally and remain undefined.
The present study aimed to examine the dynamics of skeletal muscle and to determine transcapillary O2 gradients during the rest–contraction transient. Given the substantial resistance to blood–myocyte O2 flux within the CFR (Federspiel & Popel, 1986; Groebe & Thews, 1990; Honig & Gayeski, 1993), we tested the hypothesis that gradients between the microvascular and interstitial spaces would be present at rest and either maintained or increased during contractions. A multifaceted approach involving experimental and theoretical methods was used to examine skeletal muscle and (and thus ; phosphorescence quenching), extracellular and intracellular compartments (transmission electron microscopy; TEM), as well as the impact of altered on transcapillary dynamics (computer simulations) from rest to contractions.
Methods
Ethical approval
All procedures and protocols were approved by the Institutional Animal Care and Use Committee of Kansas State University, followed guidelines established by the National Institutes of Health and were conducted in accordance with the ethical standards mandated by the Journal of Physiology (Grundy, 2015). Rats were maintained in accredited animal facilities (Association for the Assessment and Accreditation of Laboratory and Animal Care) under a 12:12 h light/dark cycle with food and water provided ad libitum.
Phosphorescence quenching determination of and
Phosphorescence quenching experiments were performed on a total of 12 young male Sprague–Dawley rats (∼3–4 months old; Charles Rivers Laboratories; Boston, MA, USA) to examine microvascular and interstitial PO2 responses. Preliminary experiments (n = 4) confirmed confinement of the G4 probe to the interstitial space and also that the phosphorescence signal overlap precludes and measurements in the same muscle (data not shown; Dunphy et al. 2002; Esipova et al. 2011). Accordingly, phosphorescence quenching results are reported below for a total of eight animals (body mass: 396 ± 67 g).
Surgical instrumentation and experimental protocol
On the day of data collection, rats were anaesthetized initially with a 5% isoflurane–O2 mixture and maintained on 2–3% isoflurane‐O2 (Butler Animal Health Supply, Dublin, OH, USA). Anaesthetized rats were kept on a heating pad to maintain core temperature, as measured via a rectal probe, at ∼37–38°C. The right carotid artery was cannulated (PE‐10 connected to PE‐50; Intra‐Medic polyethylene tubing; BD, Franklin Lakes, NJ, USA) for continuous measurements of mean arterial pressure and heart rate (MAP and HR, respectively; BPA model 200; Digi‐Med, Louisville, KY, USA) and infusion of the phosphorescent probe Oxyphor G2 (see below). The caudal artery was cannulated (PE‐10 connected to PE‐50) for blood sampling and infusion of anaesthetic agents. Arterial blood samples were obtained at the end of each experimental condition (i.e. G2 and G4) for determination of O2 saturation, systemic haematocrit and plasma lactate (Nova Stat Profile M; Nova Biomedical, Waltham, MA, USA).
Following catheter placement procedures, isoflurane inhalation was discontinued progressively and rats were kept under anaesthesia with pentobarbital sodium (3.5–7.0 mg kg−1) throughout the experiment. The level of anaesthesia was monitored at frequent and regular intervals via the toe‐pinch and blink reflexes and supplemented as necessary. As a result of overlapping spectral features of G2 and G4 probes (Dunphy et al. 2002; Esipova et al. 2011), separate measurements of resting and contracting muscle (left spinotrapezius; first protocol; G4 probe) and (right spinotrapezius; second protocol; G2 probe) were performed in the same animals, as described below. Notably, our previous investigations found no significant differences in blood flow or between measurements performed in the left versus right spinotrapezius of the same animals (Bailey et al. 2000). The spinotrapezius preparation also exhibits reproducible resting and contracting muscle blood flow, O2 utilization and responses with no time‐related or ordering effects (Hirai et al. 2013).
Overlying skin and fascia from the mid‐dorsal region were reflected to expose initially the left spinotrapezius muscle. The exposed muscle was moistened frequently via superfusion of Krebs–Henseleit bicarbonate‐buffered solution (in mm) (4.7 KCl, 2.0 CaCl2, 2.4 MgSO4, 131 NaCl and 22 NaHCO3; pH 7.4; equilibrated with 5% CO2 and 95% N2 at ∼38°C), whereas surrounding tissue was covered with Saran wrap (Dow Brands; Indianapolis, IN, USA). Platinum iridium electrodes were sutured to the rostral (cathode) and caudal (anode) regions of the muscle for electrically‐induced contractions. Previous reports from our laboratory demonstrate that these surgical procedures do not impair the microvascular integrity or responsiveness of the rat spinotrapezius muscle (Bailey et al. 2000). The Oxyphor probe G4 [Pd‐meso‐tetra‐(3,5‐dicarboxyphenyl)‐tetrabenzoporphyrin; 10 μm solution] was delivered directly to the tissue compartment of the left spinotrapezius muscle via the microinjection technique (Smith et al. 2002) for determination of responses. Approximately four separate G4 microinjections (5–10 μL each) were performed with a 29 gauge needle and a 1 mL syringe (Exelint International, Redondo Beach, CA, USA) along the length of the muscle dorsal aspect. A minimum of 15 min was allowed for uniform distribution of the injected probe in the muscle. Subsequently, submaximal twitch contractions were evoked for 3 min via electrical stimulation (1 Hz, 6 V and 2 ms pulse duration; model s48; Grass Technologies, Quincy, MA, USA). This stimulation protocol elicits an ∼4‐ to 5‐fold increase in blood flow together with an ∼6‐ to 7‐fold increase in metabolic rate above resting with either minor or no alterations in blood pH consistent with moderate intensity exercise (Behnke et al. 2001; Hirai et al. 2013). The current anaesthetized preparation retains vasomotor control such that muscle blood flow increases in the same proportion with O2 utilization as found in the exercising human (i.e. 5–6 L min−1: 1 L min−1) (Ferreira et al. 2006; Poole et al. 2011).
Upon completion of the first protocol (i.e. evaluation of in the left spinotrapezius muscle with the G4 probe), electrodes were removed carefully and the muscle was covered with Saran wrap. The right spinotrapezius was then exposed and electrodes sutured as described above. The Oxyphor probe G2 (Pd‐meso‐tetra‐(4‐carboxyphenyl)‐porphyrin; 15–20 mg kg−1 dissolved in 0.4 mL of saline) was infused into the carotid artery catheter as a bolus for evaluation of the right spinotrapezius muscle (i.e. second protocol). G2 contains Pd‐porphyrin cores that bind to biological macromolecules (principally albumin in blood plasma) (Wilson et al. 2006). This facilitates its uniform distribution in the plasma providing a lumped signal arising from arterioles, capillaries and venules in proportion to their volumetric contribution within the interrogated field. The largest contributor to this signal is the aggregate capillary volume, which constitutes ∼85% of the rat skeletal muscle vascular volume (Poole et al. 1995, 2004; Behnke et al. 2001). As such, the G2 signal reflects the within the microvascular compartment at the primary site of diffusive O2 transport in contracting skeletal muscle (i.e. mainly the within capillaries). Accordingly, the signal demonstrates strikingly similar temporal profiles to changes in intracellular PO2 (Hogan, 2001), arteriovenous O2 content difference (Ca–vO2) (Grassi et al. 1996, 2002) and deoxygenated haemoglobin (HHb, via near‐infrared spectroscopy) (Grassi et al. 2003) from rest to muscle contractions. A stabilization period of at least 15 min was allowed prior to muscle electrical stimulation using the same parameters as described above for the first protocol. At the end of the second experimental protocol, rats were killed with intra‐arterial pentobarbital sodium overdose (>50 mg kg−1).
Muscle measurements
Spinotrapezius muscle and were measured via phosphorescence quenching using a frequency domain phosphorometer (PMOD 5000; Oxygen Enterprises; Philadelphia, PA, USA) and the phosphorescent probes Oxyphor G2 (Dunphy et al. 2002) and G4 (Esipova et al. 2011), respectively. Both probes are highly soluble in aqueous media (e.g. blood plasma, interstitial fluid) and do not permeate biological membranes within skeletal muscle (Dunphy et al. 2002; Poole et al. 2004; Esipova et al. 2011). Although G2 binds to albumin in the blood forming complexes that serve as oxygen sensors, G4 operates in aqueous environments independently of albumin as a result of its unique polyethyleneglycol surface layer. Although G4 allows PO2 measurements within either the microvascular or interstitial compartments, it has been employed predominantly in the evaluation of given that relatively small amounts are required for such measurements (Esipova et al. 2011; Yu et al. 2013; Zhang et al. 2015). The G2 probe has been used traditionally for measurements (Dunphy et al. 2002; Wilson et al. 2006; Yu et al. 2013). The principles of the phosphorescence quenching technique have been described in detail previously (Behnke et al. 2001). Briefly, the technique applies the Stern–Volmer relationship (Rumsey et al. 1988), which describes quantitatively the O2 dependence of the phosphorescent probes as:
where k Q is the quenching constant and τo and τ are the phosphorescence lifetimes in the absence of O2 and at a given , respectively. Probe‐specific values of k Q and τo in the physiological range (pH ∼7.4 and temperature of 38°C) are 273 mmHg−1 s−1 and 251 μs for G2 and 304 mmHg−1 s−1 and 218 μs for G4, respectively (Dunphy et al. 2002; Esipova et al. 2011). Spinotrapezius muscle surface temperature was measured using a non‐contact infrared thermometer and k Q and τo adjusted accordingly. Phosphorescence lifetimes τ are independent of the local probe concentration and insensitive to endogenous chromophores and fluorophores (Wilson et al. 2006; Yu et al. 2013; Zhang et al. 2015). The common end of the bifurcated light guide was placed 2–4 mm superficial to the dorsal surface of the exposed spinotrapezius muscles. The phosphorometer modulates sinusoidal excitation frequencies between 100 Hz and 20 kHz that allow phosphorescence lifetime measurements from 10 μs to ∼2.5 ms. The excitation light (635 nm wavelength; penetration depth of ∼500 μm) was focused on a randomly selected surface area of ∼2 mm diameter of exposed muscle devoid of large vessels to minimize the potential for macrovascular influences. was recorded at intervals of 2 s during the entire rest–contraction protocol.
Analysis of muscle kinetics
The kinetics of and during the onset of contractions were described by non‐linear regression analysis using the Marquardt–Levenberg algorithm (SigmaPlot, version 11.2; Systat Software; San Jose, CA, USA). Transient profiles were fit with either a one‐ or two‐component model to describe, respectively, the absence or presence of a second, upward component of the response (i.e. ‘undershoot’) as:
- One component
- Two component
where is the at any given time t; corresponds to the pre‐contracting baseline ; A 1 and A 2 are the amplitudes for the first and second components, respectively; TD 1 and TD 2 are the independent time delays for each component; and τ1 and τ2 are the time constants (i.e. time taken to achieve 63% of the response) for each component. Goodness of fit and model parsimony were determined using three criteria: the coefficient of determination, sum of squared residuals and visual inspection. The mean response time (MRT) was used to describe the overall dynamics of the fall following the onset of contractions:
where TD 1 and τ1 are defined above. The MRT analysis was limited to the first component of the response given that inclusion of an emergent second component underestimates the actual speed of the fall for the onset of contractions (Hirai et al. 2009). The area under the and curves plotted as function of time (; mmHg.s) was calculated during the 3 min contraction period to provide an index of the overall muscle throughout the metabolic transient within each compartment (i.e. incorporating resting and contracting steady‐state , time delays, amplitudes and time constants of the responses) (Hirai et al. 2010).
Transmission electron microscopy (TEM)
TEM images of the spinotrapezius muscle were obtained for analysis of (i) the shortest distance from the red blood cell surface to muscle sarcolemma (i.e. CFR) and (ii) the relative volume occupied by the microvascular (lumen), interstitial and intracellular spaces. Samples were obtained from a subset of 16 young male Sprague–Dawley rats (Japan SLC, Inc., Shizuoka, Japan). These procedures followed guidelines established by the Physiological Society of Japan and the Journal of Physiology (Grundy, 2015) and were approved by the Institutional Animal Care and Use Committee of the University of Electro‐Communications. After each rat was anaesthetized with pentobarbital sodium as described above, the spinotrapezius muscle was carefully exposed and dissected. Rats were killed with intra‐arterial pentobarbital sodium overdose as described above. Tissue blocks (∼2 × 2 × 1 mm in size) were fixed in 2.5% glutaraldehyde (in 0.1 m phosphate buffer, pH 7.4), followed by postfixation with 1% osmium tetroxide in the same buffer at 4°C. Blocks were then dehydrated through a series of progressively higher concentrations of ethanol, cleared in propylene oxide and embedded in Epok 812 (Oken Shoji, Tokyo, Japan). Silver ultrathin cross sections (60–70 nm) were cut and stained with uranyl acetate and lead citrate. Samples were examined with an HT7700 transmission electron microscope (Hitachi, Tokyo, Japan) and micrographs taken at high magnification using the Soft Imaging System (Münster, Germany). Quantitative analyses were performed using ImageJ (National Institutes of Health, Bethesda, MD) from projected muscle transverse images. Compartment volume density was estimated via stereology in accordance with the Delesse principle as described previously (Weibel et al. 1966).
Simulated profiles
Mathematical modelling was used to examine how alterations in kinetics alone affect transcapillary during contractions. At a given , slow kinetics result from improved matching that is commonly seen after exercise training, for instance (Hirai et al. 2012). Conversely, fast kinetics reflect impaired muscle matching characteristic of advanced age and/or chronic diseases where kinetics are impaired to a greater extent than that of (Poole et al. 2011). Simulated profiles were obtained using different time constants for the first component (τ1; covering a total range of 16 s) and fixed baseline, amplitudes and time delays based on the present experimental observations (Table 1). Transcapillary dynamics were then determined as described above (i.e. ) with fixed kinetics parameters (for mean values employed in the present study, see Table 1). The assumption was made that microvascular and interstitial compartments are homogenous and free of diffusion limitation and anatomical or physiological shunts (Behnke et al. 2002; Hirai et al. 2009).
Table 1.
Spinotrapezius muscle and kinetics following the onset of contractions
|
|
|
|||
|---|---|---|---|---|
| (mmHg) | 34.9 ± 6.0 | 15.7 ± 6.4* | ||
| (mmHg) | 10.9 ± 2.3 | 9.0 ± 3.5 | ||
| (mmHg) | 24.0 ± 4.4 | 6.7 ± 6.8* | ||
| (mmHg) | 5.0 ± 1.7 | 4.2 ± 3.2 | ||
| (mmHg) | 28.4 ± 5.3 | 10.6 ± 5.2* | ||
| TD 1 (s) | 4.5 ± 3.4 | 7.5 ± 4.6 | ||
| TD 2 (s) | 42.6 ± 18.3 | 43.4 ± 19.0 | ||
| τ1 (s) | 9.0 ± 5.1 | 12.8 ± 4.7* | ||
| τ2 (s) | 59.4 ± 29.7 | 71.5 ± 45.3 | ||
| (mmHg s–1) | 1.46 ± 0.56 | 0.85 ± 0.59* | ||
| MRT (s) | 13.5 ± 5.0 | 20.3 ± 5.9* |
, microvascular ; , interstitial ; , resting baseline ; , amplitude of the first component; , lowest during the transient; A 2 , amplitude of the second component; , contracting steady‐state ; TD 1, time delay for the first component; TD 2, time delay for the second component; τ1, time constant for the first component; τ2, time constant for the second component; , rate of fall; MRT, mean response time. The two‐component exponential model was used to analyse kinetics in all but one instance. Values are the mean ± SD. * P < 0.05 versus .
Statistical analysis
Data comparisons were performed using a paired Student's t test or one‐way or two‐way repeated measures ANOVA where appropriate. Post hoc analyses were performed with the Student–Newman–Keuls test when a significant F ratio was detected. A one sample t test was used to determine differences from zero. Data are reported as the mean (SD) unless stated otherwise. P < 0.05 was considered statistically significant.
Results
Arterial blood samples and central haemodynamics
There were no differences in arterial O2 saturation (93.5 ± 2.9 and 96.3 ± 0.7%), systemic haematocrit (35.2 ± 2.5 and 34.2 ± 3.1%) or lactate concentration (1.4 ± 0.3 and 1.6 ± 0.3 mm) between and protocols, respectively (P > 0.05 for all). Similarly, there were no differences in MAP or HR from rest to contractions between protocols (P > 0.05 for all) (Fig. 1).
Figure 1. MAP and HR from rest to contractions.
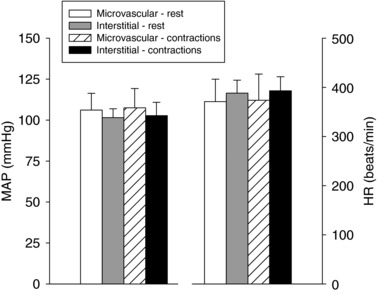
MAP and HR from rest to contractions during spinotrapezius muscle microvascular and interstitial measurement. Values are the mean ± SD.
Spinotrapezius muscle responses
Mean spinotrapezius muscle and during a resting period immediately preceding contractions are shown in Fig. 2. was higher than during the entire resting period (P < 0.05 for all data points). Importantly, there were no reductions in resting or over time (P > 0.05 for both) and linear regression slopes were not different from zero (0.014 ± 0.022 and −0.003 ± 0.019 mmHg s−1, respectively; P > 0.05 for both). These data indicate absence of accumulated oxygen photoconsumption by the phosphorescence quenching technique in the current experimental protocols (see Experimental considerations below).
Figure 2. Mean spinotrapezius PO2 within the microvascular and interstitial spaces at rest.
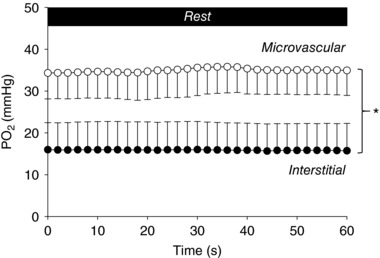
Mean spinotrapezius within the microvascular and interstitial spaces during a resting period preceding contractions. No significant reductions in resting were observed over time in either compartment (P > 0.05), refuting the possibility of accumulated oxygen photoconsumption by phosphorescence quenching in the current experimental protocols. Values are the mean ± SD. * P < 0.05 for microvascular versus interstitial for all data points. For further details, see text.
Mean spinotrapezius muscle and responses during the rest–contraction transient are shown in Fig. 3 (top) and the kinetics parameters derived from the model fits are presented in Table 1. was higher than in all instances during the steady‐state of contractions (P < 0.05 for both) (Fig. 4) such that the mean gradient () throughout the contraction protocol was 16.9 ± 6.6 mmHg (Fig. 3, bottom). This gradient was maintained during the metabolic transient given that no differences were observed between the resting baseline and contracting steady‐state values (19.2 ± 9.4 and 17.3 ± 6.5 mmHg, respectively; P > 0.05).
Figure 3. Spinotrapezius muscle , and from rest to contractions.
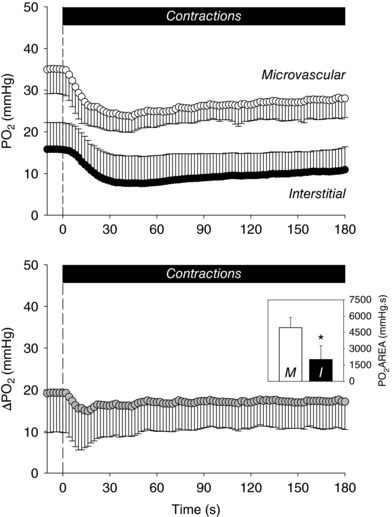
Top: mean spinotrapezius muscle and during the rest–contraction transient. Bottom: mean difference between muscle and from rest to contractions. Inset: mean values for the area under the curves () in the microvascular and interstitial spaces (M and I, respectively). was determined through integration of the area under the and curves over the 3 min stimulation period. Note the pronounced gradient between muscle microvascular and interstitial spaces from rest to contractions. Time zero depicts the onset of muscle contractions. Values are the mean ± SD. * P < 0.05 versus M.
Figure 4. Spinotrapezius muscle within the microvascular and interstitial spaces.
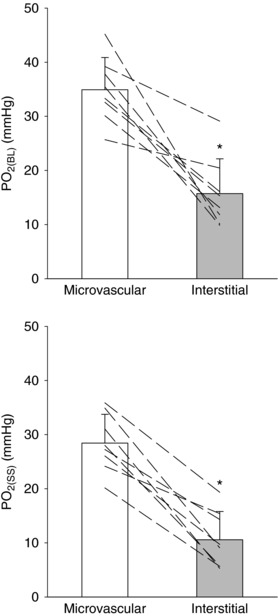
Mean and individual spinotrapezius muscle within the microvascular and interstitial spaces at rest (; top) and during the steady‐state of contractions (; bottom). Microvascular was higher than interstitial in all instances irrespective of metabolic status. Values are the mean ± SD. * P < 0.05 versus microvascular.
There were no differences in the magnitude of the fall induced by contractions (A 1 ) between the microvascular and interstitial spaces (P > 0.05) (Table 1). On the other hand, the speed of the fall during contractions was slower than that of (τ1, A 1 /τ1 and MRT; P < 0.05 for all) (Table 1). The differences between the and profiles during the rest–contraction transient were such that a substantially higher overall muscle oxygenation () was observed in the microvascular compared to interstitial space (P < 0.05) (Fig. 3, bottom, inset). Both and returned to resting baseline values within ∼3 min following the cessation of contractions (data not shown).
Transmission electron microscopy (TEM) images
The oxygen transport pathway from the red blood cell to skeletal muscle is shown in Fig. 5 (left). This cross‐sectional electron micrograph of the rat spinotrapezius depicts a red blood cell enclosed in a capillary, the interstitial space and adjacent muscle cell. Group and individual values for the shortest distance between the red blood cell surface and sarcolemma are given in Fig. 5 (right).
Figure 5. TEM of the rat spinotrapezius showing the oxygen transport pathway within the muscle microcirculation.
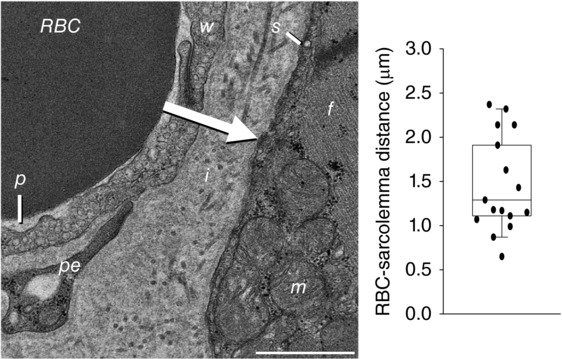
Left: cross‐sectional TEM image of the rat spinotrapezius showing the oxygen transport pathway from the red blood cell (RBC) to skeletal muscle. Note the thin plasma layer (p) between the RBC and capillary wall (w). The arrow illustrates the short distance between the RBC surface and the sarcolemma known as the carrier‐free region (CFR). i, interstitial space; s, sarcolemma; f, muscle fibre; m, mitochondrion; pe, pericyte. TEM magnification of 8000×. Scale bar = 1 μm. Right: quantitative analysis of TEM images showing the shortest distance between the RBC surface and adjacent sarcolemma (i.e. CFR). The boxplot depicts the median, interquartile range and individual values (n = 16).
The sequence of increasingly higher magnification TEM images in Fig. 6 (left A–D) shows the intracellular, interstitial and microvascular compartments within the rat spinotrapezius muscle. Relative volumes were different among each compartment such that intracellular > interstitial > microvascular (P < 0.05 for all) (Fig. 6, right).
Figure 6. TEM images of the rat spinotrapezius muscle showing the intracellular, interstitial and microvascular (lumen) compartments.
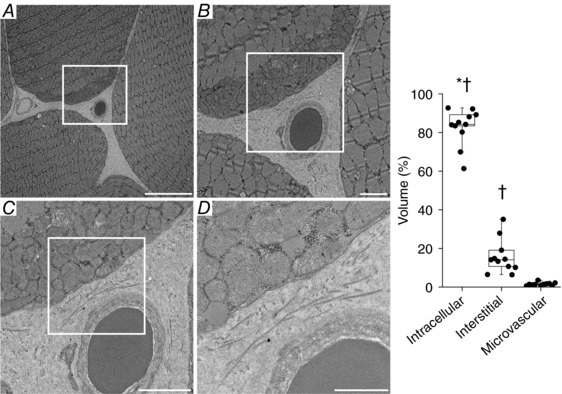
Left (A–D): cross‐sectional TEM images of the rat spinotrapezius muscle showing the intracellular, interstitial and microvascular (lumen) compartments. The sequence from (A) to (D) shows increasingly higher magnification images of the same field. Note that no red blood cell was sectioned on the left vessel in (A). TEM magnifications of 700×, 2000×, 4000× and 8000×, respectively. Scale bars = 10, 2, 2 and 1 μm, respectively. Right: quantitative analysis of TEM images showing the relative volume occupied by each compartment. It should be noted that microvascular volume calculations based on cross‐sectional TEM images reflect total (as opposed to functional) values therefore overestimating the volume fraction participating effectively in blood–myocyte O2 transport. The boxplots depict the median, interquartile range and individual values (n = 11). * P < 0.05 versus interstitial volume; †P < 0.05 versus microvascular volume.
Simulated PO2 profiles
The simulations presented in Fig. 7 demonstrate the impact of altered kinetics (τ1) (Fig. 7, top) on transcapillary responses during the rest–contraction transient (Fig. 7, bottom). Theoretical analyses reveal that progressively slower kinetics (i.e. increased τ1) elevate ΔPO2 across the early transient whereas faster kinetics (i.e. decreased τ1) subsequently diminish during contractions.
Figure 7. Simulated profiles illustrating the effects of altered dynamics on transcapillary Δ during the transition from rest to contractions.
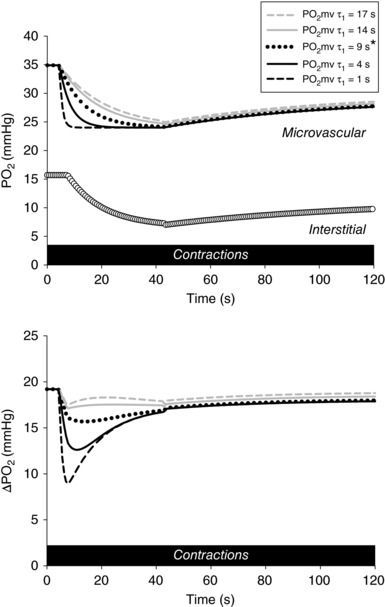
Top: simulated profiles with varying time constants for the first component (τ1) and fixed baseline, amplitudes and time delays. and profiles were generated based on mean values reported in Table 1. Bottom: effects of τ1 manipulations on transcapillary (i.e. ). Fixed kinetics parameters were used in these calculations. Note that progressively faster kinetics (i.e. smaller τ1; characteristic of aged and diseased states) lowers and thus the exclusive driving pressure for transmural O2 flux during the metabolic transient. Time zero depicts the onset of muscle contractions. *Mean response observed in the current study (Table 1). For further details, see text.
Discussion
The present study demonstrates, for the first time, that a significant O2 gradient between skeletal muscle microvascular and interstitial spaces is present at rest and maintained during submaximal twitch contractions. These data support that the short diffusion path between the red blood cell surface and the adjacent sarcolemma known as the CFR is the site of substantial resistance to blood–myocyte O2 transport. As dictated by Fick's law of diffusion, preservation of the driving force for O2 transfer from rest to contractions requires that transient elevations in O2 flux must be achieved predominantly via increases in effective diffusing capacity .
Transmural gradients within the microcirculation are required for diffusive O2 transport and, therefore, to support cellular oxidative metabolism. Experimental and theoretical evidence indicate that absence of facilitated transport compounded with high flux density confer substantial resistance to O2 flux upon the CFR (Federspiel & Popel, 1986; Groebe & Thews, 1990; Honig & Gayeski, 1993; Wagner, 2000). Interestingly, the expected large transmural based on these data is incompatible with the classical model proposed by Krogh for capillary O2 transport (Poole et al. 2011). Embedded in the Kroghian model are, however, assumptions not supported by current empirical evidence including (i) that microvascular blood can be regarded as a hemoglobin solution rather than a suspension of red blood cells; and (ii) uniform across the entire diffusion path from blood to mitochondria (Honig & Gayeski, 1993; cf. Golub & Pittman, 2005). Although adopted for the sake of mathematical expediency, these assumptions lack physiological fidelity when assigning diffusion distance as a major determinant of muscle (Bebout et al. 1993; Hepple et al. 2000; Wagner, 2000), therefore leading to the presumption of a shallow or non‐existent between the microvascular and interstitial spaces. It is pertinent that findings of very low and apparently spatially uniform intracellular in contracting skeletal muscle (Federspiel & Popel, 1986; Gayeski & Honig, 1986; Groebe & Thews, 1990; Honig & Gayeski, 1993; Richardson et al. 1995; Voter & Gayeski, 1995; Molé et al. 1999) also refute the relevance of overall diffusion distances to capillary–mitochondrial O2 flux (Poole et al. 2011). The wealth of compelling evidence gathered subsequent to the pioneering work by Krogh (1919a, b) has thus painted a different picture with regard to transcapillary within the skeletal muscle microcirculation. Re‐evaluation of these concepts has enabled the estimation of the drop per unit length of diffusion path to be of the order of 7 to 15–20 mmHg μm−1 across the CFR from low to high intensity of contractions (Popel et al. 1989; Groebe, 1990; Groebe & Thews, 1990; Honig & Gayeski, 1993; Honig et al. 1997).
As noted above, evaluation of skeletal muscle interstitial and, consequently, transmural has been hindered by technical challenges, particularly during metabolic transients. Techniques such as O2 microelectrodes are limited in evaluating these responses due to large catchment volumes, inherent vascular damage and measurement plane movement during muscle contractions. Microspectrophotometry and proton magnetic resonance spectroscopy are restricted to compartments containing haeme proteins (e.g. haemoglobin and myoglobin) and do not have access to the interstitial space. Selective in vivo measurements can thus be performed only via phosphorescence quenching at the present time (Wilson et al. 2006). It is noteworthy that, although previous phosphorescence quenching studies have examined transmural O2 gradients in other microcirculatory beds such as the mesentery and skin (Tsai et al. 1998; Cabrales et al. 2006; Golub et al. 2007, 2008), differences in vasomotor control and the small range of metabolic rates of parenchymal cells negate direct comparison with data from skeletal muscle.
Skeletal muscle dynamics
The few phosphorescence quenching studies to date that have assessed skeletal muscle from rest to contractions have yielded incongruent results. Resting values reported previously vary from ∼28 to 68 mmHg in the spinotrapezius muscle (Smith et al. 2002; Nugent et al. 2016). Moreover, limited temporal resolution has precluded kinetics analyses during the contraction transient in the past. Accordingly, the present study is the first to describe the dynamics of (and thus transmural ) in the skeletal muscle microcirculation during the transition from rest to contractions. Figure 3 (top) shows the temporal profile and Table 1 presents the kinetics parameters derived from model fits. Resting values observed in the present study were lower than those found previously using phosphorescence quenching as noted above (i.e. ∼28 and 68 mmHg) (Smith et al. 2002; Nugent et al. 2016). The reasons for this discrepancy are not entirely clear but could involve methodological aspects (e.g. spatial resolution, phosphorescent probe types and delivery routes, time versus frequency‐domain analysis; see also Experimental considerations below). The resting baseline observed in the present study is in close agreement with intracellular values obtained by others using microelectrodes (∼14–17 mmHg) (Whalen et al. 1974; Gorczynski & Duling, 1978) and cryomicrospectroscopy (myoglobin ranging from ∼10–20 mmHg) (Honig et al. 1997) but somewhat lower than proton magnetic resonance spectroscopy data (∼34 mmHg) (Richardson et al. 2006). The magnitude of the fall induced by moderate‐intensity twitch contractions in our protocol is smaller than that reported previously using higher intensities and contraction frequencies in the spinotrapezius muscle (∼20–30 mmHg) (Smith et al. 2002; Nugent et al. 2016), thus reflecting the imposed metabolic demand (Howlett & Hogan, 2001; Howlett et al. 2007). The measured in the present study during the early contraction transient (i.e. 0–60 s) (Fig. 3, top) fell towards values commensurate with intramyocyte PO2 in humans performing moderate exercise (∼5 mmHg) (Richardson et al. 1995; Molé et al. 1999). A higher during the contraction steady‐state was then attained in the present study due to the presence of a second, upward component of the response (i.e. ‘undershoot’; A 2 ).
A surprising result from the present study was the slower speed of fall following the onset of contractions (τ1, A 1 / τ1 and MRT) compared to that of (Fig. 3, top and Table 1). Potential mechanisms accounting for these findings involve differences in compartment volumes (Fig. 6, right). Considering that the interstitial space represents the interface between (and it is thus subjected to the influence of) the microvascular and intracellular domains, the same net O2 flux permeating these cascade steps could produce different deoxygenation rates (i.e. speed of fall) within each compartment during metabolic transitions. Slowing of kinetics could also be produced via O2 buffering by myoglobin (Clanton et al. 2013), particularly following contractions onset at a time when the myoglobin saturation is reaching its lowest value throughout the transient (Richardson et al. 1995; Molé et al. 1999) (Fig. 3). Another intriguing possibility relates to the O2 buffering by interstitial regions not contributing uniformly to flux throughout the metabolic transient (i.e. temporal and spatial heterogeneity) (Heinonen et al. 2015). Resolution of the mechanistic bases for these findings is beyond the scope of the present study and must await further research.
Radial O2 gradients in the skeletal muscle microcirculation
Dual probe phosphorescence quenching investigations targeting the skeletal muscle microvascular and interstitial spaces have also produced divergent data. Previous studies have evaluated the rat cremaster (Shibata et al. 2001), hamster cheek pouch (Carvalho & Pittman, 2008) and mouse thigh muscle (Wilson et al. 2006) transmural exclusively at rest. This gradient was found to be either very small (∼1 mmHg around 45 μm diameter arterioles and <1.5 mmHg across the capillary wall) (Wilson et al. 2006; Carvalho & Pittman, 2008) or relatively large (∼15–20 mmHg around arterioles of 40–130 μm diameter) (Shibata et al. 2001). The reasons for these disparities are unclear but could relate to differences in interrogated muscles and/or experimental conditions (similar to those described above for resting ). It is essential to appreciate that very small or non‐existent transmural PO2 gradients imply an equilibrium between blood and interstitium that is inconsistent with O2 loss from red blood cells along the length of the muscle microcirculation (i.e. longitudinal gradients) (Duling & Berne, 1970; Pittman, 2011). Moreover, a lack of radial gradients also suggests that the major resistance to capillary–mitochondrial O2 flux is located within the myocyte. This is incompatible with (i) low and apparently spatially uniform intramyocyte PO2 values found in both human and animal skeletal muscle from rest to contractions (Federspiel & Popel, 1986; Gayeski & Honig, 1986; Groebe & Thews, 1990; Honig & Gayeski, 1993; Richardson et al. 1995; Voter & Gayeski, 1995; Molé et al. 1999) and (ii) the role of myoglobin to facilitate diffusion, thus lowering intramyocyte resistance to O2 flux (Wittenberg & Wittenberg, 2003; Clanton et al. 2013).
On the other hand, relatively large transmural gradients (with a magnitude proportional to local resistance across the CFR) are absolutely necessary to drive O2 flux as dictated by Fick's law. Figure 3 depicts the transmural Δ obtained in the present study as the difference between the phosphorescence quenching signal from muscle microvascular and interstitial spaces. This gradient was preserved from rest to contractions despite different and kinetics as noted above (Table 1). Figure 4 shows that was higher than in all cases both at rest and during the contracting steady‐state. These results are partially consistent with those of Shibata et al. (2001), who found large transmural gradients in the resting cremaster muscle (i.e. ∼15–20 mmHg around first‐ and third‐order arterioles), albeit at considerably higher PO2 levels (microvascular: ∼47–75 mmHg; interstitial: ∼29–51 mmHg). The transmural O2 flux across the CFR in the resting muscle calculated in the present study (via Fick's law and tissue permeability, K = 3.17 × 10⁻¹⁰ ml O2 cm−1 s−1 mmHg−1) was ∼4.2 × 10⁻⁵ ml O2 cm−2 s−1 and is consistent with the physiological range estimated previously by Vadapalli et al. (2000). Furthermore, integration of phosphorescence quenching (Fig. 3, bottom) and TEM (Fig. 5, right) data reveals that the ΔPO2 across the rat spinotrapezius muscle CFR during moderate‐intensity contractions (∼11.6 mmHg μm−1) is in agreement with that predicted previously (from ∼7 to 15–20 mmHg μm−1 from low to high intensity of contractions as discussed above) (Popel et al. 1989; Groebe, 1990; Groebe & Thews, 1990; Honig & Gayeski, 1993; Honig et al. 1997).
Preservation of the driving force for O2 diffusion during the metabolic transient is remarkable given the increase in O2 flux imposed by muscle contractions and the prevailing high flux density across the CFR. This suggests that the rate of O2 diffusion from blood to myocyte is an important regulated variable in the microcirculation as considered earlier by Duling (1972, 1973). According to Fick's law, elevations in transcapillary with muscle contractions must thus rely predominantly on corresponding increases in effective in the face of unaltered (Richardson et al. 1995, 2006). This in turn places critical relevance on events modulating capillary haemodynamics considering that the primary determinant of muscle DO2 is the number of red blood cells adjacent to the muscle fibre at any given instant (Federspiel & Popel, 1986; Groebe & Thews, 1990). Because most capillaries support red blood cell flux in resting skeletal muscle, increased effective surface area within already flowing capillaries during contractions (i.e. longitudinal recruitment) (Poole et al. 2011) is achieved via elevations in red blood cell flux, velocity and haematocrit (Klitzman & Duling, 1979; Hudlická et al. 1982; Kindig et al. 2002). Intracellular mechanisms could also increase effective during the metabolic transient. That the range of values during the early contraction transient (Fig. 3, top) approximates the steep portion of the myoglobin oxygen dissociation curve could facilitate intramyocyte O2 diffusion and reduce/remove the impediment to O2 flux from the so‐called ‘functionally O2 carrier‐depleted region’ (Honig & Gayeski, 1993; Honig et al. 1997). Moreover, the possibility exists that ‘O2 channels’ (e.g. aquaporins) might facilitate transmembrane O2 movement and assist in modulation with contractions (Clanton et al. 2013).
Clinical implications
Investigation of gradients within the O2 transport pathway is crucial to resolve the mechanisms determining / matching in health and the dysfunction that plagues aged and diseased states. Structural and functional impairments within the skeletal muscle microcirculation in conditions such as chronic heart failure, diabetes and emphysema (Poole & Mathieu‐Costello, 1997; Richardson et al. 2003; Padilla et al. 2006; Copp et al. 2009) lower muscle drastically during metabolic transitions (i.e. leading to a faster fall) (Poole et al. 2001; Diederich et al. 2002; Behnke et al. 2005; Padilla et al. 2007). Conversely, adaptations along the O2 transport pathway promoted by exercise training are capable of raising responses following contractions (i.e. resulting in a slower fall) (Hirai et al. 2012), thus increasing the upstream O2 diffusion pressure for transcapillary flux.
Simulated profiles in Fig. 7 demonstrate how altered kinetics alone can modulate transmural Δ. Interestingly, as a result of the different and dynamics found during the rest–contraction transient (as discussed above and shown in Table 1), simulations with progressively faster kinetics (i.e. decreased τ1) produced larger effects on Δ than those evoked by slower kinetics (i.e. increased τ1). Any lowering of responses during the metabolic transient with advanced age and/or disease would exacerbate these reductions in . This theoretical analysis exposes the complex interplay between different diffusional compartments not recognized in the Kroghian model, thus providing the initial framework for investigating the dynamics of skeletal muscle transcapillary O2 transport in health and disease.
Experimental considerations
Some degree of O2 photoconsumption (photo‐oxidation) by phosphorescence quenching is inevitable but could be minimized/compensated for by O2 diffusion from surrounding tissue and/or utilization of small excitation area and low flash rates (Golub et al. 2007, 2008). Higher accumulated O2 depletion via photoconsumption in stationary relative to moving media (e.g. interstitium versus flowing blood) can underestimate PO2 values within the interstitial compartment, thus artefactually producing/maximizing transmural gradients (Tsai et al. 1998; Pittman, 2011). Figure 2 shows that no reductions in skeletal muscle or were observed over time during a resting period preceding contractions. This negates the possibility that an artefact introduced by phosphorescence quenching created or amplified transmural between the microvascular and interstitial spaces in the current experimental protocol.
The phosphorescence technique employed in the present study provides an average or lumped value in proportion to the volumetric contribution of each segment (i.e. mean capillary ) within the interrogated microvascular compartment, thereby precluding the analysis of its spatial distribution via histograms (e.g. upstream versus downstream values) (Behnke et al. 2001; Poole et al. 2004). Therefore, the current signal cannot discriminate any potential (i) longitudinal or intraluminal gradients within the microvascular network or (ii) heterogeneities among different vessels and/or branch orders based solely on the present data. Similar spatial heterogeneity considerations also apply to the signal recorded in the present study. Furthermore, because only male rats were investigated in the present study, an assessment of potential sex differences in contracting muscle microvascular and interstitial PO2 responses is warranted.
As noted above, preliminary experiments confirmed confinement of the G4 probe to the interstitial space via the microinjection technique as described previously by other research groups (Dunphy et al. 2002; Smith et al. 2002; Esipova et al. 2011). Specifically, moving the optical phosphorescence quenching light guide away from the microinjection site prevents the detection of any signal. This indicates that the interstitial G4 probe is localized to the site of interrogation and that no vascular contamination is induced by the technique, such as would be expected were there considerable damage to the tissue. In accordance with the latter, close inspection of the microinjection site via intravital microscopy (approximate magnification of 1200×) does not indicate widespread or gross structural damage to muscle fibres or vessels of the spinotrapezius muscle. Moreover, temporal profiles obtained in the present study during the rest–contractions transient closely resemble those of intracellular (Hogan, 2001), arteriovenous O2 content difference (Grassi et al. 1996, 2002), deoxygenated haemoglobin (Grassi et al. 2003) and (Behnke et al. 2002; present study) indicating preserved muscle metabolic and vascular control despite the inherent but limited trauma induced by microinjections. The novel dynamic profile reported in the present study is consistent with the expected range of interstitial values based on previous reports of intramyocyte (Richardson et al. 1995; Molé et al. 1999) and estimates of transmural PO2 gradients from rest to contractions (Popel et al. 1989; Groebe, 1990; Groebe & Thews, 1990; Honig & Gayeski, 1993; Honig et al. 1997), thus representing the intermediary step in the O2 transport cascade from microvascular blood to muscle cell.
Contrasting the range of values obtained in the present study (Figs. 3 and 4) with that reported for the intracellular space during submaximal and maximal contractions (i.e. ∼2–3 to 5 mmHg myoglobin ) (Richardson et al. 1995; Molé et al. 1999) suggests a relatively small gradient across the sarcolemma, thus placing the bulk (but by no means the entirety) of the peripheral resistance to diffusive O2 transport (and thus the largest drop across the muscle) at the microvascular–interstitium interface.
Interestingly, manipulations in the fraction of inspired O2 (; hypoxic and hyperoxic gas containing 12% and 100% O2, respectively) can produce corresponding changes in the maximal O2 uptake of trained individuals during small muscle mass exercise (Richardson et al. 1999a, b), suggesting that the maximally contracting myocyte could operate close to the steep portion of the mitochondrial respiration curve under some, but not all, circumstances (Scandurra & Gnaiger, 2010; Clanton et al. 2013).
Summary and conclusions
The present study describes for the first time the dynamics of skeletal muscle microvascular and interstitial to resolve transmural O2 gradients from rest to contractions. A significant transmural observed at rest was maintained during submaximal twitch contractions. These data support that the short diffusion path between the red blood cell and the adjacent sarcolemma (also known as the CFR) is the site of considerable resistance to blood–myocyte O2 transfer. As mandated by Fick's law of diffusion, maintenance of the sole driving force for transcapillary O2 movement from rest to contractions reveals that transient elevations in O2 flux must be achieved via corresponding increases in effective diffusing capacity (; determined principally by capillary red blood cell haemodynamics and distribution).
Additional information
Competing interests
The authors declare that they have no competing interests.
Author contributions
DMH, JCC, TDC, WLS, TIM and DCP conceived and designed the study. DMH, JCC, TDC, HE, YK, TIM and DCP acquired, analysed and interpreted the data. DMH prepared the first draft of the manuscript. All authors critically reviewed and approved the final version of the manuscript and agree to be accountable for all aspects of the work. The experiments were performed in the laboratories of Timothy I. Musch and David C. Poole (Kansas State University) and Yutaka Kano (University of Electro‐Communications). All persons designated as authors qualify for authorship, and all those who qualify for authorship are listed.
Funding
This work was supported in part by a Post‐Doctoral Fellowship from the College of Human Ecology, Kansas State University; and National Heart, Lung and Blood Institute Grant HL‐2‐108328.
Acknowledgements
We thank K. Sue Hageman for expert technical assistance. We are also grateful to the members of the Laboratory of Morphology and Image Analysis (Biomedical Research Center, Juntendo University Graduate School of Medicine) for technical assistance with transmission electron microscopy.
Biographies
Daniel M. Hirai is a Postdoctoral Fellow in the Department of Kinesiology at Kansas State University (KSU). His research focuses on the (dys)regulation of oxygen transport and utilization at the muscle microcirculatory level with an emphasis on exercise tolerance in health and disease. He completed basic research training in the Department of Anatomy & Physiology at KSU, as well as clinical research training in the School of Medicine at Queen's University, Canada. He uses a translational approach with studies in pre‐clinical models and patients to identify therapeutic targets and improve microvascular and muscle function with rehabilitation and pharmacological/non‐pharmacological interventions.

Jesse C. Craig is a doctoral candidate in Kinesiology at KSU. His research focuses on the interplay of central and peripheral components of the cardiovascular and metabolic pathways to establish adequate oxygen delivery in health and disease.
Trenton D. Colburn is a doctoral student in Kinesiology at KSU, focusing on the impact of disease in muscle O2 transport; specifically, the control of NOS and ATP‐sensitive potassium channels during exercise.
Edited by: Michael Hogan & Bruno Grassi
References
- Bailey JK, Kindig CA, Behnke BJ, Musch TI, Schmid‐Schoenbein GW & Poole DC (2000). Spinotrapezius muscle microcirculatory function: effects of surgical exteriorization. Am J Physiol Heart Circ Physiol 279, H3131–H3137. [DOI] [PubMed] [Google Scholar]
- Bebout DE, Hogan MC, Hempleman SC & Wagner PD (1993). Effects of training and immobilization on VO2 and DO2 in dog gastrocnemius muscle in situ. J Appl Physiol 74, 1697–1703. [DOI] [PubMed] [Google Scholar]
- Behnke BJ, Barstow TJ, Kindig CA, McDonough P, Musch TI & Poole DC (2002). Dynamics of oxygen uptake following exercise onset in rat skeletal muscle. Respir Physiol Neurobiol 133, 229–239. [DOI] [PubMed] [Google Scholar]
- Behnke BJ, Delp MD, Dougherty PJ, Musch TI & Poole DC (2005). Effects of aging on microvascular oxygen pressures in rat skeletal muscle. Respir Physiol Neurobiol 146, 259–268. [DOI] [PubMed] [Google Scholar]
- Behnke BJ, Kindig CA, Musch TI, Koga S & Poole DC (2001). Dynamics of microvascular oxygen pressure across the rest–exercise transition in rat skeletal muscle. Respir Physiol 126, 53–63. [DOI] [PubMed] [Google Scholar]
- Cabrales P, Tsai AG, Johnson PC & Intaglietta M (2006). Oxygen release from arterioles with normal flow and no‐flow conditions. J Appl Physiol 100, 1569–1576. [DOI] [PubMed] [Google Scholar]
- Carvalho H & Pittman RN (2008). Longitudinal and radial gradients of PO2 in the hamster cheek pouch microcirculation. Microcirculation 15, 215–224. [DOI] [PubMed] [Google Scholar]
- Clanton TL, Hogan MC & Gladden LB (2013). Regulation of cellular gas exchange, oxygen sensing, and metabolic control. Compr Physiol 3, 1135–1190. [DOI] [PubMed] [Google Scholar]
- Copp SW, Ferreira LF, Herspring KF, Musch TI & Poole DC (2009). The effects of aging on capillary hemodynamics in contracting rat spinotrapezius muscle. Microvasc Res 77, 113–119. [DOI] [PubMed] [Google Scholar]
- Diederich ER, Behnke BJ, McDonough P, Kindig CA, Barstow TJ, Poole DC & Musch TI (2002). Dynamics of microvascular oxygen partial pressure in contracting skeletal muscle of rats with chronic heart failure. Cardiovasc Res 56, 479–486. [DOI] [PubMed] [Google Scholar]
- Duling BR (1972). Microvascular responses to alterations in oxygen tension. Circ Res 31, 481–489. [DOI] [PubMed] [Google Scholar]
- Duling BR (1973). Changes in microvascular diameter and oxygen tension induced by carbon dioxide. Circ Res 32, 370–376. [DOI] [PubMed] [Google Scholar]
- Duling BR & Berne RM (1970). Longitudinal gradients in periarteriolar oxygen tension. A possible mechanism for the participation of oxygen in local regulation of blood flow. Circ Res 27, 669–678. [DOI] [PubMed] [Google Scholar]
- Dunphy I, Vinogradov SA & Wilson DF (2002). Oxyphor R2 and G2: phosphors for measuring oxygen by oxygen‐dependent quenching of phosphorescence. Anal Biochem 310, 191–198. [DOI] [PubMed] [Google Scholar]
- Esipova TV, Karagodov A, Miller J, Wilson DF, Busch TM & Vinogradov SA (2011). Two new ‘protected’ oxyphors for biological oximetry: properties and application in tumor imaging. Anal Chem 83, 8756–8765. [DOI] [PMC free article] [PubMed] [Google Scholar]
- Federspiel WJ & Popel AS (1986). A theoretical analysis of the effect of the particulate nature of blood on oxygen release in capillaries. Microvasc Res 32, 164–189. [DOI] [PMC free article] [PubMed] [Google Scholar]
- Ferreira LF, McDonough P, Behnke BJ, Musch TI & Poole DC (2006). Blood flow and O2 extraction as a function of O2 uptake in muscles composed of different fiber types. Respir Physiol Neurobiol 153, 237–249. [DOI] [PubMed] [Google Scholar]
- Gayeski TE & Honig CR (1986). O2 gradients from sarcolemma to cell interior in red muscle at maximal VO2 . Am J Physiol Heart Circ Physiol 251, H789–H799. [DOI] [PubMed] [Google Scholar]
- Golub AS, Barker MC & Pittman RN (2007). PO2 profiles near arterioles and tissue oxygen consumption in rat mesentery. Am J Physiol Heart Circ Physiol 293, H1097–H1106. [DOI] [PubMed] [Google Scholar]
- Golub AS, Barker MC & Pittman RN (2008). Microvascular oxygen tension in the rat mesentery. Am J Physiol Heart Circ Physiol 294, H21–H28. [DOI] [PubMed] [Google Scholar]
- Golub AS & Pittman RN (2005). Erythrocyte‐associated transients in PO2 revealed in capillaries of rat mesentery. Am J Physiol Heart Circ Physiol 288, H2735–H2743. [DOI] [PubMed] [Google Scholar]
- Gorczynski RJ & Duling BR (1978). Role of oxygen in arteriolar functional vasodilation in hamster striated muscle. Am J Physiol Heart Circ Physiol 235, H505–H515. [DOI] [PubMed] [Google Scholar]
- Grassi B, Hogan MC, Greenhaff PL, Hamann JJ, Kelley KM, Aschenbach WG, Constantin‐Teodosiu D & Gladden LB (2002). Oxygen uptake on‐kinetics in dog gastrocnemius in situ following activation of pyruvate dehydrogenase by dichloroacetate. J Physiol 538, 195–207. [DOI] [PMC free article] [PubMed] [Google Scholar]
- Grassi B, Pogliaghi S, Rampichini S, Quaresima V, Ferrari M, Marconi C & Cerretelli P (2003). Muscle oxygenation and pulmonary gas exchange kinetics during cycling exercise on‐transitions in humans. J Appl Physiol 95, 149–158. [DOI] [PubMed] [Google Scholar]
- Grassi B, Poole DC, Richardson RS, Knight DR, Erickson BK & Wagner PD (1996). Muscle O2 uptake kinetics in humans: implications for metabolic control. J Appl Physiol 80, 988–998. [DOI] [PubMed] [Google Scholar]
- Groebe K (1990). A versatile model of steady state O2 supply to tissue. Application to skeletal muscle. Biophys J 57, 485–498. [DOI] [PMC free article] [PubMed] [Google Scholar]
- Groebe K & Thews G (1990). Calculated intra‐ and extracellular PO₂ gradients in heavily working red muscle. Am J Physiol Heart Circ Physiol 259, H84–H92. [DOI] [PubMed] [Google Scholar]
- Grundy D (2015). Principles and standards for reporting animal experiments in The Journal of Physiology and Experimental Physiology. J Physiol 593, 2547–2549. [DOI] [PMC free article] [PubMed] [Google Scholar]
- Heinonen I, Koga S, Kalliokoski KK, Musch TI & Poole DC (2015). Heterogeneity of muscle blood flow and metabolism: influence of exercise, aging and disease states. Exerc Sport Sci Rev 43, 117–1224. [DOI] [PMC free article] [PubMed] [Google Scholar]
- Hepple RT, Hogan MC, Stary C, Bebout DE, Mathieu‐Costello O & Wagner PD (2000). Structural basis of muscle O₂ diffusing capacity: evidence from muscle function in situ. J Appl Physiol 88, 560–566. [DOI] [PubMed] [Google Scholar]
- Hirai DM, Copp SW, Ferguson SK, Holdsworth CT, McCullough DJ, Behnke BJ, Musch TI & Poole DC (2012). Exercise training and muscle microvascular oxygenation: functional role of nitric oxide. J Appl Physiol 113, 557–565. [DOI] [PMC free article] [PubMed] [Google Scholar]
- Hirai DM, Copp SW, Ferguson SK, Holdsworth CT, Musch TI & Poole DC (2013). The NO donor sodium nitroprusside: evaluation of skeletal muscle vascular and metabolic dysfunction. Microvasc Res 85, 104–111. [DOI] [PMC free article] [PubMed] [Google Scholar]
- Hirai DM, Copp SW, Ferreira LF, Musch TI & Poole DC (2010). Nitric oxide bioavailability modulates the dynamics of microvascular oxygen exchange during recovery from contractions. Acta Physiol 200, 159–169. [DOI] [PubMed] [Google Scholar]
- Hirai DM, Copp SW, Herspring KF, Ferreira LF, Poole DC & Musch TI (2009). Aging impacts microvascular oxygen pressures during recovery from contractions in rat skeletal muscle. Respir Physiol Neurobiol 169, 315–322. [DOI] [PubMed] [Google Scholar]
- Hogan MC (2001). Fall in intracellular PO2 at the onset of contractions in Xenopus single skeletal muscle fibers. J Appl Physiol 90, 1871–1876. [DOI] [PubMed] [Google Scholar]
- Honig CR & Gayeski TE (1993). Resistance to O2 diffusion in anemic red muscle: roles of flux density and cell PO2 . Am J Physiol Heart Circ Physiol 265, H868–H875. [DOI] [PubMed] [Google Scholar]
- Honig CR, Gayeski TE & Groebe K (1997). Myoglobin and oxygen gradients In The Lung: Scientific Foundations, eds Crystal RG, West JB, Weibel ER. & Barnes P, pp. 1925–1933. Lippincott‐Raven Publishers, Philadelphia, PA. [Google Scholar]
- Howlett RA & Hogan MC (2001). Intracellular PO2 decreases with increasing stimulation frequency in contracting single Xenopus muscle fibers. J Appl Physiol 91, 632–636. [DOI] [PubMed] [Google Scholar]
- Howlett RA, Kindig CA & Hogan MC (2007). Intracellular PO2 kinetics at different contraction frequencies in Xenopus single skeletal muscle fibers. J Appl Physiol 102, 1456–1461. [DOI] [PubMed] [Google Scholar]
- Hudlická O, Zweifach BW & Tyler KR (1982). Capillary recruitment and flow velocity in skeletal muscle after contractions. Microvasc Res 23, 201–213. [DOI] [PubMed] [Google Scholar]
- Kindig CA, Richardson TE & Poole DC (2002). Skeletal muscle capillary hemodynamics from rest to contractions: implications for oxygen transfer. J Appl Physiol 92, 2513–2520. [DOI] [PubMed] [Google Scholar]
- Klitzman B & Duling BR (1979). Microvascular hematocrit and red cell flow in resting and contracting striated muscle. Am J Physiol Heart Circ Physiol 237, H481–H490. [DOI] [PubMed] [Google Scholar]
- Krogh A (1919a). The number and distribution of capillaries in muscles with calculations of the oxygen pressure head necessary for supplying the tissue. J Physiol 52, 409–415. [DOI] [PMC free article] [PubMed] [Google Scholar]
- Krogh A (1919b). The supply of oxygen to the tissues and the regulation of the capillary circulation. J Physiol 52, 457–474. [DOI] [PMC free article] [PubMed] [Google Scholar]
- Molé PA, Chung Y, Tran TK, Sailasuta N, Hurd R & Jue T (1999). Myoglobin desaturation with exercise intensity in human gastrocnemius muscle. Am J Physiol Regul Integr Comp Physiol 277, R173–R180. [DOI] [PubMed] [Google Scholar]
- Nugent WH, Song BK, Pittman RN & Golub AS (2016). Simultaneous sampling of tissue oxygenation and oxygen consumption in skeletal muscle. Microvasc Res 105, 15–22. [DOI] [PMC free article] [PubMed] [Google Scholar]
- Padilla DJ, McDonough P, Behnke BJ, Kano Y, Hageman KS, Musch TI & Poole DC (2006). Effects of type II diabetes on capillary hemodynamics in skeletal muscle. Am J Physiol Heart Circ Physiol 291, H2439–R2444. [DOI] [PubMed] [Google Scholar]
- Padilla DJ, McDonough P, Behnke BJ, Kano Y, Hageman KS, Musch TI & Poole DC (2007). Effects of type II diabetes on muscle microvascular oxygen pressures. Respir Physiol Neurobiol 156, 187–195. [DOI] [PubMed] [Google Scholar]
- Pittman RN (2011). Oxygen gradients in the microcirculation. Acta Physiol 202, 311–322. [DOI] [PMC free article] [PubMed] [Google Scholar]
- Poole DC, Behnke BJ, McDonough P, McAllister RM & Wilson DF (2004). Measurement of muscle microvascular oxygen pressures: compartmentalization of phosphorescent probe. Microcirculation 11, 317–326. [DOI] [PubMed] [Google Scholar]
- Poole DC, Copp SW, Hirai DM & Musch TI (2011). Dynamics of muscle microcirculatory and blood‐myocyte O₂ flux during contractions. Acta Physiol 202, 293–310. [DOI] [PMC free article] [PubMed] [Google Scholar]
- Poole DC & Jones AM (2012). Oxygen uptake kinetics. Compr Physiol 2, 933–996. [DOI] [PubMed] [Google Scholar]
- Poole DC, Kindig CA & Behnke BJ (2001). Effects of emphysema on diaphragm microvascular oxygen pressure. Am J Respir Crit Care Med 163, 1081–1086. [DOI] [PubMed] [Google Scholar]
- Poole DC & Mathieu‐Costello O (1997). Effect of pulmonary emphysema on diaphragm capillary geometry. J Appl Physiol 82, 599–606. [DOI] [PubMed] [Google Scholar]
- Poole DC, Wagner PD & Wilson DF (1995). Diaphragm microvascular plasma PO2 measured in vivo. J Appl Physiol 79, 2050–2057. [DOI] [PubMed] [Google Scholar]
- Popel AS, Pittman RN & Ellsworth ML (1989). Rate of oxygen loss from arterioles is an order of magnitude higher than expected. Am J Physiol Heart Circ Physiol 256, H921–H924. [DOI] [PubMed] [Google Scholar]
- Richardson RS, Duteil S, Wary C, Wray DW, Hoff J & Carlier PG (2006). Human skeletal muscle intracellular oxygenation: the impact of ambient oxygen availability. J Physiol 571, 415–424. [DOI] [PMC free article] [PubMed] [Google Scholar]
- Richardson RS, Grassi B, Gavin TP, Haseler LJ, Tagore K, Roca J & Wagner PD (1999a). Evidence of O2 supply‐dependent VO2 max in the exercise‐trained human quadriceps. J Appl Physiol 86, 1048–1053. [DOI] [PubMed] [Google Scholar]
- Richardson RS, Leigh JS, Wagner PD & Noyszewski EA (1999b). Cellular PO2 as a determinant of maximal mitochondrial O2 consumption in trained human skeletal muscle. J Appl Physiol 87, 325–331. [DOI] [PubMed] [Google Scholar]
- Richardson RS, Noyszewski EA, Kendrick KF, Leigh JS & Wagner PD (1995). Myoglobin O₂ desaturation during exercise. Evidence of limited O₂ transport. J Clin Invest 96, 1916–1926. [DOI] [PMC free article] [PubMed] [Google Scholar]
- Richardson TE, Kindig CA, Musch TI & Poole DC (2003). Effects of chronic heart failure on skeletal muscle capillary hemodynamics at rest and during contractions. J Appl Physiol 95, 1055–1062. [DOI] [PubMed] [Google Scholar]
- Rossiter HB (2011). Exercise: kinetic considerations for gas exchange. Compr Physiol 1, 203–244. [DOI] [PubMed] [Google Scholar]
- Rumsey WL, Vanderkooi JM & Wilson DF (1988). Imaging of phosphorescence: a novel method for measuring oxygen distribution in perfused tissue. Science 241, 1649–1651. [DOI] [PubMed] [Google Scholar]
- Scandurra FM & Gnaiger E (2010). Cell respiration under hypoxia: facts and artefacts in mitochondrial oxygen kinetics. Adv Exp Med Biol 662, 7–25. [DOI] [PubMed] [Google Scholar]
- Shibata M, Ichioka S, Ando J & Kamiya A (2001). Microvascular and interstitial PO2 measurements in rat skeletal muscle by phosphorescence quenching. J Appl Physiol 91, 321–327. [DOI] [PubMed] [Google Scholar]
- Smith LM, Golub AS & Pittman RN (2002). Interstitial PO2 determination by phosphorescence quenching microscopy. Microcirculation 9, 389–395. [DOI] [PubMed] [Google Scholar]
- Tsai AG, Friesenecker B, Mazzoni MC, Kerger H, Buerk DG, Johnson PC & Intaglietta M (1998). Microvascular and tissue oxygen gradients in the rat mesentery. Proc Natl Acad Sci USA 95, 6590–6595. [DOI] [PMC free article] [PubMed] [Google Scholar]
- Tsai AG, Johnson PC & Intaglietta M (2003). Oxygen gradients in the microcirculation. Physiol Rev 83, 933–963. [DOI] [PubMed] [Google Scholar]
- Vadapalli A, Pittman RN & Popel AS (2000). Estimating oxygen transport resistance of the microvascular wall. Am J Physiol Heart Circ Physiol 279, H657–H671. [DOI] [PubMed] [Google Scholar]
- Voter WA & Gayeski TE (1995). Determination of myoglobin saturation of frozen specimens using a reflecting cryospectrophotometer. Am J Physiol Heart Circ Physiol 269, H1328–H1341. [DOI] [PubMed] [Google Scholar]
- Wagner PD (2000). Diffusive resistance to O2 transport in muscle. Acta Physiol Scand 168, 609–614. [DOI] [PubMed] [Google Scholar]
- Weibel ER (1984). The Pathway for Oxygen: Structure and Function in the Mammalian Respiratory System. Harvard University Press, Cambridge, MA. [Google Scholar]
- Weibel ER, Kistler GS & Scherle WF (1966). Practical stereological methods for morphometric cytology. J Cell Biol 30, 23–38. [DOI] [PMC free article] [PubMed] [Google Scholar]
- Whalen WJ, Nair P, Buerk D & Thuning CA (1974). Tissue PO2 in normal and denervated cat skeletal muscle. Am J Physiol 227, 1221–1225. [DOI] [PubMed] [Google Scholar]
- Wilson DF, Lee WMF, Makonnen S, Finikova O, Apreleva S & Vinogradov SA (2006). Oxygen pressures in the interstitial space and their relationship to those in the blood plasma in resting skeletal muscle. J Appl Physiol 101, 1648–1656. [DOI] [PubMed] [Google Scholar]
- Wittenberg JB & Wittenberg BA (2003). Myoglobin function reassessed. J Exp Biol 206, 2011–2020. [DOI] [PubMed] [Google Scholar]
- Yu J, Ramadeen A, Tsui AKY, Hu X, Zou L, Wilson DF, Esipova TV, Vinogradov SA, Leong‐Poi H, Zamiri N, Mazer CD, Dorian P & Hare GMT (2013). Quantitative assessment of brain microvascular and tissue oxygenation during cardiac arrest and resuscitation in pigs. Anaesthesia 68, 723–735. [DOI] [PubMed] [Google Scholar]
- Zhang C, Bélanger S, Pouliot P & Lesage F (2015). Measurement of local partial pressure of oxygen in the brain tissue under normoxia and epilepsy with phosphorescence lifetime microscopy. PloS ONE 10, e0135536. [DOI] [PMC free article] [PubMed] [Google Scholar]