

Abstract
Chytridiomycosis, the disease caused by the fungal pathogen Batrachochytrium dendrobatidis (Bd), has devastated global amphibian biodiversity. Nevertheless, some hosts avoid disease after Bd exposure even as others experience near-complete extirpation. It remains unclear whether the amphibian adaptive immune system plays a role in Bd defence. Here, we describe gene expression in two host species—one susceptible to chytridiomycosis and one resistant—following exposure to two Bd isolates that differ in virulence. Susceptible wood frogs (Rana sylvatica) had high infection loads and mortality when exposed to the more virulent Bd isolate but lower infection loads and no fatal disease when exposed to the less virulent isolate. Resistant American bullfrogs (R. catesbeiana) had high survival across treatments and rapidly cleared Bd infection or avoided infection entirely. We found widespread upregulation of adaptive immune genes and downregulation of important metabolic and cellular maintenance components in wood frogs after Bd exposure, whereas American bullfrogs showed little gene expression change and no evidence of an adaptive immune response. Wood frog responses suggest that adaptive immune defences may be ineffective against virulent Bd isolates that can cause rapid physiological dysfunction. By contrast, American bullfrogs exhibited robust resistance to Bd that is likely attributable, at least in part, to their continued upkeep of metabolic and skin integrity pathways as well as greater antimicrobial peptide expression compared to wood frogs, regardless of exposure. Greater understanding of these defences will ultimately help conservationists manage chytridiomycosis.
Keywords: emerging infectious disease, chytridiomycosis, comparative transcriptomics, host defences, amphibian immunity, host–pathogen interactions
1. Introduction
Understanding and managing emerging infectious diseases is increasingly a conservation necessity [1–3]. Amphibians epitomize this problem, having recently experienced dramatic, widespread population declines [4,5]. Although amphibian declines are driven by multiple, interacting stressors [6,7], substantial amphibian biodiversity loss has been attributed to the emerging disease chytridiomycosis, caused by the aquatic fungal pathogen Batrachochytrium dendrobatidis (Bd) [8–10]. Bd infection can induce severe physiological disruption in amphibian hosts, leading to death [11], and the pathogen has an extremely broad host range, infecting hundreds of species across diverse amphibian families [12]. Consequently, Bd epidemics have driven global amphibian declines, extirpations and extinctions [13].
Given the devastating impact Bd has had on global amphibian biodiversity, understanding how certain species cope with Bd exposure and infection represents a critical knowledge gap. Some wild amphibian populations persist despite Bd infection [14,15], and mortality rates differ among species exposed experimentally to Bd [16,17]. Multiple, complementary mechanisms may explain how specific amphibian host species defend against Bd infection and disease pathology. For example, morphological processes like skin sloughing could help hosts resist pathogen colonization [18–20], and the diverse—yet species-specific—suite of antimicrobial peptides (AMPs) in amphibian skin mucus constitutes an innate defence against Bd [16,21,22]. In addition, certain amphibian skin-associated microbes produce anti-Bd compounds, and thus skin microbiome composition can affect Bd infection intensities and disease severity in exposed individuals [23,24].
The adaptive immune system is a critical vertebrate defence mechanism, yet there is conflicting evidence about whether and how adaptive immunity contributes to amphibian defences against Bd [25]. Some experimental studies indicate that prior exposure to killed or live Bd does not improve survival of frogs undergoing subsequent exposures, suggesting absent or ineffective adaptive immune memory [26,27]. There is also a notable lack of immune gene upregulation in some amphibian species exposed to Bd [28,29]. Other studies directly contradict these results, finding improved resistance to Bd as a result of prior exposure [30,31]. Variation in certain adaptive immune system components, like MHC, has also been linked to chytridiomycosis resistance [25,32–34]. However, in a further complexity, Bd itself may inhibit the amphibian adaptive immune system by limiting proliferation and inducing apoptosis of lymphocytes [35–37]. Bd's inhibitory activity could, therefore, render an adaptive immune response ineffective and costly for amphibian hosts.
To help clarify the adaptive immune system's role in generating beneficial responses to Bd challenge, here we report on experimental Bd exposures with two amphibian host species, one susceptible to chytridiomycosis and one resistant. Specifically, we use gene expression profiling of host skin tissue, the primary site of infection, to reveal differences in immune system activation. Our model susceptible species, the wood frog (Rana sylvatica), is known to die from chytridiomycosis in laboratory [17] and field settings [38]. In contrast, our model resistant species, the American bullfrog (R. catesbeiana), is generally unaffected by Bd exposure [39–41] and has been implicated as a driver of global Bd transmission due to its invasiveness [42,43]. In addition, because different Bd isolates can cause different disease outcomes [17,44], we exposed our amphibian host species to two Bd isolates that differ in virulence [45]. Therefore, we simultaneously profiled gene expression in the two amphibian hosts as well as the two Bd isolates, an approach that can highlight complex host–pathogen interactions [46,47].
2. Material and methods
2.1. Study animal collection, rearing and husbandry
To obtain study animals, we first collected recently laid wood frog egg masses just after oviposition in March 2014 in Montgomery County, VA. Eggs were shipped to Davis, CA where we housed them in 10-gallon buckets filled with deionized (DI) water reconstituted using powdered water conditioner (R/O Right, Kent Marine, Franklin, WI). Bubblers maintained dissolved oxygen (DO). Upon hatching, we transferred wood frog tadpoles to previously established mesocosms at densities of 50 tadpoles per mesocosm. We used a total of six mesocosms for this study; each was a 300-gallon cattle tank that we seeded with 1 kg of leaf litter and 4 l of local pond water before filling the remainder of the tank with DI water. All mesocosms were established approximately four weeks prior to the introduction of tadpoles, and they were maintained inside a greenhouse in order to moderate temperature. Mesocosm water temperature ranged from approximately 22 to 26°C, and we outfitted all mesocosms with air stones to supplement DO. To prevent study animals from escaping and to prevent colonization by unwanted fauna, we placed mesh netting over each mesocosm. We constructed small Styrofoam floats and placed one in each mesocosm to provide metamorphosing animals with perches to avoid drowning. We monitored mesocosms daily for water level, temperature, DO and the presence of any metamorphosed animals, which were removed from the mesocosms and transferred to an animal care room. When animals began to metamorphose, we also hung partially submerged minnow traps from the sides of the mesocosms to aid in their capture.
In contrast to wood frogs, which can metamorphose within 6−8 weeks after hatching, American bullfrogs often overwinter as tadpoles [48]. Thus, we collected late-stage American bullfrog tadpoles to efficiently raise them to metamorphosis for use in our study. During summer 2014, we collected wild American bullfrog tadpoles from two locations in their introduced range in California: Stone Lakes National Wildlife Refuge in Elk Grove, CA and Putah Creek Riparian Reserve in Davis, CA. We visually inspected mouthparts of all captured American bullfrog tadpoles and only kept animals with normal mouthpart pigmentation and jaw sheath structure to minimize the likelihood of introducing Bd-infected animals into our mesocosms [49]. Because wood frog tadpoles completed metamorphosis quickly, we transferred wild-caught American bullfrog tadpoles to the same (now unoccupied) mesocosms used to rear wood frogs. We added an additional 1 kg of leaf litter to each mesocosm prior to introducing American bullfrogs. Subsequent methods for rearing American bullfrogs from tadpoles were identical to those used for wood frogs. Wood frog and American bullfrog tadpoles were never housed together.
Upon metamorphosis, we housed all animals individually in 5.7 l lidded plastic containers. At the time of removal from mesocosms and transfer to individual housing, wood frogs averaged approximately 20 mm snout–urostyle length (SUL) and weighed approximately 0.79 g, while American bullfrogs were approximately 40 mm in SUL and weighed approximately 7.82 g on average. Each animal's container was tilted to provide aquatic habitat (reconstituted DI water) at one end and terrestrial habitat at the other. A plastic cup modified into a shelter structure provided habitat enrichment. The animal care room was maintained at 18°C on a 12 L : 12 D cycle. We conducted daily health checks to ensure animals were alert and maintained a righting reflex. Clean nitrile gloves were used to handle each individual when providing animal care. We fed animals twice weekly, with each meal consisting of 2−3 appropriately sized crickets dusted with multivitamins (ReptiVite with D3, Zoo Med Laboratories, San Luis Obispo, CA) and calcium supplement (Rep-Cal Research Labs, Los Gatos, CA). We thoroughly rinsed tanks and refilled them with clean water twice weekly on the day after each feeding. After Bd exposures were applied, we attended to control animals before exposed animals during all animal care procedures to reduce the possibility of contamination among treatment groups.
2.2. Experimental Bd exposures and animal monitoring procedures
Three days before experimental Bd exposures, and weekly thereafter, we weighed (g) and measured (SUL in mm) all study animals. In addition, we assayed all animals by quantitative polymerase chain reaction (qPCR) (see detailed methods below) for Bd prior to exposure treatments. Animals used in this study were assumed to be Bd-naive because they were collected as eggs or tadpoles, raised to metamorphosis in captivity, and all individuals of both study species tested Bd-negative prior to experimental exposures. To collect samples for Bd testing, we swabbed animals with a sterile rayon swab (MW113, Medical Wire and Equipment, Wiltshire, UK) for a total of 25 strokes: five each on the ventral surface, the ventral side of each thigh, and on each foot [45]. Swab samples were stored at −20°C until further analysis.
For exposures, we used two different isolates of Bd known to differ in virulence: low-virulence Carter Meadow Bd (CM Bd) and high-virulence Section Line Bd (SL Bd). See Piovia-Scott et al. [45] and Eskew et al. [41] for more information on these Bd isolates. For this experiment, both Bd isolates were revived from low-passage stocks frozen in liquid nitrogen approximately three months prior to Bd exposures. To prepare exposure inoculum, we cultured Bd zoospores in TGhL broth and, following filtration, quantified zoospore density using a haemocytometer as in Piovia-Scott et al. [45].
We intended to include a total of 210 animals in the study, incorporating 35 CM Bd-exposed, 35 SL Bd-exposed, and 35 sham control individuals for each of the two study species. However, we were only able to expose five American bullfrogs to CM Bd due to insufficient quantities of that isolate. Our study also included a set of eight wood frogs that had been previously exposed to SL Bd and survived (hereafter the ‘PE SL Bd’ treatment). Specifically, these animals had undergone between one and four SL Bd exposures in the weeks prior to the experiment with exposure dosage varying from approximately 105 to approximately 3 × 10⁶ total zoospores. In the results reported here, PE SL Bd study animals were then re-exposed using the same protocols as for naive individuals exposed to SL Bd. Thus, our experiment consisted of 188 total animals (electronic supplementary material, table S1). We randomly assigned study animals to experimental treatments and made minor adjustments to ensure there were no initial differences in mass or size among treatment groups within species. At the time of our full Bd exposure treatments, wood frogs were approximately 5.5 months post-metamorphosis, and American bullfrogs were approximately 1.5−4.5 months post-metamorphosis.
Because of the differences in body size between the two frog species, we exposed American bullfrogs to three times the amount of Bd used for wood frog exposures. This scaling factor was chosen to provide for approximately equal exposure per surface area, calculated by taking the mean estimated surface area of each study species. We exposed each wood frog to approximately 7.5 × 10⁶ total zoospores and each American bullfrog to approximately 2.25 × 10⁷ total zoospores. These doses are similar to those used in previous studies involving the same amphibian host species and Bd isolates, which ranged from approximately 105 to approximately 108 total zoospores [18,39,45]. We pipetted the exposure broth (TGhL broth + quantified Bd zoospores) directly onto the venter to ensure skin contact. Sham control animals were exposed to TGhL broth without Bd. Exposures lasted overnight; we housed wood frogs in 100 × 15 mm Petri dishes with a total volume of 20 ml liquid (exposure broth + reconstituted DI water) and American bullfrogs in plastic Ziploc containers (237 ml volume) with 50 ml liquid. Containers and exposure volumes were chosen to restrict frog movement and ensure constant contact with Bd. At the end of the overnight exposure period, all animals were returned to their usual enclosures along with the contents of their exposure containers, allowing for further opportunity for Bd contact until housings were cleaned four days post-exposure.
We monitored the health of all study animals daily for 49 days after exposure. As previously indicated, we weighed and measured all animals on a weekly basis. At the same weekly interval, we also swabbed all experimentally exposed animals for Bd, along with a random selection of 5−10 control animals of each study species. We humanely euthanized animals via overdose of MS-222 if they failed to exhibit a righting reflex. Bd swab samples were collected from these study animals prior to euthanasia. Carcasses of select animals were kept cool for approximately 3−12 h prior to formalin-fixation for histological analysis.
2.3. Tissue harvesting
To collect tissues for gene expression analyses, we randomly sacrificed five animals of each species from each treatment at three time points: 3, 7 and 10 days post-exposure (electronic supplementary material, table S2). Because only five American bullfrogs were exposed to CM Bd, we could only collect samples from the first time point for that treatment. For PE SL Bd-exposed wood frogs, we collected samples from four animals at 3 days post-exposure and from three animals at 7 days post-exposure. Prior to euthanizing, we weighed, measured and swabbed all animals. For the animals from which we collected tissue samples, we euthanized using a combination of decapitation and pithing because we were concerned that cutaneous exposure to MS-222 might influence gene expression in the skin. Immediately after euthanasia, we used sterile instruments to harvest approximately 20–30 mg of ventral skin tissue from each study animal. We promptly homogenized tissue samples in 1.5 ml TRIzol reagent using a hand-held Omni TH tissue homogenizer (Omni International, Kennesaw, GA). The homogenizer probe was rinsed thoroughly in 70% ethanol and multiple washes of molecular grade water between tissue samples. We stored all tissue samples at −80°C.
2.4. Survival and body mass analyses
To test for effects of Bd exposure on frog survival, we used the R package ‘survival’ [50]. We generated species-specific survival datasets, fitted survival curves corresponding to each treatment group within a species, and used the function ‘survdiff’ to test for differences among those survival curves. Our analysis used censoring to account for removal of animals that were sacrificed for tissue harvesting.
Even when chytridiomycosis does not cause death, it may still have significant negative effects on host physiology and body condition [44,51–54]. Therefore, we analysed frog body mass data collected throughout the experiment to evaluate sublethal effects of pathogen exposure. We fitted a linear mixed-effects model for each treatment group within each species. In these models, frog body mass was the continuous response variable, days post-exposure (i.e. time course of the experiment) was a categorical predictor, and study animal identity was included as a varying effect. Thus, these mixed models account for the inherent structure of our data, wherein repeated mass measurements were collected from the same individuals over time. We fitted models using the ‘lmer’ function within the R package ‘lme4’ [55] and calculated 95% confidence intervals (CIs) on model parameters using the ‘precis’ function from the ‘rethinking’ package [56]. We coded each model such that the intercept parameter represented pre-exposure body mass. Hence, other parameters reflected the difference between body mass measured at a later experimental time point and pre-exposure body mass. We interpreted cases where the 95% CI for one of these parameters did not overlap zero as evidence for a significant change in frog body mass relative to the pre-exposure time point.
2.5. Infection prevalence and load via quantitative polymerase chain reaction
We used a well-established qPCR assay as our primary means of determining Bd infection status [57,58]. Specifically, we used the qPCR protocols of Piovia-Scott et al. [45] to quantify Bd loads on amphibian skin swabs; for this assay, samples are run in singlicate [59] and raw qPCR quantifications are multiplied by 160 to account for dilutions occurring during DNA extraction, thus producing an estimate of Bd zoospore equivalents (ZE) from each sample. This qPCR assay allowed us to estimate Bd infection loads on individual animals and determine infection prevalence within experimental treatment groups.
2.6. Infection quantification via histology
Some authors suggest that qPCR could be, paradoxically, a misleading indicator of biologically relevant chytridiomycosis disease status because it is capable of detecting extremely small amounts of DNA [60]. In addition, qPCR data from skin swab samples may not accurately quantify an individual's true infection burden [61]. Thus, to help mitigate these concerns, we supplemented our qPCR infection load data with histological examination of skin tissues.
We performed histology on 90 samples taken from a subset of study animals. These histology samples represent individuals that were sacrificed for tissues (n = 67) and those that were euthanized when they began to show morbidity during experimental monitoring (n = 23). Legs and feet from sampled individuals were trimmed for histology. For each case, four longitudinal sections from the pelvic limbs were placed in a single cassette; the feet were placed whole in an additional cassette. Trimmed tissues were processed for routine histology, sectioned at 5 µm, and stained with Gomori methenamine silver.
Slides of legs and feet were evaluated by a board-certified veterinary pathologist (E.E.B.L.). In each case, the entire skin surface from both legs and feet was evaluated at 200× magnification for the presence of thalli. The number of 200× fields examined for each case ranged from 48 to 122, depending on the size of the animal (e.g. American bullfrogs tended to have a larger skin surface area than wood frogs), size of the trimmed sample, and amount of artefact (e.g. there was rare separation or loss of skin during processing). Each 200× field was scored as having a low, medium or high burden of infection, or as negative for infection. Low burden scores represented 200× fields with 1−19 thalli, medium scores designated 20−60 thalli per field, and high scores were characterized by greater than 60 thalli per field. Each case was then assigned an infection score based on the number of negative, low, medium, or high fields (electronic supplementary material, table S3). Infection scores were calculated as follows. First, the percentages of negative, low, medium, and high burden fields were determined for each case. Next, the percentages were scaled for the severity of infection by multiplying percentages of negative burden fields by zero, low by one, medium by two, and high by three. Then, the scaled percentages were summed and rounded to the nearest whole number to result in a final infection score. For example, if one case had 10% negative fields, 65% low fields and 25% medium fields, the infection score would be 10(0) + 65(1) + 25(2) = 115. Based on this system, possible infection scores ranged from 0 (100% negative fields) to 300 (100% high fields).
2.7. RNA isolation, library preparation and sequencing
We isolated RNA from ventral skin tissues homogenized in TRIzol using Zymo Research Direct-zol kits with an on-column DNase I digestion step. We followed the manufacturer's standard extraction protocol, except that we extended DNase I digestion time to 25 min and decreased the final elution volume to 30 µl. Following RNA extraction, we generated sequencing libraries from mRNA transcripts from each tissue sample using NEBNext Ultra RNA kits (New England BioLabs, Ipswich, MA) and a poly(A) selection strategy. Libraries were individually barcoded and pooled for high-throughput sequencing. All sequencing was conducted on the Illumina HiSeq 3000 platform at the UC Davis Genome Center (Davis, CA) using the 100 bp paired-end mode. We obtained reads from 87 RNA-seq libraries using a total of 11 sequencing lanes.
2.8. RNA-seq read processing, transcript quantification and gene expression analyses
After generating RNA-seq reads from ventral skin tissue samples, we used FastQC software (Babraham Bioinformatics, Cambridge, UK) to visualize and verify read quality. We used the experimental High Throughput Sequencing (expHTS) pipeline to perform consistent read processing for all of our RNA-seq samples [62]. The expHTS pipeline includes contamination screening, PCR duplicate removal, and quality trimming steps.
In lieu of aligning to different reference transcriptomes for each host species, which would complicate comparisons between species, we aligned all RNA-seq reads to a common host transcriptome. Specifically, we used a previously published transcriptome for R. clamitans [63], a congener to our two study species. Robertson & Cornman [63] also reported 11 manually curated, candidate AMP sequences from R. clamitans. Because AMPs can constitute an important amphibian defence against Bd [16,21], we included these sequences in our R. clamitans reference transcriptome.
A number of sequencing studies have recovered pathogen sequences as either a primary aim [46,47] or secondary aspect [64] of their investigations of host organisms. While some previous gene expression studies examining amphibian responses to Bd infection have sought to exclude potential Bd-derived sequences from analysis [65], others have explicitly called for such a ‘dual RNA-seq’ approach to study host–pathogen interactions in the amphibian–Bd system [66]. Following these recommendations, we sought to characterize any Bd-derived sequence that might be present in sampled host tissues using the reference Bd transcriptome generated by the Broad Institute (Cambridge, MA). We, therefore, concatenated the R. clamitans and Bd reference transcriptomes, allowing for the full set of host- and pathogen-associated contigs to be present during quantification. We quantified expHTS-processed RNA-seq reads from each sample against this concatenated host–pathogen reference transcriptome using Salmon [67]. Read abundance estimates from Salmon were rounded to the nearest whole number and treated as counts in downstream analyses.
We used the R software package ‘edgeR’ to conduct differential expression analyses [68–70]. First, we created host- and pathogen-specific datasets to be analysed in parallel because we did not want to include Bd contigs in analyses of host gene expression and vice versa. Using the host-specific dataset, we then filtered out contigs with low expression; we only kept contigs having read counts greater than five in at least seven RNA-seq samples. We then combined experimental main effects (host species, exposure treatment and time point) into one factor and constructed a design matrix where each unique combination of main effects (e.g. ‘wood frog–SL Bd–day 3’) was represented by a single coefficient. We fitted our data using this design matrix and the ‘edgeR’ function ‘glmQLFit’, which implements a quasi-likelihood negative binomial generalized linear model. Following model fitting, we tested for differences in host gene expression by specifying pairwise contrasts between Bd treatment groups and time-matched controls within species (e.g. ‘wood frog–SL Bd–day 3’ versus ‘wood frog–control–day 3’). We made differential expression calls using the quasi-likelihood F-test method [71], and we considered contigs with false discovery rate-corrected p-values ≤0.05 to be differentially expressed.
We also wanted to directly compare species' responses to Bd exposure. Therefore, we first plotted wood frog responses to Bd exposure (i.e. log2 fold change of each contig relative to controls) at all relevant time points against the equivalent American bullfrog responses. We quantified similarity in species' responses to Bd exposure using the Pearson correlation coefficient. To more formally test for differences in species' responses to Bd, we turned to the previously described gene expression model. In particular, we specified contrasts that compared wood frog responses to a given Bd isolate at a given time point (e.g. ‘wood frog–SL Bd–day 3’ versus ‘wood frog–control–day 3’) to American bullfrog responses to the same isolate at the same time point (e.g. ‘American bullfrog–SL Bd–day 3’ versus ‘American bullfrog–control–day 3’). We then conducted differential expression calling as before. These contrasts explicitly compare species-level responses to Bd exposure and are equivalent to results that could be obtained from a model specified with full interactions among main effects (i.e. host species × exposure treatment × time point).
To test for differences in Bd gene expression, we used the pathogen-specific RNA-seq dataset and filtered out low expression contigs as previously described. We then filtered the dataset further to only include Bd contigs that had read counts less than 10 across all control samples. The use of Bd contigs that were extremely rare or absent in control samples increases the likelihood that these sequence reads derived from Bd transcripts. For this subset of contigs, we constructed a design matrix and fitted a generalized linear model as before. We then specified pairwise SL Bd versus CM Bd and PE SL Bd versus SL Bd contrasts within host species and time points. Differential expression calling was conducted as previously described.
We visualized host-associated gene expression data using multiple methods. First, we constructed multidimensional scaling plots of the read count data for all 87 RNA-seq samples using the R package ‘limma’ [72]. Next, we used Venn diagrams to visualize overlap in differentially expressed contig sets, making diagrams to compare all treatment–control pairwise contrasts within each host species and time point. To more directly compare the two host species' responses to Bd, we used heatmaps. Where applicable, we generated heatmaps representing three different contig sets for both CM Bd and SL Bd samples: contigs that were differentially regulated in either host species at any time point (relative to controls), contigs that showed a common response to Bd exposure (i.e. differential regulation in the same direction) in both host species at any time point, and contigs that showed a different response to Bd exposure between host species at any time point. Heatmaps were produced using the ‘heatmap.2’ function of the ‘gplots’ package, which defaults to Euclidean distances and complete linkage for clustering [73]. Finally, we plotted read counts for specific contigs of interest, controlling for differences in sequencing depth among samples by scaling raw counts to counts per million.
We used the Trinotate pipeline to generate functional annotations for our contigs [74]. Trinotate integrates, among others, BLAST [75] and Gene Ontology (GO) [76] tools. We used the resulting functional information to perform GO term enrichment analyses on selected contig sets using the ‘GOstats’ package in R [77].
3. Results
3.1. Survival and body mass of study animals
Bd exposure effects on wood frog survival were strongly dependent on isolate. SL Bd-exposed wood frogs were severely affected, such that only one of 35 animals initially in this treatment survived until the end of the study (figure 1a). Note however that here, as in all treatments, animals were removed from the experiment not only due to morbidity but also because of destructive sampling for tissue harvesting, which was accounted for using censoring in the survival analyses. As a result, the set of animals for which morbidity could be observed throughout the experiment did not remain constant at the initial treatment sample size. Wood frogs in the PE SL Bd treatment (n = 8) also had reduced survival. Following the removal of four of these animals for tissue harvesting at 3 days post-exposure, one of the remaining four animals experienced morbidity prior to tissue harvesting at 7 days post-exposure, when the final three individuals were removed. In contrast, no CM Bd-exposed wood frogs (n = 35) died. As expected, control wood frogs (n = 35) also had high survival (100%). Owing to the dramatic effect of SL Bd exposure relative to the other treatments, there were significant differences in wood frog survival among treatment groups (χ2 = 56.9, df = 3, p < 0.001).
Figure 1.

Survival curves for wood frogs (a) and American bullfrogs (b) following experimental Bd exposure. Green lines represent frogs treated with a sham control (n = 35 wood frogs, 35 American bullfrogs), blue lines are those in the CM Bd treatment group (n = 35 wood frogs, 5 American bullfrogs), red lines represent frogs in the SL Bd treatment group (n = 35 wood frogs, 35 American bullfrogs), and the orange line shows wood frogs that were previously exposed to SL Bd then re-exposed (n = 8). In (a), the line representing control animals is obscured as this treatment group had 100% survival throughout the study. In (b), the line representing CM Bd-exposed animals is obscured as these five animals survived for three days following Bd exposure but were then sacrificed for tissue harvesting.
In contrast, American bullfrog survival did not differ among experimental treatments (χ2 = 0, df = 1, p = 0.986; figure 1b). Despite being exposed to greater absolute numbers of Bd zoospores than wood frogs, American bullfrogs had high survival across all treatments, with only one case of apparently incidental mortality occurring in each of the control (n = 35) and SL Bd-exposed (n = 35) groups. All CM Bd-exposed American bullfrogs (n = 5) survived until the first tissue harvesting time point at 3 days post-exposure, when all individuals were removed from that treatment group.
Body mass of study animals changed over time, with contrasting patterns across treatments (figure 2). Body mass of control wood frogs increased slightly over time, becoming significantly greater than pre-exposure values at 32 days post-exposure and for all time points thereafter (absolute change in mean body mass from pre-exposure to day 46: +0.15 g; relative change: +10.1%). In contrast, both CM and SL Bd-exposed wood frogs showed significant decreases in body mass immediately after exposure. Patterns of body mass change for American bullfrogs were qualitatively similar. For example, control American bullfrogs showed significant increases in body mass late in the experiment (absolute change in mean body mass from pre-exposure to day 46: +1.57 g; relative change: +23.88%). American bullfrogs exposed to SL Bd showed a significant decrease in body mass immediately following exposure, mirroring the pattern seen in Bd-exposed wood frogs. However, these American bullfrogs then began to gain mass such that they were significantly heavier at the final three measurement time points than they were pre-exposure.
Figure 2.

Violin plots showing body mass of wood frogs (a) and American bullfrogs (b) following experimental Bd exposure. Body mass data were collected from all surviving study animals on a weekly basis, starting three days prior to experimental exposure treatments (the ‘pre’ time point). Jittered black points in the violin plots represent the individual body mass measurements, and the numbers above each plot explicitly list the sample size at each time point. Violin plots with green fill represent time points where body mass is significantly greater than the pre-exposure body mass for that treatment, whereas red fill indicates a significant decrease in body mass. We fitted body mass data using linear mixed-effects models, and significance was inferred when the 95% confidence interval for a parameter estimate did not overlap zero. Violin plots with grey fill represent time points that are statistically identical to the pre-exposure time point.
3.2. Infection prevalence and load via quantitative polymerase chain reaction
Following experimental Bd exposure, wood frogs showed evidence of infection via qPCR assays of skin swab samples, whereas American bullfrogs largely appeared to resist infection (figure 3). Exposure to SL Bd resulted in 100% infection prevalence in wood frogs at four and 11 days post-exposure (figure 3a). Prevalence dropped to zero from days 18–39 post-exposure. Only one study animal remained in the SL Bd treatment group at this point in the experiment, and it consistently tested Bd-negative during this time. After appearing to have cleared Bd infection, the sole surviving wood frog in the SL Bd treatment again tested positive for Bd at 46 days post-exposure (see [78] for further discussion of the potential for variation in Bd testing results within individuals). All PE SL Bd wood frogs tested positive for Bd four days post-exposure. Despite suffering no mortality during the experiment, CM Bd-exposed wood frogs were consistently infected, with prevalence ranging from 70 to 85% throughout the study. Prevalence among SL Bd-exposed American bullfrogs peaked at 50% four days post-exposure then rapidly declined and remained low for the duration of the experiment (figure 3b). Only five American bullfrogs were exposed to CM Bd, but all of these study animals were Bd-positive at the first tissue harvesting time point 3 days post-exposure. Control wood frogs and American bullfrogs remained Bd-negative throughout the course of the experiment.
Figure 3.

Bd infection prevalence in wood frogs (a) and American bullfrogs (b) following experimental Bd exposure. We quantified infection with a qPCR assay, using frog skin swab samples as starting material (see main text for further detail). Green lines represent frogs treated with a sham control, blue lines are those in the CM Bd treatment group, red lines represent frogs in the SL Bd treatment group, and orange shows wood frogs that were previously exposed to SL Bd then re-exposed. Data from harvesting dates (3, 7 and 10 days post-exposure) are not shown in order to maintain a presentation of our weekly sampling data consistent with figure 2 and because harvesting dates have low sample sizes (n ≤ 5) relative to weekly time points. Thus, data from CM Bd-exposed American bullfrogs do not appear in (b) (all animals in this treatment group were sacrificed for tissue harvesting at 3 days post-exposure). Sample sizes for these analyses are given in the electronic supplementary material, table S1.
Average Bd load of Bd-positive animals also differed depending upon host species and Bd isolate (figure 4). Within wood frogs, SL Bd exposure resulted in heavy infections, with mean Bd loads of approximately 1000 ZE at both four and 11 days post-exposure. In contrast, CM Bd exposure caused less intense infections in wood frogs; mean Bd loads were approximately 100 ZE in Bd-positive frogs from this treatment group for the duration of the experiment. Infection loads of SL Bd-exposed American bullfrogs were lower than for wood frogs exposed to the same Bd isolate. Mean load in these animals peaked at approximately 100 ZE at four days post-exposure before declining.
Figure 4.

Mean Bd infection loads from Bd-positive wood frogs (a) and American bullfrogs (b) following experimental Bd exposure. We quantified infection with a qPCR assay, using frog skin swab samples as starting material (see main text for further detail). Individual infection loads were estimated in terms of Bd zoospore equivalents (ZEs). For plotting, we added one to these ZE values, performed a log10-transformation, and then averaged infection loads of Bd-positive animals at each time point within treatment groups. If there were no Bd-positive animals at a particular time point, a value of zero is displayed. Where applicable, minimum and maximum infection load values are also shown as small dots. Green lines represent frogs treated with a sham control, blue lines are those in the CM Bd treatment group, red lines represent frogs in the SL Bd treatment group, and orange shows wood frogs that were previously exposed to SL Bd then re-exposed. Data from harvesting dates (3, 7 and 10 days post-exposure) are not shown in order to maintain a presentation of our weekly sampling data consistent with figure 2 and because harvesting dates have low sample sizes (n ≤ 5) relative to weekly time points. Thus, data from CM Bd-exposed American bullfrogs do not appear in (b) (all animals in this treatment group were sacrificed for tissue harvesting at 3 days post-exposure). Sample sizes for these analyses are given in the electronic supplementary material, table S1.
3.3. Infection quantification via histology
Histology infection scores were positively correlated with qPCR infection loads (Pearson correlation coefficient = 0.49; figure 5 and electronic supplementary material, table S3). Observed histology scores ranged from 0 to 228, and mean scores were the highest for SL Bd-exposed wood frogs (x = 110 for this subset). Comparing data from histology and qPCR suggests qPCR is the more sensitive detection method. Of the 47 samples with a histology infection score of 0, 15 had a qPCR result greater than 0, indicating potential false negative results from histology. In contrast, among the 33 samples scoring negative for infection via qPCR, only one had a histology infection score greater than 0. These results are unsurprising given that a variety of factors, including patchy distribution of infection, are expected to reduce the sensitivity of histology as a Bd detection method [79].
Figure 5.
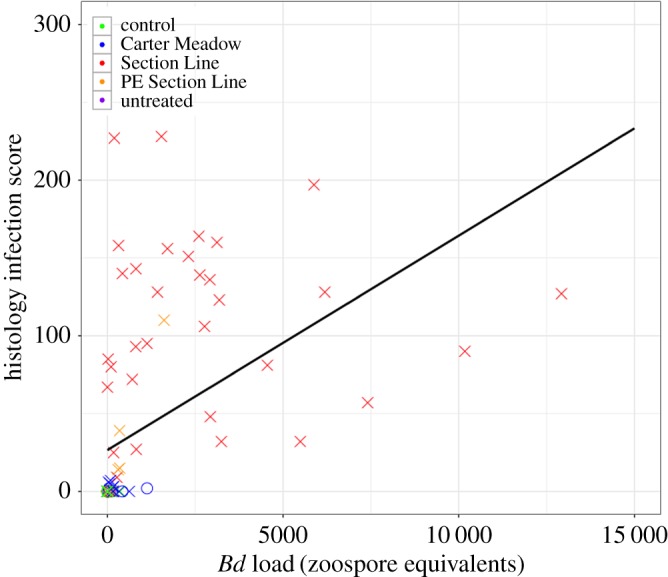
Histology infection scores versus Bd infection loads via qPCR for 90 frogs. Histology infection scores represent a measure of infection load, and possible scores ranged from 0–300. Bd infection load was also evaluated with a qPCR assay, using frog skin swab samples as starting material (see main text for further detail). Samples subject to both histology and qPCR analyses were derived from control (n = 12 wood frogs, 11 American bullfrogs), CM Bd-exposed (n = 13 wood frogs, 5 American bullfrogs), SL Bd-exposed (n = 32 wood frogs, 10 American bullfrogs), previously exposed SL Bd (n = 6 wood frogs), and untreated (n = 1 American bullfrog) study animals. For each individual, Bd infection load via qPCR represents data derived from the swab sample collected closest to the time of euthanasia. Data from wood frogs are shown as X's, and data from American bullfrogs are shown as O's. A best fit line is plotted in black. The Pearson correlation coefficient between the two infection quantification methods is 0.49.
However, discrepancies between qPCR and histology results could also be interpreted as evidence for qPCR detection of environmental Bd DNA (i.e. false positive results), with histology better representing the true infection status of study animals. Among Bd-exposed wood frog samples undergoing histological analyses, 48 were Bd-positive via qPCR. Of these, eight (16.7%) had histology scores of 0. In contrast, among Bd-exposed American bullfrog samples undergoing histological analyses, seven were Bd-positive via qPCR, and, of these, five (71.4%) had histology scores of 0. Although a limited sample size, these comparisons, and the totality of evidence from both qPCR and histology, suggest that whereas wood frogs were readily infected with Bd, many American bullfrogs resisted infection entirely or only manifested mild infections after exposure.
3.4. RNA-seq overview
Following read processing and quality trimming using expHTS, our RNA-seq dataset consisted of 1 078 158 711 reads across 87 ventral skin tissue samples. Read numbers from individual samples ranged from 631 487 to 38 718 641. The concatenated R. clamitans-Bd transcriptome was composed of 59 068 contigs, 22 940 (38.8%) of which were successfully annotated with GO terms using the Trinotate pipeline. Of note, 50 249 of the concatenated reference transcriptome contigs came from R. clamitans, and 8819 came from Bd. Mapping rates to the concatenated transcriptome were similar between study species: wood frog mapping rates ranged from 69.0% to 77.3%, while those of American bullfrogs ranged from 68.4% to 81.5%.
3.5. Host gene expression—overview
After filtering out contigs with low expression, our host-specific RNA-seq dataset was composed of reads mapping to 41 646 contigs. Multidimensional scaling of the RNA-seq data revealed strong sample separation by host species (figure 6). Wood frog samples also showed clustering by treatment in a pattern congruent with frog health throughout the study. For example, control samples clustered most closely with CM Bd samples, which came from frogs that had high survival despite Bd challenge. SL Bd samples, derived from animals experiencing severe chytridiomycosis, were dispersed farthest from controls. There was little separation by treatment among American bullfrog samples.
Figure 6.

Multidimensional scaling (MDS) plots of 87 RNA-seq samples from an experimental Bd exposure study. RNA-seq data shown here represent read counts for 41 646 host-specific contigs (i.e. those from the Rana clamitans reference transcriptome). We generated MDS plots using the ‘plotMDS’ function in the R package ‘limma’ [72], specifying visualization of the top 100 contigs that best distinguish samples. All RNA-seq samples are plotted in (a), with wood frog samples shown as triangles and American bullfrog samples shown as circles. (b) The same data subset by day of tissue harvesting (3, 7 or 10 days post-exposure) to illustrate temporal trends in sample clustering.
3.6. Host gene expression—expression patterns within species
As suggested by sample clustering on the multidimensional scaling plot, formal differential expression analyses confirmed that Bd-exposed wood frogs responded with greater changes in gene expression than Bd-exposed American bullfrogs (figures 7, 8a and 9). Wood frogs exposed to SL Bd had 3938 differentially expressed contigs at 3 days post-exposure. In contrast, American bullfrogs from the same treatment and time point only showed 54 differentially expressed contigs (figure 7). Similar patterns were observed in the SL Bd samples collected later in the experiment and in CM Bd samples from 3 days post-exposure, with wood frogs having greater numbers of differentially expressed contigs in all cases. In fact, SL Bd-exposed American bullfrogs only had seven differentially expressed contigs at 7 days post-exposure and none at day 10, orders of magnitude less differential expression than was observed in the equivalent Bd-exposed wood frogs. In wood frogs, differentially expressed contig sets from SL Bd treatment groups overlapped more with PE SL Bd treatments than with CM Bd treatments (figure 7). Generally, differential expression was greatest at earlier sampling time points for both host species (figures 7, 8a and 9).
Figure 7.

Venn diagrams showing numbers of differentially expressed contigs throughout an experimental Bd exposure study. Differential expression analyses were conducted using the R package ‘edgeR’. Here, we compared Bd exposure treatment samples within species to time-matched control samples. Venn diagrams show overlap in differentially expressed contig sets within species and time points. CM Bd treatment groups are shown as blue circles, SL Bd treatments are in red, and orange represents SL Bd exposure following previous experimental exposure. There were no CM Bd samples for American bullfrogs at day 7 or day 10 post-exposure, and no differential expression was detected between SL Bd-exposed and control American bullfrogs at day 10.
Figure 8.
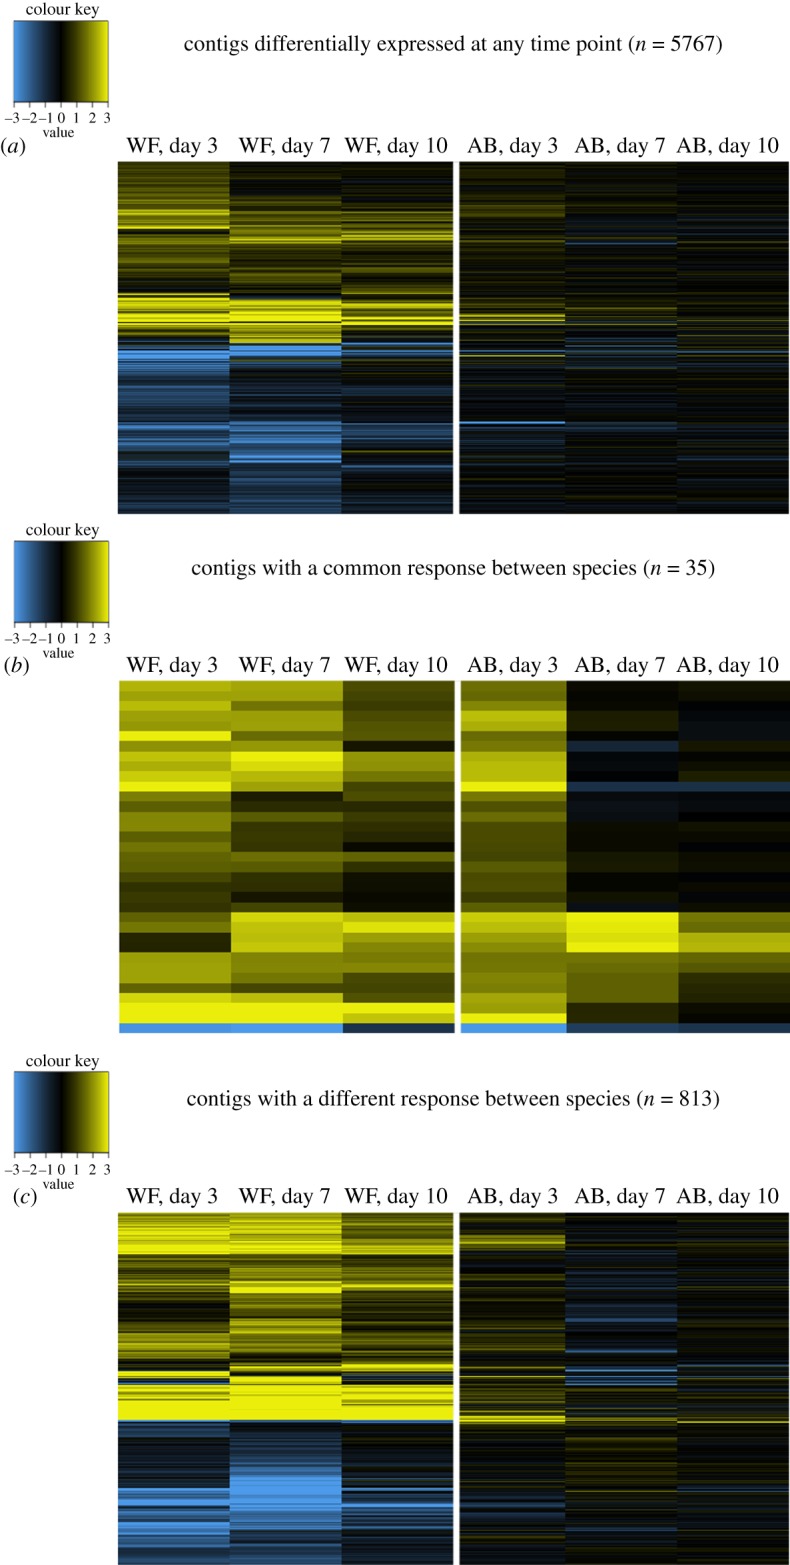
Heatmaps contrasting wood frog and American bullfrog gene expression responses to SL Bd exposure. In all panels, each column of the heatmap represents a given amphibian host species (‘WF’ for wood frogs, ‘AB’ for American bullfrogs) at a given tissue sampling time point. Colour within the heatmap represents log2 fold change relative to time-matched control samples, with yellow indicating upregulation and blue indicating downregulation. Contig sets, and thus rows of the heatmap, differ between panels. (a) Contigs that were differentially expressed in either host species at any time point. (b) A strict subset of contigs represented in (a), specifically those that show differential expression in a common direction in both species at any time point. In contrast, (c) contigs with a significantly different response to SL Bd exposure between the two species at any time point.
Figure 9.

Heatmap contrasting wood frog and American bullfrog gene expression responses to CM Bd exposure. Each column of the heatmap represents a given amphibian host species (‘WF’ for wood frogs, ‘AB’ for American bullfrogs) at a given tissue harvesting time point. Colour within the heatmap represents log2 fold change relative to time-matched control samples, yellow indicating upregulation and blue indicating downregulation. Rows of the heatmap represent contigs that were differentially expressed in either host species at any time point. In contrast to SL Bd treatments (figure 8), we did not identify any contigs that showed a common or significantly different response to CM Bd exposure between amphibian host species.
Wood frogs in all Bd exposure treatment groups increased expression of contigs associated with antigen processing and presentation (electronic supplementary material, table S4). Upregulation of adaptive immune-related contigs was especially pronounced in the CM Bd and PE SL Bd treatments. In contrast, American bullfrogs, which had little differential expression overall, did not show immune-associated responses to Bd exposure. Contigs differentially expressed in American bullfrogs generally involved metabolic or biosynthesis processes, and American bullfrogs exposed to SL Bd showed upregulation of ‘keratinization’ (GO:0031424).
Specific contigs with immune or defensive functions showed intriguing expression patterns across host species and treatment groups. For example, seven of 11 AMP contigs were represented in our filtered host-specific RNA-seq dataset. Although these contigs were not differentially expressed in either host species as a result of Bd exposure, two AMP sequences were expressed more highly across American bullfrog samples than in wood frogs (figure 10). These AMPs share close affinity with temporin 1C-b and palustrin, respectively. In addition, R. clamitans contig 252 was among the 10 most strongly upregulated contigs in wood frogs at three treatment group–time point combinations: CM Bd-exposed frogs at both 3 and 10 days post-exposure and SL Bd-exposed frogs at 3 days post-exposure (figure 11). This contig was annotated as immune-responsive gene 1 and did not show differential regulation in Bd-exposed American bullfrogs.
Figure 10.
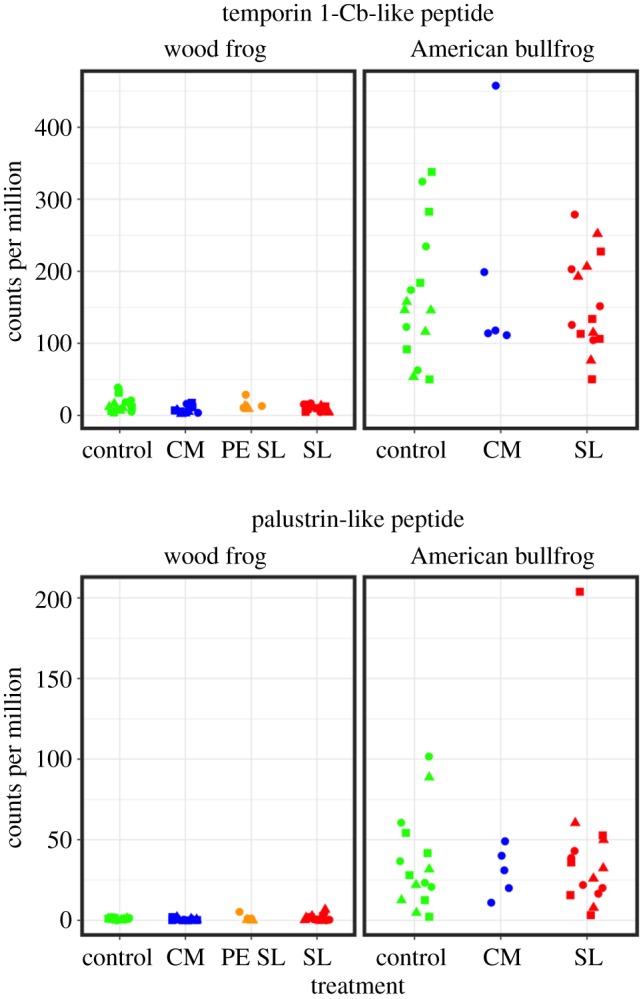
Jitter plots showing read counts for two antimicrobial peptide (AMP) sequences in wood frogs and American bullfrogs. The AMP sequences shown here were labelled Lcla-B and Lcla-H by Robertson & Cornman [63] and share close affinity with temporin 1-Cb and palustrin, respectively. Counts for each sample were scaled to counts per million. Circles represent samples collected 3 days post-exposure, triangles those from day 7, and squares those from day 10. X-axis labels represent experimental treatment groups: sham controls, Carter Meadow Bd exposure (CM), Section Line Bd exposure (SL) and Section Line Bd exposure following previous experimental exposure (PE SL).
Figure 11.
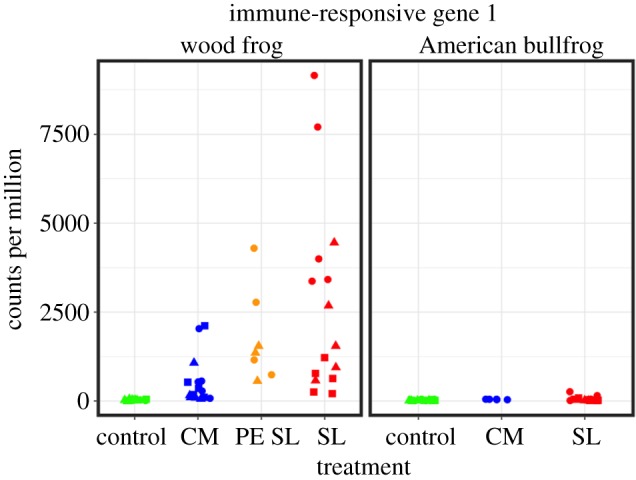
Jitter plot showing read counts for immune-responsive gene 1 (Irg1) in wood frogs and American bullfrogs. Data shown here represent reads mapping to Rana clamitans contig 252 as assembled by Robertson & Cornman [63]. Counts for each sample were scaled to counts per million. Circles represent samples collected 3 days post-exposure, triangles those from day 7, and squares those from day 10. X-axis labels represent experimental treatment groups: sham controls, Carter Meadow Bd exposure (CM), Section Line Bd exposure (SL), and Section Line Bd exposure following previous experimental exposure (PE SL).
3.7. Host gene expression—comparison of species' responses to Bd exposure
Explicit comparison of wood frog and American bullfrog responses to Bd exposure revealed distinct species' responses. First, there was low correlation (r ≤ 0.26) in species' responses to Bd across Bd isolates and time points (figure 12). Correlation of responses was highest between SL Bd groups at 3 days post-exposure but declined at later time points. Furthermore, only 35 contigs showed a common response to SL Bd in wood frogs and American bullfrogs (figure 8b), in contrast to 813 contigs that showed a divergent response between species (figure 8c). Contigs showing upregulation in response to SL Bd challenge across both species had functional significance for epidermis development and maintenance (table 1). Examination of the contigs that showed different responses to SL Bd exposure highlighted molecular processes that were especially distinct between species. In particular, wood frog responses to SL Bd exposure were characterized by increased regulation of a variety of immune-related contigs relative to American bullfrogs (table 1). These included contigs annotated with ‘positive regulation of adaptive immune response’ (GO:0002821), ‘positive regulation of leucocyte-mediated immunity’ (GO:0002705), ‘positive regulation of MHC class II biosynthetic process' (GO:0045348), and several innate immune-related processes. Contigs showing significantly downregulated responses in SL Bd-exposed wood frogs relative to American bullfrogs included those involved in cell-to-cell adhesion, ion transport and gas exchange (table 1). We did not identify any contigs as having shared or significantly different responses to CM Bd exposure between amphibian host species.
Figure 12.

Comparison of species' gene expression responses to Bd exposure. (a–c) Host gene expression responses to CM Bd exposure. (d–f) Responses to SL Bd. Axes show log2 fold change between exposed and control frogs. Each point represents one of the 41 646 contigs in our host-specific RNA-seq dataset. Pearson correlation coefficients are given in each plot. Differentially expressed contigs (for either host species) are shown in blue for CM Bd treatments and in red for SL Bd treatments. There were no CM Bd samples for American bullfrogs at day 7 or day 10 post-exposure, precluding comparison of species' responses to Bd exposure at those time points for that isolate.
Table 1.
Gene ontology (GO) term enrichment analysis for contigs showing a common or divergent response to SL Bd exposure in wood frogs and American bullfrogs. Differential expression analyses were conducted in ‘edgeR’, and GO term enrichment was performed using ‘GOstats’. We compared all Bd exposure treatment samples to time-matched controls for differential expression calling. For GO term enrichment analyses, we then pooled contigs within species and treatment groups showing a given response to exposure (i.e. up- or downregulation) at any time point. The first two rows of this table correspond to the contig set represented in figure 8b, whereas the last two rows correspond to the contig set represented in figure 8c. Select enriched GO terms (up to 10) within these contig sets are shown.
| comparison | direction of differential expression | no. of differentially expressed contigs (no. with GO annotation) | no. of enriched GO terms | select enriched GO terms |
|---|---|---|---|---|
| common responses | up | 34 (17) | 51 |
|
| common responses | down | 1 (0) | N/A | N/A |
| divergent responses | up (i.e. wood frog regulation response is significantly greater than American bullfrogs) | 477 (182) | 477 |
|
| divergent responses | down (i.e. wood frog regulation response is significantly less than American bullfrogs) | 336 (160) | 305 |
|
3.8. Bd gene expression
Reads representing Bd-derived transcripts were a relatively small portion of our sequencing dataset. Of 8819 Bd contigs in our reference transcriptome, only 306 were represented in our pathogen-specific RNA-seq dataset after initial filtering to remove low expression contigs. For Bd gene expression analyses, we further narrowed this dataset to 106 Bd contigs that were characterized by low expression across all control samples. Most Bd differential expression was observed in wood frog samples collected 3 days post-exposure (electronic supplementary material, table S5). At this time point in this host species, SL Bd versus CM Bd and PE SL Bd versus SL Bd comparisons showed 17 and 14 differentially expressed contigs, respectively. Of the 14 contigs downregulated in PE SL Bd relative to SL Bd at 3 days post-exposure, 13 of these were upregulated in SL Bd relative to CM Bd at the same time point (electronic supplementary material, table S5). Therefore, these sequences were consistently recovered in greater abundance in samples from naive wood frogs exposed to SL Bd than in CM Bd or PE SL Bd samples. Functions of these contigs included metabolic processes, biosynthesis and transmembrane transport (electronic supplementary material, table S6). We did not detect differential expression in Bd contigs recovered from American bullfrog samples.
4. Discussion
Our experimental Bd exposures resulted in large differences in survival, body condition, infection status and gene expression according to amphibian host species and Bd isolate. Wood frogs exposed to SL Bd had high infection loads that resulted in drastically reduced survival. In contrast, wood frogs exposed to CM Bd had low infection loads and no mortality. American bullfrogs, even those exposed to the especially virulent SL Bd, had rapid infection clearance or avoided infection entirely and did not develop disease. While infection dynamics and mortality effects were thus host- and isolate-specific, both host species showed evidence of sublethal effects of Bd exposure. For all Bd treatments, individuals had significant reduction in body mass in the days immediately after Bd challenge. These results suggest there can be costs to Bd infection even in resistant or tolerant host species like the American bullfrog [44,52]. Finally, gene expression, our key experimental outcome, also differed considerably between study species and Bd isolate treatments. Therefore, distinct molecular responses underlie chytridiomycosis disease progression, or lack thereof, in these two frog species.
While we made every attempt to design and implement a rigorous experimental study, we recognize some underlying assumptions and caveats that should inform interpretation of our results. First, our designation of American bullfrogs as a model ‘Bd-resistant species’ may simplify a complex disease response phenotype. Some wild American bullfrog populations have relatively high Bd prevalence and load [40,79], and one experimental study suggested that the species can develop chytridiomycosis [80]. Our results here, however, reinforce a pattern established in previous work wherein American bullfrogs were observed to readily resist Bd infection or suffer only relatively mild infections [39,41]. We based our initial assumption that American bullfrogs would largely resist Bd on these findings. Second, it is possible that not all of our study animals were truly Bd-naive. Wood frogs were collected as egg masses from the wild and hatched in controlled laboratory conditions. Thus, it is extremely unlikely they would have been subject to Bd exposure prior to experimentation. However, American bullfrogs were collected from the wild at the tadpole stage. This was a logistical necessity stemming from the extended larval period of this species [48], which precluded the time commitment necessary to rear individuals from eggs. Although we visually screened American bullfrog tadpoles for chytridiomycosis in the field [49] and further confirmed all study animals of both species to be Bd-negative via qPCR prior to experimentation, it remains possible that some study subjects had a prior history of Bd exposure that went undetected by our procedures. Third, numerous characters relevant to Bd response, including immunogenetic traits, can vary among amphibian populations within species [32,34,81,82]. Indeed, the potential variation in American bullfrog response to Bd mentioned above may be just such a population-specific phenotypic characteristic [39–41,79,80]. Therefore, experimental results on our two study species may be partially driven by particularities of the intraspecific variation represented at our collection localities. Certainly, more work comparing inter- and intraspecific variation in amphibian response to Bd is needed to characterize the relative magnitude of these influences. Generally, however, gene expression is expected to reflect phylogenetic relatedness, with populations within species showing greater similarity than comparisons among species [83,84].
Turning to our gene expression results, when comparing between Bd isolates, responses of exposed wood frogs provide evidence for varying disease severity and defence strategies. SL Bd-exposed wood frogs had much greater gene expression change overall compared to CM Bd-exposed animals, reflecting greater overall morbidity and mortality in this treatment group. Interestingly, all Bd-exposed wood frog treatment groups showed upregulation of adaptive immune system components, suggesting these frogs were beginning to mount an antigen-specific immune defence. Furthermore, explicit comparison of species' responses to Bd exposure revealed that adaptive and innate immune-related contigs were among those responding most differently between species, with greater expression in wood frogs relative to American bullfrogs. Therefore, immune system activation is a characteristic distinguishing wood frog Bd exposure responses from those of American bullfrogs. These results contrast with early studies on amphibian gene expression following Bd exposure that suggested a largely absent immune response [28,29] yet support more recent work that shows adaptive immune activation even, or especially, in species that succumb to chytridiomycosis [25,65]. Wood frogs exposed to SL Bd also differed from American bullfrogs in that they showed downregulation of various contigs related to skin integrity, including those annotated with the GO terms ‘desmosome organization’ (GO:0002934) and ‘adherens junction organization’ (GO:0034332), indicating cell adhesion functions. These findings are congruent with, and help generalize, previous studies indicating that resistant amphibian hosts tend to upregulate skin integrity pathways in response to Bd exposure, whereas in susceptible species these same pathways are often downregulated [25,85,86].
In our study, immune responses were especially apparent in PE SL Bd wood frogs, which had multiple terms related to both innate and adaptive immune function in their top enriched GO terms for upregulated contigs, adding to previous evidence that amphibians may develop immunological memory against Bd as a consequence of prior exposure [25,31]. However, even apparently primed defences were unable to prevent host death in this case. These trends in immune gene expression also reflect the unique patterns of gene expression we observed in the PE SL Bd treatment group more broadly. Although these animals shared a large proportion of differentially expressed contigs with the naive SL Bd individuals, they also had a unique response to exposure that represented hundreds of differentially expressed contigs. This stands in contrast to Ellison et al. [65], who found little evidence for differences in gene expression response between naive and previously exposed Atelopus frogs.
Whether adaptive immune responses were mounted by naive or experienced individuals, why were they apparently ineffective in defending wood frogs against SL Bd and preventing host mortality? First, increasing evidence suggests Bd actively inhibits essential components of the amphibian adaptive immune system [35–37], potentially rendering it ineffective. Second, immune responses can themselves be damaging to the host, as when widespread inflammation results in immunopathology [87]. Finally, immune defences are costly in general [88,89] and within the amphibian–Bd system specifically [51,52]. Therefore, immune activation can necessitate critical trade-offs with other organismal processes [90]. Compared to innate immune defences, trade-offs associated with adaptive immune responses may be especially pronounced [88]. Indeed, wood frogs exposed to Bd isolates showed downregulation of genes associated with GO terms including ‘water transport’ (GO:0006833), ‘locomotory behaviour’ (GO:0007626), ‘entrainment of circadian clock by photoperiod’ (GO:0043153), and ‘tissue development’ (GO:0009888), suggesting disruption of various organismal systems as a result of pathogen exposure and associated host responses. Concomitantly, CM Bd and PE SL Bd wood frogs had upregulation of the GO term ‘cellular response to glucocorticoid stimulus’ (GO:0071385). Glucocorticoid hormones regulate organismal stress responses and have been linked to chytridiomycosis pathogenesis [91,92], while increased activation of stress-related pathways may be a result of Bd exposure generally [28,86]. In sum, these results suggest Bd-exposed wood frogs manifested substantial physiological stress, which may be partly a consequence of mounting an adaptive immune response. Such costs are also reflected in the significant losses of body mass observed in these animals. The costs of immune system activation are likely to be especially detrimental in cases where they are not balanced by the benefits of effective host defence, as is often the case with chytridiomycosis. In these situations, immune responses may instead result in immunopathology and increased metabolic expenditure at the expense of maintaining other important homeostatic cellular functions.
Interestingly, wood frogs exposed to Bd had increased expression of the frog homologue of immune-responsive gene 1 (Irg1). Irg1 was upregulated in every Bd exposure treatment group relative to controls, and it seems especially relevant to wood frog response to CM Bd given that it was among the top 10 upregulated contigs in this exposure treatment at both the 3 and 10 day time points. Only recently has the mechanistic link between Irg1 and immune function been elucidated. The gene, which is commonly upregulated as a result of pathogen threat, codes for an enzyme that catalyses the conversion of cis-aconitate into itaconic acid [93]. In turn, itaconic acid inhibits a key step of the glyoxylate shunt, a metabolic pathway used by various microbes under certain environmental conditions; this inhibition accounts for itaconic acid's antimicrobial activity [93,94]. Critically, the glyoxylate shunt pathway contributes to virulence of fungal pathogens in general [95] and may be linked to Bd growth specifically [96]. Furthermore, Irg1 is upregulated in macrophages following pathogen challenge [93], and macrophages are among the innate immune cell types that are unaffected by the Bd inhibitory factors that disrupt the amphibian adaptive immune system [35]. Thus, Irg1 and itaconic acid deserve further attention as a feasible mechanism contributing to amphibian host control of Bd infection.
In contrast to wood frogs, American bullfrogs avoided chytridiomycosis without major changes in gene expression. The highly similar gene expression profiles of control and Bd-exposed American bullfrogs (figures 6–9), in conjunction with qPCR and histology results that showed generally low Bd loads or absence of infection, demonstrate that this species responds rapidly and effectively to limit Bd invasion with minimal disruption of normal physiology. These results all suggest American bullfrogs use constitutively active defences to combat Bd. Skin morphological characteristics are a good candidate for such a defence [16,18,86,97,98]. Specifically, American bullfrogs are known to slough rapidly following Bd exposure and have a thickened epidermis relative to wood frogs [18,99]. Skin sloughing can be an effective mechanism for reducing microbial abundance on the epidermis [19], and other amphibians are able to clear Bd infections through sloughing [20]. If the particular morphological characteristics of American bullfrogs allow for an increased rate or extent of skin sloughing, then these traits may explain the species' ability to rapidly clear Bd infection and resist chytridiomycosis [39,41].
Alternatively, other constitutively active skin-associated defences could account for American bullfrog avoidance of chytridiomycosis. We found evidence that at least two AMPs, belonging to the temporin and palustrin families, respectively, were highly expressed in American bullfrogs relative to wood frogs. These results are unsurprising given that AMP communities are highly species-specific [100]. American bullfrogs have a robust suite of at least 15 known AMPs [22,101,102], whereas wood frogs appear to produce only a single AMP [103,104]. In addition, AMP production can be environmentally influenced [103], and thus wood frogs might have had increased AMP defences under more favourable experimental conditions (e.g. increased temperature [105]). Finally, although all of our frogs were reared in a common environment, species-specific skin-associated microbes could represent another component of American bullfrog defences against Bd [106]. Amphibian skin can strongly filter environmental microbes [107], and thus the skin microbiota on American bullfrogs may have differed significantly from wood frogs at the time of Bd exposure despite the two species sharing a similar rearing environment. Although little work has directly examined the interactions between American bullfrog microbial communities and Bd, American bullfrog-associated bacterial species in the families Bacillaceae and Xanthomonadaceae deserve more attention for their potential role in host defence given their ability to inhibit dermatophyte fungi [108].
Despite great differences in realized virulence on amphibian hosts, our analyses showed little difference in gene expression between CM Bd and SL Bd. Virulence in Bd may be driven in part by the pathogen's basic growth rate. Previous work has reported more rapid growth of SL Bd than other isolates on amphibian hosts [45], which agrees with our results showing high infection loads in SL Bd-exposed frogs. We observed anecdotally that SL Bd grew more rapidly in culture than CM Bd, and prior data show that SL Bd also grows more densely at carrying capacity [45]. Virulence of SL and CM Bd isolates may, therefore, be driven by differences in the speed and severity of Bd invasion and resulting disruption of host tissues.
In conclusion, our two study species mount idiosyncratic defences to Bd threat, one successfully and the other far less so. Wood frogs employ adaptive immune responses that may defend against CM Bd but are clearly insufficient to prevent death after exposure to SL Bd. In addition, pathways associated with innate immune responses, such as Irg1-mediated catalysis of itaconic acid, may provide further defence from Bd. In contrast, American bullfrogs show little evidence of an adaptive immune response, yet they have better health outcomes after Bd exposure. Other recent work also found limited gene expression responses to Bd exposure in resistant amphibian hosts [85,86]. For example, in a comparative study of four species, Ellison et al. [85] found that gene expression of the most resistant amphibian tested, Agalychnis callidryas, was relatively unresponsive to Bd exposure. Similarly, Poorten & Rosenblum [86] evaluated a pair of bufonid species expected to differ in Bd susceptibility and showed that the more resistant congener had a much weaker transcriptional response to pathogen challenge. Thus, our results bolster the idea that a muted gene expression response may broadly characterize species that are not susceptible to chytridiomycosis. American bullfrog defences likely consist of a combination of species-specific skin morphological properties and skin-associated innate immune components. The present comparative study shows that while adaptive immune responses to Bd exist, they are not sufficient to ensure survival in some species and may be unnecessary in others. Our findings move us closer to understanding the complex system of defence mechanisms that can help amphibian species cope with the significant global threat posed by Bd.
Supplementary Material
Acknowledgements
We would like to thank H. Vogel and S. O'Rourke for their invaluable contributions to Bd culturing and RNA-seq library preparation, respectively. B. Andrews, M. Munn, C. Clay and J. Brooks all provided assistance with animal husbandry, and their efforts were further supplemented by the Teaching and Research Animal Care Services staff at UC Davis. W. Hopkins helped with animal collection. G. Pearson and D. Cocherell offered resources and advice that ensured optimal animal housing conditions. M. Settles, B. Durbin-Johnson, and the Bioinformatics Core at UC Davis provided guidance on bioinformatics analyses, and A. Whitehead made comments that greatly improved the manuscript.
Ethics
Field sampling was conducted under Virginia Department of Game and Inland Fisheries permit no. 050566. All experimental work used procedures approved by the UC Davis Institutional Animal Care and Use Committee under protocol no. 16444.
Data accessibility
Raw RNA sequencing data: NCBI Sequence Read Archive accession number SRP111327. Further data and code supporting all analyses are available at https://github.com/eveskew/frog_chytrid_transcriptomics.
Author contributions
E.A.E., J.E.F. and B.D.T. designed the study and obtained funding. E.A.E. executed the research and led all analyses. B.C.S., E.E.B.L. and K.K. conducted histological analyses. M.R.M. supervised sample collection, library preparation and data analysis for transcriptomics work. E.A.E. and B.D.T. interpreted the results and wrote the manuscript. All authors edited the manuscript and gave approval for publication.
Competing interests
We declare we have no competing interests.
Funding
This research was supported by a Signature Research in Genomics Program Award from the University of California, Davis, the Wildlife Health Center (School of Veterinary Medicine, University of California, Davis), a Henry A. Jastro Research Fellowship, and a Wildlife, Fish, and Conservation Biology Graduate Student Award. This material is based upon work supported by the National Science Foundation Graduate Research Fellowship under grant no. 1148897 to E.A.E.
References
- 1.Daszak P, Cunningham AA, Hyatt AD. 2000. Emerging infectious diseases of wildlife—threats to biodiversity and human health. Science 287, 443–449. (doi:10.1126/science.287.5452.443) [DOI] [PubMed] [Google Scholar]
- 2.Eskew EA, Todd BD. 2013. Parallels in amphibian and bat declines from pathogenic fungi. Emerg. Infect. Dis. 19, 379–385. (doi:10.3201/eid1903.120707) [DOI] [PMC free article] [PubMed] [Google Scholar]
- 3.Tompkins DM, Carver S, Jones ME, Krkošek M, Skerratt LF. 2015. Emerging infectious diseases of wildlife: a critical perspective. Trends Parasitol. 31, 149–159. (doi:10.1016/j.pt.2015.01.007) [DOI] [PubMed] [Google Scholar]
- 4.Stuart SN, Chanson JS, Cox NA, Young BE, Rodrigues ASL, Fischman DL, Waller RW. 2004. Status and trends of amphibian declines and extinctions worldwide. Science 306, 1783–1786. (doi:10.1126/science.1103538) [DOI] [PubMed] [Google Scholar]
- 5.Wake DB, Vredenburg VT. 2008. Are we in the midst of the sixth mass extinction? A view from the world of amphibians. Proc. Natl Acad. Sci. USA 105, 11 466–11 473. (doi:10.1073/pnas.0801921105) [DOI] [PMC free article] [PubMed] [Google Scholar]
- 6.Hof C, Araújo MB, Jetz W, Rahbek C. 2011. Additive threats from pathogens, climate and land-use change for global amphibian diversity. Nature 480, 516–519. (doi:10.1038/nature10650) [DOI] [PubMed] [Google Scholar]
- 7.Grant EHC, et al. 2016. Quantitative evidence for the effects of multiple drivers on continental-scale amphibian declines. Sci. Rep. 6, 25625 (doi:10.1038/srep25625) [DOI] [PMC free article] [PubMed] [Google Scholar]
- 8.Berger L, et al. 1998. Chytridiomycosis causes amphibian mortality associated with population declines in the rain forests of Australia and Central America. Proc. Natl Acad. Sci. USA 95, 9031–9036. (doi:10.1073/pnas.95.15.9031) [DOI] [PMC free article] [PubMed] [Google Scholar]
- 9.Longcore JE, Pessier AP, Nichols DK. 1999. Batrachochytrium dendrobatidis gen. et sp. nov., a chytrid pathogenic to amphibians. Mycologia 91, 219–227. (doi:10.2307/3761366) [Google Scholar]
- 10.Lips KR, et al. 2006. Emerging infectious disease and the loss of biodiversity in a Neotropical amphibian community. Proc. Natl Acad. Sci. USA 103, 3165–3170. (doi:10.1073/pnas.0506889103) [DOI] [PMC free article] [PubMed] [Google Scholar]
- 11.Voyles J, et al. 2009. Pathogenesis of chytridiomycosis, a cause of catastrophic amphibian declines. Science 326, 582–585. (doi:10.1126/science.1176765) [DOI] [PubMed] [Google Scholar]
- 12.Olson DH, et al. 2013. Mapping the global emergence of Batrachochytrium dendrobatidis, the amphibian chytrid fungus. PLoS ONE 8, e56802 (doi:10.1371/journal.pone.0056802) [DOI] [PMC free article] [PubMed] [Google Scholar]
- 13.Skerratt LF, Berger L, Speare R, Cashins S, McDonald KR, Phillott AD, Hines HB, Kenyon N. 2007. Spread of chytridiomycosis has caused the rapid global decline and extinction of frogs. EcoHealth 4, 125–134. (doi:10.1007/s10393-007-0093-5) [Google Scholar]
- 14.Retallick RWR, McCallum H, Speare R. 2004. Endemic infection of the amphibian chytrid fungus in a frog community post-decline. PLoS Biol. 2, e351 (doi:10.1371/journal.pbio.0020351) [DOI] [PMC free article] [PubMed] [Google Scholar]
- 15.Pilliod DS, Muths E, Scherer RD, Bartelt PE, Corn PS, Hossack BR, Lambert BA, McCaffery R, Gaughan C. 2010. Effects of amphibian chytrid fungus on individual survival probability in wild boreal toads. Conserv. Biol. 24, 1259–1267. (doi:10.1111/j.1523-1739.2010.01506.x) [DOI] [PubMed] [Google Scholar]
- 16.Woodhams DC, Ardipradja K, Alford RA, Marantelli G, Reinert LK, Rollins-Smith LA. 2007. Resistance to chytridiomycosis varies among amphibian species and is correlated with skin peptide defenses. Anim. Conserv. 10, 409–417. (doi:10.1111/j.1469-1795.2007.00130.x) [Google Scholar]
- 17.Gahl MK, Longcore JE, Houlahan JE. 2012. Varying responses of northeastern North American amphibians to the chytrid pathogen Batrachochytrium dendrobatidis. Conserv. Biol. 26, 135–141. (doi:10.1111/j.1523-1739.2011.01801.x) [DOI] [PubMed] [Google Scholar]
- 18.Greenspan SE, Longcore JE, Calhoun AJK. 2012. Host invasion by Batrachochytrium dendrobatidis: fungal and epidermal ultrastructure in model anurans. Dis. Aquat. Organ. 100, 201–210. (doi:10.3354/dao02483) [DOI] [PubMed] [Google Scholar]
- 19.Cramp RL, McPhee RK, Meyer EA, Ohmer ME, Franklin CE. 2014. First line of defence: the role of sloughing in the regulation of cutaneous microbes in frogs. Conserv. Physiol. 2, cou012 (doi:10.1093/conphys/cou012) [DOI] [PMC free article] [PubMed] [Google Scholar]
- 20.Ohmer MEB, Cramp RL, Russo CJM, White CR, Franklin CE. 2017. Skin sloughing in susceptible and resistant amphibians regulates infection with a fungal pathogen. Sci. Rep. 7, 3529 (doi:10.1038/s41598-017-03605-z) [DOI] [PMC free article] [PubMed] [Google Scholar]
- 21.Rollins-Smith LA. 2009. The role of amphibian antimicrobial peptides in protection of amphibians from pathogens linked to global amphibian declines. Biochim. Biophys. Acta 1788, 1593–1599. (doi:10.1016/j.bbamem.2009.03.008) [DOI] [PubMed] [Google Scholar]
- 22.Woodhams DC, et al. 2016. Life history linked to immune investment in developing amphibians. Conserv. Physiol. 4, cow025 (doi:10.1093/conphys/cow025) [DOI] [PMC free article] [PubMed] [Google Scholar]
- 23.Harris RN, et al. 2009. Skin microbes on frogs prevent morbidity and mortality caused by a lethal skin fungus. ISME J. 3, 818–824. (doi:10.1038/ismej.2009.27) [DOI] [PubMed] [Google Scholar]
- 24.Becker MH, et al. 2015. Composition of symbiotic bacteria predicts survival in Panamanian golden frogs infected with a lethal fungus. Proc. R. Soc. B 282, 20142881 (doi:10.1098/rspb.2014.2881) [DOI] [PMC free article] [PubMed] [Google Scholar]
- 25.Fu M, Waldman B. 2017. Major histocompatibility complex variation and the evolution of resistance to amphibian chytridiomycosis. Immunogenetics 69, 529–536. (doi:10.1007/s00251-017-1008-4) [DOI] [PubMed] [Google Scholar]
- 26.Stice MJ, Briggs CJ. 2010. Immunization is ineffective at preventing infection and mortality due to the amphibian chytrid fungus Batrachochytrium dendrobatidis. J. Wildlife Dis. 46, 70–77. (doi:10.7589/0090-3558-46.1.70) [DOI] [PubMed] [Google Scholar]
- 27.Cashins SD, Grogan LF, McFadden M, Hunter D, Harlow PS, Berger L, Skerratt LF. 2013. Prior infection does not improve survival against the amphibian disease chytridiomycosis. PLoS ONE 8, e56747 (doi:10.1371/journal.pone.0056747) [DOI] [PMC free article] [PubMed] [Google Scholar]
- 28.Rosenblum EB, Poorten TJ, Settles M, Murdoch GK, Robert J, Maddox N, Eisen MB. 2009. Genome-wide transcriptional response of Silurana (Xenopus) tropicalis to infection with the deadly chytrid fungus. PLoS ONE 4, e6494 (doi:10.1371/journal.pone.0006494) [DOI] [PMC free article] [PubMed] [Google Scholar]
- 29.Rosenblum EB, Poorten TJ, Settles M, Murdoch GK. 2012. Only skin deep: shared genetic response to the deadly chytrid fungus in susceptible frog species. Mol. Ecol. 21, 3110–3120. (doi:10.1111/j.1365-294X.2012.05481.x) [DOI] [PubMed] [Google Scholar]
- 30.Shaw SD, Bishop PJ, Berger L, Skerratt LF, Garland S, Gleeson DM, Haigh A, Herbert S, Speare R. 2010. Experimental infection of self-cured Leiopelma archeyi with the amphibian chytrid Batrachochytrium dendrobatidis. Dis. Aquat. Organ. 92, 159–163. (doi:10.3354/dao02227) [DOI] [PubMed] [Google Scholar]
- 31.McMahon TA, et al. 2014. Amphibians acquire resistance to live and dead fungus overcoming fungal immunosuppression. Nature 511, 224–227. (doi:10.1038/nature13491) [DOI] [PMC free article] [PubMed] [Google Scholar]
- 32.Savage AE, Zamudio KR. 2011. MHC genotypes associate with resistance to a frog-killing fungus. Proc. Natl Acad. Sci. USA 108, 16 705–16 710. (doi:10.1073/pnas.1106893108) [DOI] [PMC free article] [PubMed] [Google Scholar]
- 33.Bataille A, et al. 2015. Susceptibility of amphibians to chytridiomycosis is associated with MHC class II conformation. Proc. R. Soc. B 282, 20143127 (doi:10.1098/rspb.2014.3127) [DOI] [PMC free article] [PubMed] [Google Scholar]
- 34.Savage AE, Zamudio KR. 2016. Adaptive tolerance to a pathogenic fungus drives major histocompatibility complex evolution in natural amphibian populations. Proc. R. Soc. B 283, 20153115 (doi:10.1098/rspb.2015.3115) [DOI] [PMC free article] [PubMed] [Google Scholar]
- 35.Fites JS, et al. 2013. The invasive chytrid fungus of amphibians paralyzes lymphocyte responses. Science 342, 366–369. (doi:10.1126/science.1243316) [DOI] [PMC free article] [PubMed] [Google Scholar]
- 36.Fites JS, Reinert LK, Chappell TM, Rollins-Smith LA. 2014. Inhibition of local immune responses by the frog-killing fungus Batrachochytrium dendrobatidis. Infect. Immun. 82, 4698–4706. (doi:10.1128/IAI.02231-14) [DOI] [PMC free article] [PubMed] [Google Scholar]
- 37.Rollins-Smith LA, Fites JS, Reinert LK, Shiakolas AR, Umile TP, Minbiole KPC. 2015. Immunomodulatory metabolites released by the frog-killing fungus Batrachochytrium dendrobatidis. Infect. Immun. 83, 4565–4570. (doi:10.1128/IAI.00877-15) [DOI] [PMC free article] [PubMed] [Google Scholar]
- 38.Forzán MJ, Vanderstichel R, Hogan NS, Teather K, Wood J. 2010. Prevalence of Batrachochytrium dendrobatidis in three species of wild frogs on Prince Edward Island, Canada. Dis. Aquat. Organ. 91, 91–96. (doi:10.3354/dao02244) [DOI] [PubMed] [Google Scholar]
- 39.Daszak P, Strieby A, Cunningham AA, Longcore JE, Brown CC, Porter D. 2004. Experimental evidence that the bullfrog (Rana catesbeiana) is a potential carrier of chytridiomycosis, an emerging fungal disease of amphibians. Herpetol. J. 14, 201–207. [Google Scholar]
- 40.Hanselmann R, Rodríguez A, Lampo M, Fajardo-Ramos L, Aguirre AA, Kilpatrick AM, Rodríguez JP, Daszak P. 2004. Presence of an emerging pathogen of amphibians in introduced bullfrogs Rana catesbeiana in Venezuela. Biol. Conserv. 120, 115–119. (doi:10.1016/j.biocon.2004.02.013) [Google Scholar]
- 41.Eskew EA, Worth SJ, Foley JE, Todd BD. 2015. American bullfrogs (Lithobates catesbeianus) resist infection by multiple isolates of Batrachochytrium dendrobatidis, including one implicated in wild mass mortality. EcoHealth 12, 513–518. (doi:10.1007/s10393-015-1035-2) [DOI] [PubMed] [Google Scholar]
- 42.Garner TWJ, Perkins MW, Govindarajulu P, Seglie D, Walker S, Cunningham AA, Fisher MC. 2006. The emerging amphibian pathogen Batrachochytrium dendrobatidis globally infects introduced populations of the North American bullfrog, Rana catesbeiana. Biol. Lett. 2, 455–459. (doi:10.1098/rsbl.2006.0494) [DOI] [PMC free article] [PubMed] [Google Scholar]
- 43.Schloegel LM, Picco AM, Kilpatrick AM, Davies AJ, Hyatt AD, Daszak P. 2009. Magnitude of the US trade in amphibians and presence of Batrachochytrium dendrobatidis and ranavirus infection in imported North American bullfrogs (Rana catesbeiana). Biol. Conserv. 142, 1420–1426. (doi:10.1016/j.biocon.2009.02.007) [Google Scholar]
- 44.Retallick RWR, Miera V. 2007. Strain differences in the amphibian chytrid Batrachochytrium dendrobatidis and non-permanent, sub-lethal effects of infection. Dis. Aquat. Organ. 75, 201–207. (doi:10.3354/dao075201) [DOI] [PubMed] [Google Scholar]
- 45.Piovia-Scott J, et al. 2015. Correlates of virulence in a frog-killing fungal pathogen: evidence from a California amphibian decline. ISME J. 9, 1570–1578. (doi:10.1038/ismej.2014.241) [DOI] [PMC free article] [PubMed] [Google Scholar]
- 46.Westermann AJ, Gorski SA, Vogel J. 2012. Dual RNA-seq of pathogen and host. Nat. Rev. Microbiol. 10, 618–630. (doi:10.1038/nrmicro2852) [DOI] [PubMed] [Google Scholar]
- 47.Field KA, Johnson JS, Lilley TM, Reeder SM, Rogers EJ, Behr MJ, Reeder DM. 2015. The white-nose syndrome transcriptome: activation of anti-fungal host responses in wing tissue of hibernating little brown myotis. PLoS Pathog. 11, e1005168 (doi:10.1371/journal.ppat.1005168) [DOI] [PMC free article] [PubMed] [Google Scholar]
- 48.Stebbins RC. 2003. A field guide to western reptiles and amphibians. New York, NY: Houghton Mifflin Company. [Google Scholar]
- 49.Knapp RA, Morgan JAT. 2006. Tadpole mouthpart depigmentation as an accurate indicator of chytridiomycosis, an emerging disease of amphibians. Copeia 2006, 188–197. (doi:10.1643/0045-8511(2006)6[188:TMDAAA]2.0.CO;2) [Google Scholar]
- 50.Therneau TM. 2014. A package for survival analysis in S. R package version 2.37-7. See https://CRAN.R-project.org/package=survival.
- 51.Ramsey JP, Reinert LK, Harper LK, Woodhams DC, Rollins-Smith LA. 2010. Immune defenses against Batrachochytrium dendrobatidis, a fungus linked to global amphibian declines, in the South African clawed frog, Xenopus laevis. Infect. Immun. 78, 3981–3992. (doi:10.1128/IAI.00402-10) [DOI] [PMC free article] [PubMed] [Google Scholar]
- 52.Cheatsazan H, Lugon Gavinho de Almedia AP, Russell AF, Bonneaud C. 2013. Experimental evidence for a cost of resistance to the fungal pathogen, Batrachochytrium dendrobatidis, for the palmate newt, Lissotriton helveticus. BMC Ecol. 13, 27 (doi:10.1186/1472-6785-13-27) [DOI] [PMC free article] [PubMed] [Google Scholar]
- 53.Bielby J, Fisher MC, Clare FC, Rosa GM, Garner TWJ. 2015. Host species vary in infection probability, sub-lethal effects, and costs of immune response when exposed to an amphibian parasite. Sci. Rep. 5, 10828 (doi:10.1038/srep10828) [DOI] [PMC free article] [PubMed] [Google Scholar]
- 54.Bovo RP, Andrade DV, Toledo LF, Longo AV, Rodriguez D, Haddad CFB, Zamudio KR, Becker CG. 2016. Physiological responses of Brazilian amphibians to an enzootic infection of the chytrid fungus Batrachochytrium dendrobatidis. Dis. Aquat. Organ. 117, 245–252. (doi:10.3354/dao02940) [DOI] [PubMed] [Google Scholar]
- 55.Bates D, Mächler M, Bolker BM, Walker SC. 2015. Fitting linear mixed-effects models using lme4. J. Stat. Softw. 67, 1–48. (doi:10.18637/jss.v067.i01) [Google Scholar]
- 56.McElreath R. 2015. rethinking: Statistical Rethinking book package. R package version 1.57. See https://github.com/rmcelreath/rethinking.
- 57.Boyle DG, Boyle DB, Olsen V, Morgan JAT, Hyatt AD. 2004. Rapid quantitative detection of chytridiomycosis (Batrachochytrium dendrobatidis) in amphibian samples using real-time Taqman PCR assay. Dis. Aquat. Organ. 60, 141–148. (doi:10.3354/dao060141) [DOI] [PubMed] [Google Scholar]
- 58.Hyatt AD, et al. 2007. Diagnostic assays and sampling protocols for the detection of Batrachochytrium dendrobatidis. Dis. Aquat. Organ. 73, 175–192. (doi:10.3354/dao073175) [DOI] [PubMed] [Google Scholar]
- 59.Kriger KM, Hero J-M, Ashton KJ. 2006. Cost efficiency in the detection of chytridiomycosis using PCR assay. Dis. Aquat. Organ. 71, 149–154. (doi:10.3354/dao071149) [DOI] [PubMed] [Google Scholar]
- 60.Smith KG. 2007. Use of quantitative PCR assay for amphibian chytrid detection: comment on Kriger et al. (2006a,b). Dis. Aquat. Organ. 73, 253–255. (doi:10.3354/dao073253) [DOI] [PubMed] [Google Scholar]
- 61.Clare F, Daniel O, Garner T, Fisher M. 2016. Assessing the ability of swab data to determine the true burden of infection for the amphibian pathogen Batrachochytrium dendrobatidis. EcoHealth 13, 360–367. (doi:10.1007/s10393-016-1114-z) [DOI] [PMC free article] [PubMed] [Google Scholar]
- 62.Streett DA, Petersen KR, Gerritsen AT, Hunter SS, Settles ML. 2015. expHTS: analysis of high throughput sequence data in an experimental framework In Proc. 6th ACM Conf. on Bioinformatics, Computational Biology and Health Informatics, Atlanta, GA, USA, 9–12 September 2015, pp. 523–524. New York, NY: ACM (doi:10.1145/2808719.2811442) [Google Scholar]
- 63.Robertson LS, Cornman RS. 2014. Transcriptome resources for the frogs Lithobates clamitans and Pseudacris regilla, emphasizing antimicrobial peptides and conserved loci for phylogenetics. Mol. Ecol. Resour. 14, 178–183. (doi:10.1111/1755-0998.12164) [DOI] [PubMed] [Google Scholar]
- 64.Lemay MA, Donnelly DJ, Russello MA. 2013. Transcriptome-wide comparison of sequence variation in divergent ecotypes of kokanee salmon. BMC Genom. 14, 308 (doi:10.1186/1471-2164-14-308) [DOI] [PMC free article] [PubMed] [Google Scholar]
- 65.Ellison AR, Savage AE, DiRenzo GV, Langhammer P, Lips KR, Zamudio KR. 2014. Fighting a losing battle: vigorous immune response countered by pathogen suppression of host defenses in the chytridiomycosis-susceptible frog Atelopus zeteki. G3 (Bethesda) 4, 1275–1289. (doi:10.1534/g3.114.010744) [DOI] [PMC free article] [PubMed] [Google Scholar]
- 66.Longo AV, Burrowes PA, Zamudio KR. 2014. Genomic studies of disease-outcome in host–pathogen dynamics. Integr. Comp. Biol. 54, 427–438. (doi:10.1093/icb/icu073) [DOI] [PubMed] [Google Scholar]
- 67.Patro R, Duggal G, Love MI, Irizarry RA, Kingsford C. 2017. Salmon provides fast and bias-aware quantification of transcript expression. Nat. Methods 14, 417–419. (doi:10.1038/nmeth.4197) [DOI] [PMC free article] [PubMed] [Google Scholar]
- 68.Robinson MD, Smyth GK. 2007. Moderated statistical tests for assessing differences in tag abundance. Bioinformatics 23, 2881–2887. (doi:10.1093/bioinformatics/btm453) [DOI] [PubMed] [Google Scholar]
- 69.Robinson MD, Smyth GK. 2008. Small-sample estimation of negative binomial dispersion, with applications to SAGE data. Biostatistics 9, 321–332. (doi:10.1093/biostatistics/kxm030) [DOI] [PubMed] [Google Scholar]
- 70.Robinson MD, McCarthy DJ, Smyth GK. 2010. edgeR: a Bioconductor package for differential expression analysis of digital gene expression data. Bioinformatics 26, 139–140. (doi:10.1093/bioinformatics/btp616) [DOI] [PMC free article] [PubMed] [Google Scholar]
- 71.Lund SP, Nettleton D, McCarthy DJ, Smyth GK. 2012. Detecting differential expression in RNA-sequence data using quasi-likelihood with shrunken dispersion estimates. Stat. Appl. Genet. Molec. Biol. 11, 8 (doi:10.1515/1544-6115.1826) [DOI] [PubMed] [Google Scholar]
- 72.Ritchie ME, Phipson B, Wu D, Hu Y, Law CW, Shi W, Smyth GK. 2015. limma powers differential expression analyses for RNA-sequencing and microarray studies. Nucleic Acids Res. 43, e47 (doi:10.1093/nar/gkv007) [DOI] [PMC free article] [PubMed] [Google Scholar]
- 73.Warnes GR, et al. 2016. gplots: various R programming tools for plotting data. R package version 3.0.1. See https://CRAN.R-project.org/package=gplots .
- 74.Haas BJ, et al. 2013. De novo transcript sequence reconstruction from RNA-seq using the Trinity platform for reference generation and analysis. Nat. Protoc. 8, 1494–1512. (doi:10.1038/nprot.2013.084) [DOI] [PMC free article] [PubMed] [Google Scholar]
- 75.Altschul SF, Gish W, Miller W, Myers EW, Lipman DJ. 1990. Basic local alignment search tool. J. Mol. Biol. 215, 403–410. (doi:10.1016/S0022-2836(05)80360-2) [DOI] [PubMed] [Google Scholar]
- 76.Ashburner M, et al. 2000. Gene Ontology: tool for the unification of biology. Nat. Genet. 25, 25–29. (doi:10.1038/75556) [DOI] [PMC free article] [PubMed] [Google Scholar]
- 77.Falcon S, Gentleman R. 2007. Using GOstats to test gene lists for GO term association. Bioinformatics 23, 257–258. (doi:10.1093/bioinformatics/btl567) [DOI] [PubMed] [Google Scholar]
- 78.Shin J, Bataille A, Kosch TA, Waldman B. 2014. Swabbing often fails to detect amphibian chytridiomycosis under conditions of low infection load. PLoS ONE 9, e111091 (doi:10.1371/journal.pone.0111091) [DOI] [PMC free article] [PubMed] [Google Scholar]
- 79.Adams AJ, Pessier AP, Briggs CJ. 2017. Rapid extirpation of a North American frog coincides with an increase in fungal pathogen prevalence: historical analysis and implications for reintroduction. Ecol. Evol. 7, 10 216–10 232. (doi:10.1002/ece3.3468) [DOI] [PMC free article] [PubMed] [Google Scholar]
- 80.Gervasi SS, Urbina J, Hua J, Chestnut T, Relyea RA, Blaustein AR. 2013. Experimental evidence for American bullfrog (Lithobates catesbeianus) susceptibility to chytrid fungus (Batrachochytrium dendrobatidis). EcoHealth 10, 166–171. (doi:10.1007/s10393-013-0832-8) [DOI] [PubMed] [Google Scholar]
- 81.Bradley PW, Gervasi SS, Hua J, Cothran RD, Relyea RA, Olson DH, Blaustein AR. 2015. Differences in sensitivity to the fungal pathogen Batrachochytrium dendrobatidis among amphibian populations. Conserv. Biol. 29, 1347–1356. (doi:10.1111/cobi.12566) [DOI] [PubMed] [Google Scholar]
- 82.Knapp RA, Fellers GM, Kleeman PM, Miller DAW, Vredenburg VT, Rosenblum EB, Briggs CJ. 2016. Large-scale recovery of an endangered amphibian despite ongoing exposure to multiple stressors. Proc. Natl Acad. Sci. USA 113, 11 889–11 894. (doi:10.1073/pnas.1600983113) [DOI] [PMC free article] [PubMed] [Google Scholar]
- 83.Whitehead A, Crawford DL. 2006. Variation within and among species in gene expression: raw material for evolution. Mol. Ecol. 15, 1197–1211. (doi:10.1111/j.1365-294X.2006.02868.x) [DOI] [PubMed] [Google Scholar]
- 84.Whitehead A, Zhang S, Roach JL, Galvez F. 2013. Common functional targets of adaptive micro- and macro-evolutionary divergence in killifish. Mol. Ecol. 22, 3780–3796. (doi:10.1111/mec.12316) [DOI] [PubMed] [Google Scholar]
- 85.Ellison AR, et al. 2015. More than skin deep: functional genomic basis for resistance to amphibian chytridiomycosis. Genome Biol. Evol. 7, 286–298. (doi:10.1093/gbe/evu285) [DOI] [PMC free article] [PubMed] [Google Scholar]
- 86.Poorten TJ, Rosenblum EB. 2016. Comparative study of host response to chytridiomycosis in a susceptible and a resistant toad species. Mol. Ecol. 25, 5663–5679. (doi:10.1111/mec.13871) [DOI] [PubMed] [Google Scholar]
- 87.Sears BF, Rohr JR, Allen JE, Martin LB. 2011. The economy of inflammation: when is less more? Trends Parasitol. 27, 382–387. (doi:10.1016/j.pt.2011.05.004) [DOI] [PubMed] [Google Scholar]
- 88.Lochmiller RL, Deerenberg C. 2000. Trade-offs in evolutionary immunology: just what is the cost of immunity? Oikos 88, 87–98. (doi:10.1034/j.1600-0706.2000.880110.x) [Google Scholar]
- 89.Moret Y, Schmid-Hempel P. 2000. Survival for immunity: the price of immune system activation for bumblebee workers. Science 290, 1166–1168. (doi:10.1126/science.290.5494.1166) [DOI] [PubMed] [Google Scholar]
- 90.Sheldon BC, Verhulst S. 1996. Ecological immunology: costly parasite defences and trade-offs in evolutionary ecology. Trends Ecol. Evol. 11, 317–321. (doi:10.1016/0169-5347(96)10039-2) [DOI] [PubMed] [Google Scholar]
- 91.Peterson JD, Steffen JE, Reinert LK, Cobine PA, Appel A, Rollins-Smith L, Mendonça MT. 2013. Host stress response is important for the pathogenesis of the deadly amphibian disease, chytridiomycosis, in Litoria caerulea. PLoS ONE 8, e62146 (doi:10.1371/journal.pone.0062146) [DOI] [PMC free article] [PubMed] [Google Scholar]
- 92.Rollins-Smith LA. 2017. Amphibian immunity—stress, disease, and climate change. Dev. Comp. Immunol. 66, 111–119. (doi:10.1016/j.dci.2016.07.002) [DOI] [PubMed] [Google Scholar]
- 93.Michelucci A, et al. 2013. Immune-responsive gene 1 protein links metabolism to immunity by catalyzing itaconic acid production. Proc. Natl Acad. Sci. USA 110, 7820–7825. (doi:10.1073/pnas.1218599110) [DOI] [PMC free article] [PubMed] [Google Scholar]
- 94.Ménage S, Attrée I. 2014. Pathogens love the poison. Nat. Chem. Biol. 10, 326–327. (doi:10.1038/nchembio.1505) [DOI] [PubMed] [Google Scholar]
- 95.Lorenz MC, Fink GR. 2001. The glyoxylate cycle is required for fungal virulence. Nature 412, 83–86. (doi:10.1038/35083594) [DOI] [PubMed] [Google Scholar]
- 96.Thekkiniath J, Zabet-Moghaddam M, Kottapalli KR, Pasham MR, San Francisco S, San Francisco M. 2015. Quantitative proteomics of an amphibian pathogen, Batrachochytrium dendrobatidis, following exposure to thyroid hormone. PLoS ONE 10, e0123637 (doi:10.1371/journal.pone.0123637) [DOI] [PMC free article] [PubMed] [Google Scholar]
- 97.Van Rooij P, Martel A, D'Herde K, Brutyn M, Croubels S, Ducatelle R, Haesebrouck F, Pasmans F. 2012. Germ tube mediated invasion of Batrachochytrium dendrobatidis in amphibian skin is host dependent. PLoS ONE 7, e41481 (doi:10.1371/journal.pone.0041481) [DOI] [PMC free article] [PubMed] [Google Scholar]
- 98.Van Rooij P, Martel A, Haesebrouck F, Pasmans F. 2015. Amphibian chytridiomycosis: a review with focus on fungus-host interactions. Vet. Res. 46, 137 (doi:10.1186/s13567-015-0266-0) [DOI] [PMC free article] [PubMed] [Google Scholar]
- 99.Greenspan SE, Calhoun AJK, Longcore JE, Levy MG. 2012. Transmission of Batrachochytrium dendrobatidis to wood frogs (Lithobates sylvaticus) via a bullfrog (L. catesbeianus) vector. J. Wildlife Dis. 48, 575–582. (doi:10.7589/0090-3558-48.3.575) [DOI] [PubMed] [Google Scholar]
- 100.Goraya J, Wang Y, Li Z, O'Flaherty M, Knoop FC, Platz JE, Conlon JM. 2000. Peptides with antimicrobial activity from four different families isolated from the skins of the North American frogs Rana luteiventris, Rana berlandieri and Rana pipiens. Eur. J. Biochem. 267, 894–900. (doi:10.1046/j.1432-1327.2000.01074.x) [DOI] [PubMed] [Google Scholar]
- 101.Goraya J, Knoop FC, Conlon JM. 1998. Ranatuerins: antimicrobial peptides isolated from the skin of the American bullfrog, Rana catesbeiana. Biochem. Biophys. Res. Commun. 250, 589–592. (doi:10.1006/bbrc.1998.9362) [DOI] [PubMed] [Google Scholar]
- 102.Mechkarska M, Ojo OO, Meetani MA, Coquet L, Jouenne T, Abdel-Wahab YHA, Flatt PR, King JD, Conlon JM. 2011. Peptidomic analysis of skin secretions from the bullfrog Lithobates catesbeianus (Ranidae) identifies multiple peptides with potent insulin-releasing activity. Peptides 32, 203–208. (doi:10.1016/j.peptides.2010.11.002) [DOI] [PubMed] [Google Scholar]
- 103.Matutte B, Storey KB, Knoop FC, Conlon JM. 2000. Induction of synthesis of an antimicrobial peptide in the skin of the freeze-tolerant frog, Rana sylvatica, in response to environmental stimuli. FEBS Lett. 483, 135–138. (doi:10.1016/S0014-5793(00)02102-5) [DOI] [PubMed] [Google Scholar]
- 104.Katzenback BA, Holden HA, Falardeau J, Childers C, Hadj-Moussa H, Avis TJ, Storey KB. 2014. Regulation of the Rana sylvatica brevinin-1SY antimicrobial peptide during development and in dorsal and ventral skin in response to freezing, anoxia and dehydration. J. Exp. Biol. 217, 1392–1401. (doi:10.1242/jeb.092288) [DOI] [PubMed] [Google Scholar]
- 105.Nowakowski AJ, Whitfield SM, Eskew EA, Thompson ME, Rose JP, Caraballo BL, Kerby JL, Donnelly MA, Todd BD. 2016. Infection risk decreases with increasing mismatch in host and pathogen environmental tolerances. Ecol. Lett. 19, 1051–1061. (doi:10.1111/ele.12641) [DOI] [PubMed] [Google Scholar]
- 106.Kueneman JG, Parfrey LW, Woodhams DC, Archer HM, Knight R, McKenzie VJ. 2014. The amphibian skin-associated microbiome across species, space and life history stages. Mol. Ecol. 23, 1238–1250. (doi:10.1111/mec.12510) [DOI] [PubMed] [Google Scholar]
- 107.Walke JB, Becker MH, Loftus SC, House LL, Cormier G, Jensen RV, Belden LK. 2014. Amphibian skin may select for rare environmental microbes. ISME J. 8, 2207–2217. (doi:10.1038/ismej.2014.77) [DOI] [PMC free article] [PubMed] [Google Scholar]
- 108.Lauer A, Hernandez T. 2015. Cutaneous bacterial species from Lithobates catesbeianus can inhibit pathogenic dermatophytes. Mycopathologia 179, 259–268. (doi:10.1007/s11046-014-9838-1) [DOI] [PubMed] [Google Scholar]
Associated Data
This section collects any data citations, data availability statements, or supplementary materials included in this article.
Supplementary Materials
Data Availability Statement
Raw RNA sequencing data: NCBI Sequence Read Archive accession number SRP111327. Further data and code supporting all analyses are available at https://github.com/eveskew/frog_chytrid_transcriptomics.