Abstract
Ca2+ sparks and Ca2+ quarks, arising from clustered and rogue ryanodine receptors (RyRs), are significant Ca2+ release events from the junctional sarcoplasmic reticulum (JSR). Based on the anomalous subdiffusion of Ca2+ in the cytoplasm, a mathematical model was developed to investigate the effects of rogue RyRs on Ca2+ sparks in cardiac myocytes. Ca2+ quarks and sparks from the stochastic opening of rogue and clustered RyRs are numerically reproduced and agree with experimental measurements. It is found that the stochastic opening Ca2+ release units (CRUs) of clustered RyRs are regulated by free Ca2+ concentration in the JSR lumen (i.e. [Ca2+]lumen). The frequency of spontaneous Ca2+ sparks is remarkably increased by the rogue RyRs opening at high [Ca2+]lumen, but not at low [Ca2+]lumen. Hence, the opening of rogue RyRs contributes to the formation of Ca2+ sparks at high [Ca2+]lumen. The interplay of Ca2+ sparks and Ca2+ quarks has been discussed in detail. This work is of significance to provide insight into understanding Ca2+ release mechanisms in cardiac myocytes.
Keywords: Ca2+ spark, Ca2+ quark, anomalous subdiffusion, rogue ryanodine receptors
1. Introduction
Ca2+ sparks regulate the excitation–contraction coupling in heart muscle [1–3], and are activated by the opening of clustered ryanodine receptors (RyRs) on the junctional sarcoplasmic reticulum (JSR) membrane [4–6]. Recently, the discovery of quarky Ca2+ releases (QCRs or Ca2+ quarks) due to the opening of rogue RyRs has been shown as a significant Ca2+ release mechanism relevant to ‘invisible Ca2+ leak’ [7–9]. Here, rogue RyRs refer to RyR channels located near clustered RyRs within a JSR, defined as ‘junctional rogue RyRs’. Although Ca2+ sparks and quarks occur spontaneously and concurrently in the cytoplasm under physiological conditions, Ca2+ quarks feature different properties from Ca2+ sparks, e.g. a smaller amplitude with a high firing frequency and a longer duration [10].
Zima et al. [11] demonstrated experimentally that single RyR opening could mediate Ca2+ leak but fails to trigger Ca2+ sparks when free Ca2+ concentration in the JSR lumen ([Ca2+]lumen) is below a threshold level. On the other hand, mathematical models have been developed to investigate the dynamics of Ca2+ sparks and quarks. Sobie et al. [12] proposed a model to solve the paradox of [Ca2+]lumen to support the existence of rogue RyRs. Models of Ca2+ leak from JSRs have been used to characterize differences between Ca2+ sparks and quarks [13]. Walker et al. [14] included the computational nonspark-based Ca2+ leak from JSRs to explain the exponential rise of Ca2+ spark frequency. They further presented that Ca2+ sparks could be triggered by spontaneous opening of a single RyR in a cluster [15]. A stochastic contact network model of the Ca2+ initiation process was applied to realistic RyR cluster structures, which revealed that the Ca2+ sparks probability depends on the position of the initial RyR in the cluster. Their works provided insight into the Ca2+ release process in the heart and a framework for evaluating functional heterogeneity in populations of receptor clusters under normal and pathological conditions. Lu et al. [16,17] investigated ‘non-junctional rogue RyRs’ located away from the release sites and showed their effects on Ca2+ waves with heart failure. It suggested that Ca2+ dynamics was unstable and Ca2+ waves were likely to be triggered when ‘non-junctional rogue RyRs’ were taken into consideration. The variation of membrane potential depolarization was indicated to be dependent on the distribution density of rogue RyR channels, which is important for understanding the arrhythmogenic mechanism for heart failure from the subcellular to cellular level. Sato and Bers [18] used a mathematical model of JSR Ca2+ releases to show that single RyR opening at low [Ca2+]lumen could not recruit Ca2+ sparks from Ca2+ release units (CRUs). However, the effects of rogue RyRs on Ca2+ sparks at high [Ca2+]lumen remain unknown. The anomalous subdiffusion of cytoplasmic Ca2+ and the random distribution of JSR RyRs, unnoticed in these models, could unveil the temporal and spatial properties of Ca2+ sparks and quarks.
The objective of the study is to develop a mathematical model of JSR Ca2+ release to quantify the interplay of rogue and clustered RyRs for a detailed explanation of spontaneous Ca2+ sparks and quarks in cardiac myocytes under physiological conditions. A mathematical model was proposed to simulate the temporal and two-dimensional (2D) spatial distributions of Ca2+ sparks and quarks in a cardiac myocyte with consideration of the distribution of clustered and rogue RyRs on the JSR membrane and the anomalous subdiffusion of Ca2+ in the cytoplasm [19]. The model could explain various Ca2+ release events from a JSR and predict the firing probability of clustered RyRs activated by Ca2+ release through rogue RyRs. The stochastic opening of rogue and clustered RyRs was regulated by free Ca2+ concentrations in both cytoplasm and JSR lumen of a cardiac myocyte. The line-scan experimental measurements were carried out in cardiac myocytes of rats to validate the present model. The significance was discussed to improve the understanding of Ca2+-induced-Ca2+-release events in cardiac myocytes.
2. Material and methods
2.1. Experimental methods
Similar to previous studies [20–22], eight Sprague-Dawley rats (about 2.5 months old, 225–300 g) were anaesthetized with pentobarbital sodium (40 mg kg−1) by peritoneal injection. Hearts were rapidly excised from animals. An isolated heart was immediately put into ice cold buffer, mounted in a Langendorff system, and perfused with a Ca2+-free buffer containing (in mM): 137 NaCl, 5.4 KCl, 1.2 MgCl2, 1.2 Na2HPO4, 20 HEPES, 10 taurine, and 10 glucose (at a pH value of 7.35, aerated with 95% O2 and 5% CO2) for 5 min. The heart was then digested in a buffer containing 0.5 mg ml−1 collagenase, 1 mg ml−1 bovine serum albumin, 0.06 mg ml−1 protease (type X-IV) and 50 µM CaCl2 until becoming pale. The left ventricle was sectioned into small pieces and incubated in the digesting solution. Myocytes were harvested and stored in Tyrode's solution containing (in mM): 135 NaCl, 1 CaCl2, 4 KCl, 1.2 MgCl2, 1.2 Na2HPO4, 10 glucose, and 10 HEPES with a pH value of 7.35. Before imaging, myocytes were loaded with the dye Fluo-4-AM for 5 min and washed twice using the Tyrode's solution. A confocal microscope (Nikon A1+, Japan) equipped with a 40 × 1.3 NA oil immersion objective was used for line-scan images at a sample rate of 512 frames s−1. The samples were excited at 488 nm. All line-scan measurements were performed at room temperature (23–25°C). Images were processed by the SparkMaster software [23].
2.2. Geometrical model
In a 2D model similar to Izu et al. [24], the regular intervals between Ca2+ release sites are lx (= 2 µm) in the longitudinal direction (x-axis) and ly (= 0.8 µm) in the transverse direction (y-axis). Figure 1a shows the geometrical model of a cardiac myocyte. Each Ca2+ release site represents a JSR. The schematic representative of a JSR is shown in figure 1b, which includes randomly distributed clustered RyRs and rogue RyRs. A CRU of clustered RyRs has 22 RyR channels and a rogue RyR has 3 RyR channels [5]. Figure 1c shows the distribution of clustered and rogue RyRs on a JSR for simulation. CRUs of clustered RyRs (blue dots, approx. 2 in a JSR) are surrounded by randomly distributed rogue RyRs (red dots, approx. 8 in a JSR). The number and location of clustered and rogue RyRs in each JSR are random in simulations.
Figure 1.
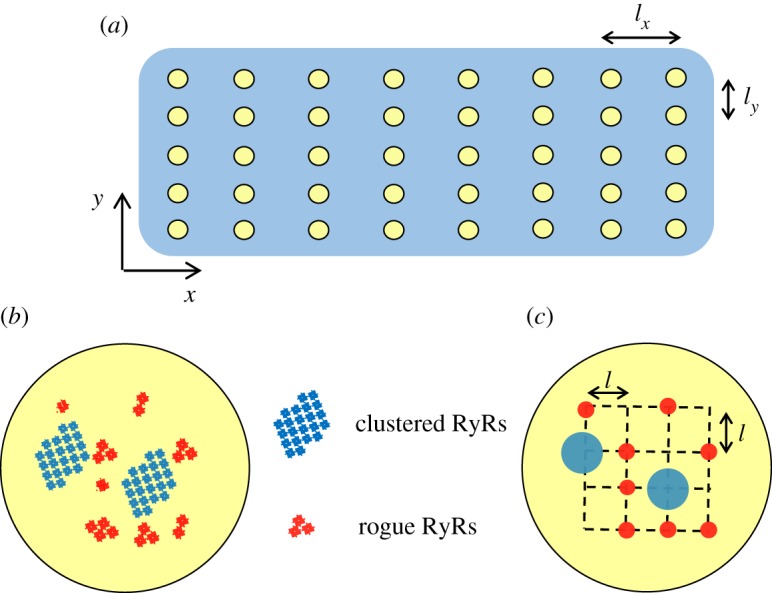
Geometrical model. (a) Schematic representation of the 2D geometrical model of a cardiac myocyte. The yellow dots denote JSRs with regularly spaced intervals: lx = 2 µm and ly = 0.8 µm. (b) Schematic representation of a JSR, which includes randomly distributed clustered and rogue RyRs. (c) The distribution of clustered and rogue RyRs in a JSR for simulation (l = 0.1 µm). Two CRUs of clustered RyRs (blue dots) are surrounded by eight rogue RyRs (red dots) on the JSR as shown in (b). The number and location of clustered and rogue RyRs are random in simulations.
2.3. Computational model
The balanced equation for free Ca2+ concentration in the cytoplasm, , with consideration of the anomalous subdiffusion of Ca2+ in the cytoplasm and the distribution of clustered and rogue RyRs, can be written as:
| 2.1 |
where t is time, x and y denote the spatial coordinates, Dx (= 300 µm2 s-1) and Dy (= 150 µm2 s−1) refer to the Ca2+ diffusion coefficients. The anomalous subdiffusion order β is 2.25. Anomalous space subdiffusion corresponds to the short jump of the random walker and is defined though the relations [25]
| 2.2 |
and
| 2.3 |
where Γ denotes the Gamma function. and are the fluxes due to the Ca2+ fluorescent indicator dye (i.e. Rhod-2 or Fluo-4-AM, in the cytoplasm) and the endogenous stationary buffers respectively. Jpump is the pumping rate of SR Ca2+-ATPase. SR pumps are started when exceeds the resting Ca2+ concentration level (0.1 µM) in the cytoplasm. These variables can all be defined as:
| 2.4 |
| 2.5 |
| 2.6 |
| 2.7 |
where the subscript ‘n’ refers to each buffer in the cytoplasm, the superscript ‘h’ refers to the Hill constant; [F]T and [Bn]T represent the total concentrations of indicator and buffers, respectively. [CaF] and [CaBn] are the concentrations of Ca2+-bound complexes; , , and are the reaction kinetic parameters. Kpump is the affinity constant, and is the maximum rate for SR pumps. Values of the parameters are based on a previous study [26]. Moreover, Jrogue and Jclustered are the Ca2+ fluxes released by rogue and clustered RyRs respectively, which can be written as:
| 2.8 |
and
| 2.9 |
where δ is the Dirac delta function and S is a stochastic function for the opening of clustered and rogue RyRs; and are the positions of rogue RyRs and clustered RyRs in the 2D plane respectively. The release times for rogue and clustered RyRs are defined as Trogue= 20 ms [10] and Tclustered= 10 ms [27]. The equivalent source strength of rogue RyRs and clustered RyRs [28] are expressed by
| 2.10 |
and
| 2.11 |
where the Faraday constant F is 96 500 C mol−1, and Irogue and Iclustered are the average currents through rogue and clustered RyRs, set to be 0.07 pA mM−1 and 0.7 pA mM−1. Note that Ca2+ is released from the JSR lumen into a 3D volume in the cytoplasm of a cardiac myocyte. The conversion factor 0.64 in equations (2.10) and (2.11) is used to give the identical Ca2+ distribution in 2D [24]. Equation (2.1) can describe the Ca2+ release mechanism of Ca2+ sparks only when Jrogue = 0, or QCRs only when Jclustered = 0.
Conversely, the balance equation for free Ca2+ concentration in each JSR lumen, , can be written as
| 2.12 |
where denotes the decreased Ca2+ release flux caused by opening of clustered RyRs (Jclustered) and rogue RyRs (Jrogue) in a JSR. Jrefill is the refilled Ca2+ flux and expressed by
| 2.13 |
where free Ca2+ concentration in network sarcoplasmic reticulum (NSR) [Ca2+]NSR is 1.0 mM, time constant for Ca2+ transfer between JSR and NSR is 10 ms, and the volume of a JSR lumen is 1 × 10⁻¹¹ µl [29]. [Ca2+]lumen is less than the beginning level 1.0 mM as a result of Ca2+ release at a certain time. and are the Ca2+ fluxes due to indicator dye (i.e. Fluo-5N) and buffer (i.e. calsequestrin) in a JSR lumen, respectively. Their expressions are similar to that in the cytoplasm. Various parameters of dyes (Rhod-2 [30], Fluo-4-AM [26] and Fluo-5N [31]) and buffers [26,32] in the cytoplasm and JSR lumen are listed in table 1.
Table 1.
Standard parameter values for dyes and buffers.
| dyes or buffers | [F]T or [Bn]T (μM) | kF+ or kn+ (μM−1 s−1) | kF− or kn− (s−1) |
|---|---|---|---|
| parameters in cytoplasm | |||
| Rhod-2 | 5 | 130 | 69 |
| Fluo-4-AM | 50 | 80 | 90 |
| calmodulin | 24 | 100 | 38 |
| troponin | 70 | 39 | 20 |
| SR | 47 | 115 | 100 |
| SL | 1124 | 115 | 1000 |
| parameters in JSR lumen | |||
| Fluo-5N | 20 | 48.8 | 19 520 |
| calsequestrin | 14 000 | 100 | 60 000 |
2.4. Firing probability of rogue and clustered RyRs
The firing probability per unit time of RyRs is determined by Ca2+ concentrations in both cytoplasm and JSR lumen [33–35], which can be expressed as
| 2.14 |
where Pcyto refers to the firing probability per unit time of calcium release events controlled by . represents a [Ca2+]lumen-dependent regulation term of Ca2+ release events. According to the coupled RyR gating model [5], Pcyto can be expressed as
| 2.15 |
where is the firing probability per unit time of a single RyR channel [36]. Here, is written as
| 2.16 |
where ϕ is an empirical power function given in Walker et al.'s model [14], m is the regulation coefficient for rogue (m = 1) or clustered (m = 10) RyRs.
2.5. Numerical solutions
Equations (2.1–2.16) were solved using a FORTRAN-developed program. A 2D computational domain (5 µm × 5 µm) was meshed with a size of 0.025 µm to simulate Ca2+ release events from a single Ca2+ release site. Moreover, a computational domain of 20 µm × 20 µm was meshed with a size of 0.1 µm to simulate Ca2+ release events from multiple Ca2+ release positions. For the fractional differential term in equation (2.1), the shifted Grünwald formula of centre difference [37] was used to discretize the computational domain as
| 2.17 |
and
| 2.18 |
where , α = β − 1 = 1.25, k is an integer with α < k < α + 1, and h is the mesh size. Free Ca2+ concentrations in the cytoplasm and JSR were calculated simultaneously. The variable time-step algorithm was used. The zero-flux boundary condition was taken in the Monte Carlo simulations.
3. Results and discussion
3.1. Ca2+ quarks and Ca2+ sparks
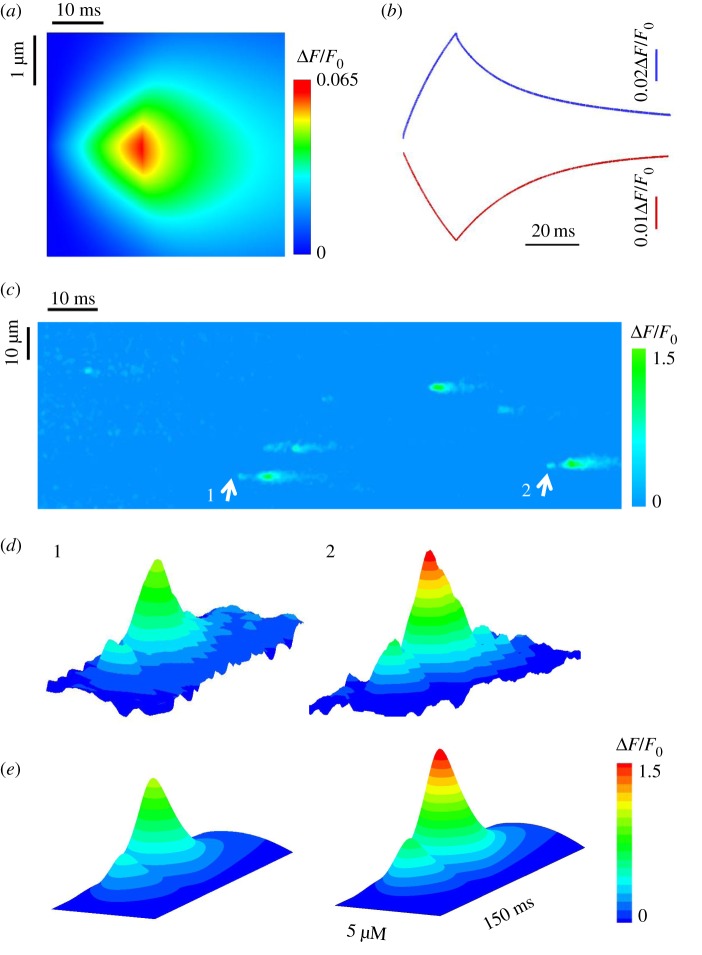
Figure 2a shows a computational Ca2+ quark through a rogue RyR to mimic the line-scan measurements when the release time is set to 20 ms. The computational domain is a square of 5 × 5 µm2 with the distribution of clustered and rogue RyRs on the JSR membrane in figure 1c. The dyes, Rhod-2 and Fluo-5N, were used to indicate Ca2+ in the cytoplasm and JSR lumen, respectively. The shape of the Ca2+ quark is consistent with that in a previous study [10]. Figure 2b plots the time courses of a QCR–QCD pair (i.e. a quarky Ca2+ release–quarky Ca2+ depletion pair) corresponding to figure 2a. The values of t67 and ΔF/F0 were computed to be 22.0 and 22.5 ms and 0.065 and 0.025 for QCR and QCD, respectively. They are within 1 s.d. of experimental measurements, i.e. t67 = 20.1 ± 1.1 ms for a QCR and 20.8 ± 1.9 ms for a QCD and ΔF/F0 = 0.069 ± 0.006 for a QCR and 0.025 ± 0.002 for a QCD [10].
Figure 2.
Properties of Ca2+ quarks and Ca2+ sparks. (a) A computational line-scan Ca2+ quark through a rogue RyR (5 µm × 50 ms). (b) The corresponding time courses of a QCR–QCD pair. (c) A representative line-scan image (50 µm × 1 s) of Ca2+ release events measured in a cardiac myocyte. Arrows point to Ca2+ sparks activated by QCRs. (d) Experimental results for line-scan images of sparks activated by QCRs. (e) Computational results in agreement with (d).
Figure 2c shows the line-scan measurements of Ca2+ release events in an isolated myocyte. The arrows refer to Ca2+ sparks due to the firing of clustered RyRs after QCR events owing to the opening of rogue RyRs, which were further analysed using the SparkMaster software [23] in figure 2d. The peak ΔF/F0 of the two Ca2+ spark is 1.02 and 1.44 in figure 2d (1) and (2), respectively. To avoid the background noise, we did not measure QCR events with ΔF/F0 < 0.2. The number of recorded Ca2+ sparks is 1125 in all measurements. The proportion of sparks that are triggered by QCRs is approximately 11.6%. Accordingly, figure 2e shows the computational results of Ca2+ sparks in a JSR with random distribution of clustered and rogue RyRs in figure 1c. The regular Ca2+ spark (left) due to an opening CRU of clustered RyRs is initiated by three opening rogue RyRs. The large spark (right) results from two CRUs of clustered RyRs activated by four opening rogue RyRs. An agreement between experimental and computational results (figure 2d versus figure 2e) validates the 2D mathematical model.
3.2. Interplay of rogue and clustered RyRs in a junctional sarcoplasmic reticulum
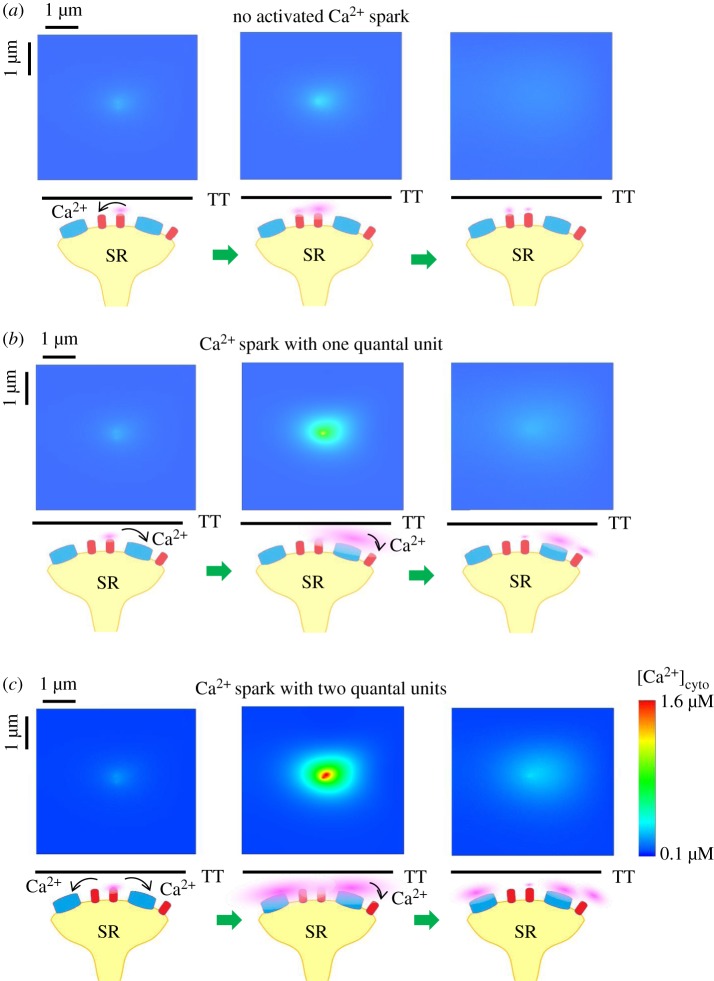
We simulated three modes of elemental Ca2+ release events that could coexist at a Ca2+ release site, as shown in figure 3a–c. Snapshots of elemental Ca2+ release events in a computational domain of 5 × 5 µm2 are taken at 10, 20 and 40 ms when three rogue RyRs are fired at the same time. Given the polymorphism of Ca2+ sparks at a release site, there are three distinct modes: no activated Ca2+ spark, a Ca2+ spark with one quantal unit (i.e. a fired Ca2+ spark from a CRU of clustered RyRs), and a Ca2+ spark with two quantal units (i.e. a fired Ca2+ spark from two CRUs of clustered RyRs). It demonstrates that QCRs from the opening rogue RyRs could activate the neighbour CRUs of clustered RyRs in a JSR to form a Ca2+ spark with different quantal units. Moreover, rogue RyRs could be activated by the Ca2+ release of clustered RyRs in the same JSR, which was recorded in the snapshots and shown in figure 3b,c. On the other hand, the amplitude of a Ca2+ spark is mainly determined by the firing number of clustered RyRs regardless of rogue RyRs because QCR events have a low Ca2+ flux.
Figure 3.
Interplay of rogue and clustered RyRs in a JSR. Snapshots of Ca2+ release events in a region of 5 µm × 5 µm are taken at 10, 20 and 40 ms from left to right when three rogue RyRs are fired at the same time. There are three distinct modes. Schematic interplay of Ca2+ release events is plotted below the snapshots. Clustered and rogue RyRs are distinguished by blue and red colours similar to figure 1c. Cytoplasmic Ca2+ is displayed by pink colour. Arrows denote that Ca2+ diffuses and activates neighbour clustered and rogue RyRs in the cytoplasm. SR, sarcoplasmic reticulum; TT, T-tubule. (a) No activated Ca2+ spark. Neighbour rogue RyRs are activated by Ca2+ quarks. (b) A Ca2+ spark with one quantal unit. One CRU of clustered RyRs is initiated by Ca2+ quarks. Then Ca2+ spark from the CRU of clustered RyRs contributes to activation of neighbour rogue RyRs. (c) A Ca2+ spark with two quantal units. Two CRUs of clustered RyRs are triggered and then activate neighbour rogue RyRs.
This model explains the coexistence of the three modes of elemental Ca2+ release in a Ca2+ release site as well as predicting the properties of a Ca2+ spark. QCRs do not always activate clustered RyRs because luminal Ca2+ depletion reduces the probability of activating clustered RyRs. The probability of Ca2+ sparks of the three modes activated by different initial opening numbers of rogue RyRs is shown in figure 4. The results reveal that clustered RyRs have the highest frequency of being triggered by four opening rogue RyRs simultaneously.
Figure 4.
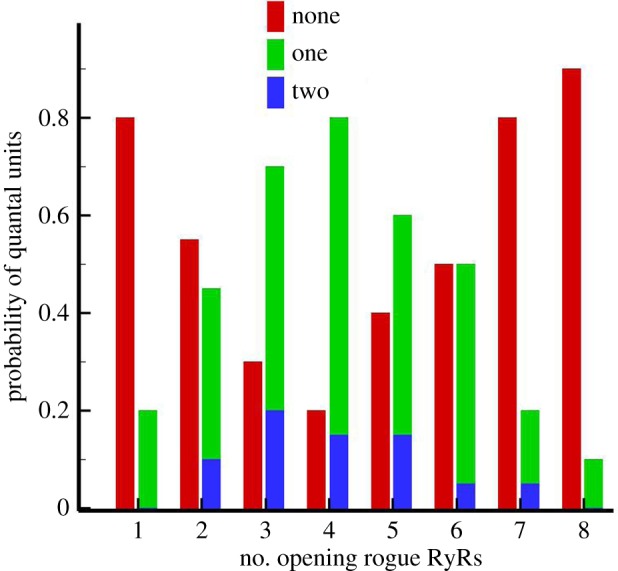
The probability of activated quantal units in a JSR calculated by Monte Carlo simulations (n = 20).
3.3. The effects of [Ca2+]lumen on Ca2+ release events
The effects of [Ca2+]lumen on the firing frequency of Ca2+ sparks and quarks are quantified in a computational domain of 20 × 20 µm2, as shown in figure 5. The beginning levels of [Ca2+]lumen is set from 0.2 to 1.0 mM. The computational results show a higher firing frequency of spontaneous QCR events than that of spontaneous Ca2+ sparks consistent with previous experimental observations [10]. A computational study also showed a steep increase in the firing frequency of spontaneous Ca2+ sparks despite a slight change in the firing frequency of spontaneous QCR events with the increase of [Ca2+]lumen [18]. Moreover, we show a threshold value of [Ca2+]lumen (i.e. less than 0.3 mM) where spontaneous Ca2+ quarks become a major pathway of SR Ca2+ leak. The present study shows the incidence of 12.2 ± 1.1 Ca2+ sparks [100 µm]−1 s−1 under physiological conditions ([Ca2+]lumen = 1.0 mM), which agrees with experimental measurements [38]. The statistical proportion of sparks that are triggered by QCRs is 34.7% because one or two openings of rogue RyRs were neglected in experimental measurements in figure 2c.
Figure 5.
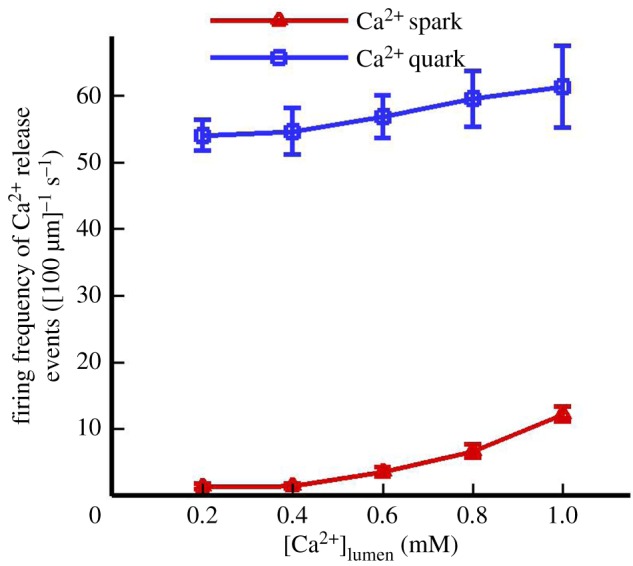
The firing frequency of Ca2+ sparks (red line) and quarks (blue line) determined by Monte Carlo simulations (n = 10) when [Ca2+]lumen varies from 0.2 mM to 1.0 mM.
3.4. Effects of rogue RyRs on Ca2+ sparks with consideration of [Ca2+]lumen
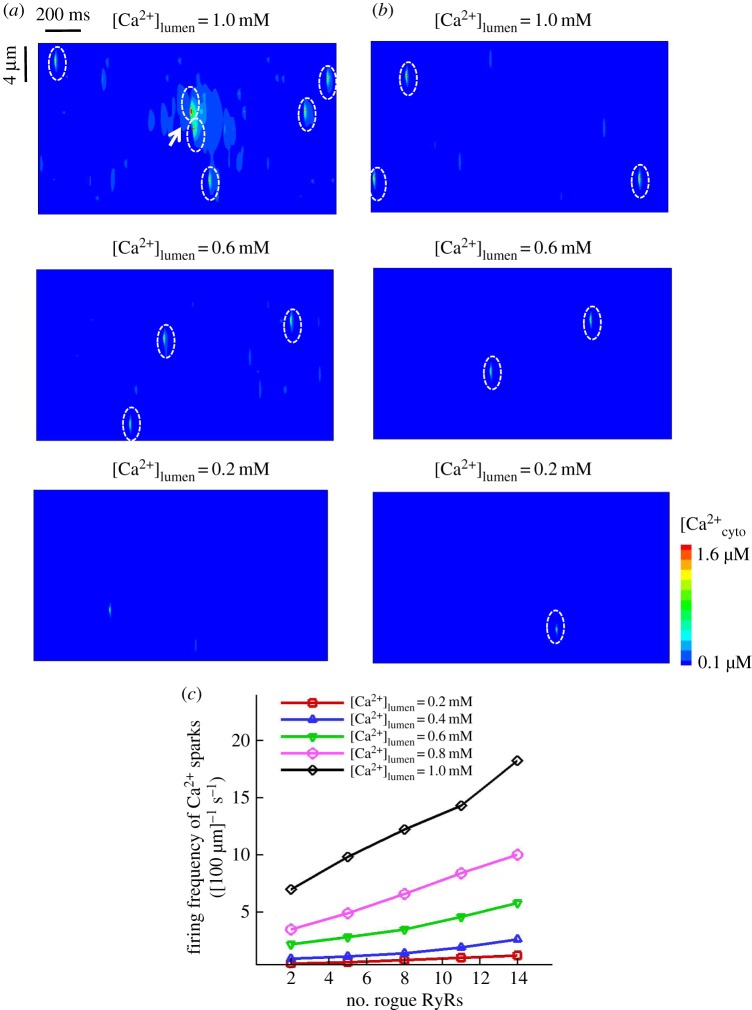
We examined how rogue RyRs affect Ca2+ sparks at different levels of [Ca2+]lumen. A comparison of computational line-scan Ca2+ release events with consideration of rogue RyRs or not is displayed in a square of 20 × 20 µm2 (the intervals between JSRs are lx = 2 µm and ly = 0.8 µm) for 2 s (figure 6a versus figure 6b) at different [Ca2+]lumen. The Ca2+ spark frequency has values of 1.3 ± 0.4 and 1.2 ± 0.3 [100 µm]−1 s−1 with consideration of rogue RyRs or not when [Ca2+]lumen = 0.2 mM. Therefore, the stochastic opening of rogue RyRs at low [Ca2+]lumen fails to trigger spontaneous Ca2+ sparks owing to the decreased driving force ([Ca2+]lumen − [Ca2+]cyto) and sensitivity of clustered RyRs as well as the shortened firing possibility of neighbouring RyRs. Conversely, the frequency of spontaneous Ca2+ sparks increases with consideration of rogue RyRs at 1.0 mM [Ca2+]lumen. QCR events are hence responsible for the formation of Ca2+ sparks at high [Ca2+]lumen. Moreover, sensitivity analysis on the firing frequency of Ca2+ sparks was performed with respect to the number of rogue RyRs varying in the range of 2–14 in figure 6c. The opening of clustered RyRs monotonically increases with the increase of the number of rogue RyRs at high [Ca2+]lumen. But it does not change obviously at low [Ca2+]lumen. The firing frequency of Ca2+ sparks has a bigger slope at higher [Ca2+]lumen.
Figure 6.
Effects of rogue RyRs on Ca2+ sparks as [Ca2+]lumen varies. (a) Computational line-scan Ca2+ release events (20 µm × 2 s) with effects of rogue RyRs when [Ca2+]lumen = 1.0 mM, 0.6 mM and 0.2 mM. Ca2+ sparks are marked by white ovals. (b) Computational line-scan Ca2+ release events without effects of rogue RyRs under the same conditions as (a). (c) Sensitivity analysis on the firing frequency of Ca2+ sparks as a function of the number of rogue RyRs in a JSR at various [Ca2+]lumen determined by Monte Carlo simulations (n = 10).
3.5. A comparison with previous models
Sato et al. [18] showed that a RyR channel in a cluster of RyRs could trigger adjacent RyR channels in the same cluster to form a Ca2+ spark when [Ca2+]lumen is above a threshold. Walker et al. [14,15] further investigated the structural effects of clustered RyRs on Ca2+ sparks. Moreover, Lu et al. [16,17] indicated that non-junctional RyRs increased the probability of occurrence of spontaneous Ca2+ waves. The present study showed the temporal and spatial properties of Ca2+ quarks and sparks relevant to both rogue and clustered RyRs, where rogue RyRs randomly surround clustered RyRs within a single junctional space. We showed that Ca2+ quarks and sparks coexist at a Ca2+ release site, which agrees with experimental measurements from line-scan imaging. The opening of rogue RyRs leads to the formation of Ca2+ sparks at high [Ca2+]lumen, but not at low [Ca2+]lumen. This supports the conclusion of Sato et al. [18].
On the other hand, the present model simulated Ca2+ quarks and sparks based on the anomalous subdiffusion in comparison with previous models from Fickian diffusion [14–18]. Hence, we solved the paradox of full width at half-maximum (FWHM) due to Fickian diffusion. This study addresses the importance of rogue RyRs for understanding Ca2+ release mechanisms from JSRs.
3.6. Potential implications
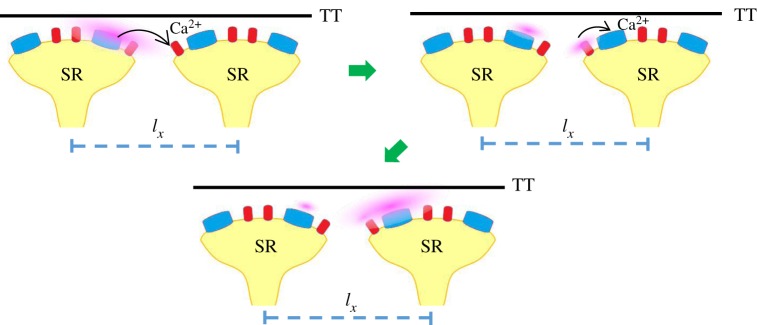
Ca2+ sparks could trigger clustered RyRs in neighbour JSRs with the help of rogue RyRs. This mode is marked by the arrow in figure 6a and shown in figure 7 schematically. Ca2+ quarks may trigger the opening of clustered RyRs in self-propagating succession along the length of a cell. The sum of Ca2+ sparks and quarks gives rise to the global Ca2+ transient for the formation of a Ca2+ wave. Furthermore, the changes in the number of rogue RyRs in a JSR may induce potential heart diseases. For example, a reduction of the number of rogue RyRs could lead to an inhibition of Ca2+ waves and dyssynchronous Ca2+ transients in myocytes of congestive heart failure [39]. Atrial fibrillation associated with overactive Ca2+ release could be related to the increased number of rogue RyRs [40].
Figure 7.
Schematic interplay of clustered and rogue RyRs in neighbour JSRs. Clustered RyRs are triggered by Ca2+ sparks in a neighbour JSR with the help of rogue RyRs.
3.7. Critique of the study
In the study, the duration and current of Ca2+ release events from JSRs were fixed similar to previous studies [10,27]. However, Ca2+ release flux should be regulated by the SR structure, functional properties and the size of RyR cluster [41]. The impact of time-dependent Ca2+ release flux from RyRs can give us new inspiration for the relation between Ca2+ release events and the interplay of rogue and clustered RyRs. The spatial arrangement of RyRs within clusters influences the frequency of Ca2+ sparks [14]. The detailed structure of clustered RyRs should be taken into consideration when a high-performance supercomputer is used to satisfy the requirement of large computation. Furthermore, the present study comes from the assumption that 3D geometry is simplified to a 2D model in healthy myocytes. Modelling 3D distribution of the JSRs in cardiac cells is more realistic and the 3D simulations of Izu et al. [42] indicated that it could reveal more complex RyR interactions between neighbour JSRs. Hence, a 3D model should be developed to investigate spontaneous Ca2+ release events under both physiological and pathological conditions in future studies.
4. Conclusion
A mathematical model is developed to investigate Ca2+ sparks and quarks in the cytoplasm and show the significance of rogue RyRs. The Ca2+ release events from JSRs agree with experimental measurements in cardiac myocytes. The computational results show a steep increase in the firing frequency of spontaneous Ca2+ sparks despite a slight change in the firing frequency of spontaneous Ca2+ sparks with the increase of [Ca2+]lumen. The frequency of spontaneous Ca2+ sparks is remarkably affected by the rogue RyRs opening at high [Ca2+]lumen, but not at low [Ca2+]lumen. This study is of importance to understand basic mechanisms of Ca2+ release events in cardiac myocytes.
Acknowledgements
We would like to thank Fujian Lu for experimental assistance, Xi Chen for valuable discussions about simulation and Christian P. Rivera for revision of the manuscript.
Ethics
All animal experiments were performed in accordance with Chinese National and Peking University ethical guidelines regarding the use of animals in research, consistent with the NIH guidelines (Guide for the care and use of laboratory animals) on the protection of animals used for scientific purposes. The experimental protocols were approved by the Animal Care and Use Committee of Peking University, China.
Data accessibility
Statistical data of Ca2+ release events used in this paper can be accessed at: http://dx.doi.org/10.6084/m9.figshare.5450719.
Authors' contributions
X.C., Y.H. and W.T. designed and performed the numerical calculation. Y.F. analysed data. X.C., Y.H. and W.T. wrote the manuscript. All authors gave final approval for publication.
Competing interests
We declare we have no competing interests.
Funding
This work was supported by the National Natural Science Foundation of China (11732001 and 11328201) and the Leading Talents of Guangdong Province Program.
References
- 1.Cheng H, Lederer WJ, Cannell MB. 1993. Calcium sparks—elementary events underlying excitation-contraction coupling in heart muscle. Science 262, 740–744. (doi:10.1126/science.8235594) [DOI] [PubMed] [Google Scholar]
- 2.Cannell MB, Cheng H, Lederer WJ. 1995. The control of calcium release in heart muscle. Science 268, 1045–1049. (doi:10.1126/science.7754384) [DOI] [PubMed] [Google Scholar]
- 3.Bers DR, Perez-Reyes E. 1999. Ca channels in cardiac myocytes: structure and function in Ca influx and intracellular Ca release. Cardiovasc. Res. 42, 339–360. (doi:10.1016/s0008-6363(99)00038-3) [DOI] [PubMed] [Google Scholar]
- 4.Franzini-Armstrong C, Protasi F, Ramesh V. 1999. Shape, size, and distribution of Ca2+ release units and couplons in skeletal and cardiac muscles. Biophys. J. 77, 1528–1539. (doi:10.1016/s0006-3495(99)77000-1) [DOI] [PMC free article] [PubMed] [Google Scholar]
- 5.Baddeley D, Jayasinghe ID, Lam L, Rossberger S, Cannell MB, Soeller C. 2009. Optical single-channel resolution imaging of the ryanodine receptor distribution in rat cardiac myocytes. Proc. Natl Acad. Sci. USA 106, 22 275–22 280. (doi:10.1073/pnas.0908971106) [DOI] [PMC free article] [PubMed] [Google Scholar]
- 6.Wang SQ, Stern MD, Rios E, Cheng HP. 2004. The quantal nature of Ca2+ sparks and in situ operation of the ryanodine receptor array in cardiac cells. Proc. Natl Acad. Sci. USA 101, 3979–3984. (doi:10.1073/pnas.0306157101) [DOI] [PMC free article] [PubMed] [Google Scholar]
- 7.Wang SQ, Song LS, Lakatta EG, Cheng HP. 2001. Ca2+ signalling between single L-type Ca2+ channels and ryanodine receptors in heart cells. Nature 410, 592–596. (doi:10.1038/35069083) [DOI] [PubMed] [Google Scholar]
- 8.Cheng HP, Wang SQ. 2002. Calcium signaling between sarcolemmal calcium channels and ryanodine receptors in heart cells. Front. Biosci. 7, D1867–D1878. (doi:10.2741/cheng) [DOI] [PubMed] [Google Scholar]
- 9.Shang W, et al. 2014. Imaging Ca2+ nanosparks in heart with a new targeted biosensor. Circ. Res. 114, 412–420. (doi:10.1161/circresaha.114.302938) [DOI] [PubMed] [Google Scholar]
- 10.Brochet DXP, Xie WJ, Yang DM, Cheng HP, Lederer WJ. 2011. Quarky calcium release in the heart. Circ. Res. 108, 210–218. (doi:10.1161/circresaha.110.231258) [DOI] [PMC free article] [PubMed] [Google Scholar]
- 11.Zima AV, Bovo E, Bers DM, Blatter LA. 2010. Ca2+ spark-dependent and -independent sarcoplasmic reticulum Ca2+ leak in normal and failing rabbit ventricular myocytes. J. Physiol. Lond. 588, 4743–4757. (doi:10.1113/jphysiol.2010.197913) [DOI] [PMC free article] [PubMed] [Google Scholar]
- 12.Sobie EA, Guatimosim S, Gomez-Viquez L, Song LS, Hartmann H, Jafri MS, Lederer WJ. 2006. The Ca2+ leak paradox and ‘rogue ryanodine receptors’: SR Ca2+ efflux theory and practice. Prog. Biophys. Mol. Biol. 90, 172–185. (doi:10.1016/j.pbiomolbio.2005.06.010) [DOI] [PMC free article] [PubMed] [Google Scholar]
- 13.Williams GSB, Chikando AC, Tuan HTM, Sobie EA, Lederer WJ, Jafri MS. 2011. Dynamics of calcium sparks and calcium leak in the heart. Biophys. J. 101, 1287–1296. (doi:10.1016/j.bpj.2011.07.021) [DOI] [PMC free article] [PubMed] [Google Scholar]
- 14.Walker MA, Williams GSB, Kohl T, Lehnart SE, Jafri MS, Greenstein JL, Lederer WJ, Winslow RL. 2014. Superresolution modeling of calcium release in the heart. Biophys. J. 107, 3009–3020. (doi:10.1016/j.bpj.2014.11.003) [DOI] [PMC free article] [PubMed] [Google Scholar]
- 15.Walker MA, Kohl T, Lehnart SE, Greenstein JL, Lederer WJ, Winslow RL. 2015. On the adjacency matrix of RyR2 cluster structures. PLoS Comput. Biol. 11, 21 (doi:10.1371/journal.pcbi.1004521) [DOI] [PMC free article] [PubMed] [Google Scholar]
- 16.Lu LY, Xia L, Ye XS, Cheng HP. 2010. Simulation of the effect of rogue ryanodine receptors on a calcium wave in ventricular myocytes with heart failure. Phys. Biol. 7, 11 (doi:10.1088/1478-3975/7/2/026005) [DOI] [PubMed] [Google Scholar]
- 17.Lu LY, Xia L, Zhu XW. 2012. Simulation of arrhythmogenic effect of rogue RyRs in failing heart by using a coupled model. Comput. Math. Methods Med. 10, 183978 (doi:10.1155/2012/183978) [DOI] [PMC free article] [PubMed] [Google Scholar]
- 18.Sato D, Bers DM. 2011. How does stochastic ryanodine receptor-mediated Ca leak fail to initiate a Ca spark? Biophys. J. 101, 2370–2379. (doi:10.1016/j.bpj.2011.10.017) [DOI] [PMC free article] [PubMed] [Google Scholar]
- 19.Tan WC, Fu CQ, Fu CJ, Xie WJ, Cheng HP. 2007. An anomalous subdiffusion model for calcium spark in cardiac myocytes. Appl. Phys. Lett. 91, 3 (doi:10.1063/1.2805208) [Google Scholar]
- 20.Chen X, Guo L, Kang JH, Huo YL, Wang SQ, Tan WC. 2014. Calcium waves initiating from the anomalous subdiffusive calcium sparks. J. R. Soc. Interface 11, 10 (doi:10.1098/rsif.2013.0934) [DOI] [PMC free article] [PubMed] [Google Scholar]
- 21.Cannell MB, Cheng H, Lederer WJ. 1994. Spatial nonuniformities in [Ca2+]i during excitation-contraction coupling in cardiac myocytes. Biophys. J. 67, 1942–1956. (doi:10.1016/S0006-3495(94)80677-0) [DOI] [PMC free article] [PubMed] [Google Scholar]
- 22.Xu M, et al. 2007. Intermolecular failure of L-type Ca2+ channel and ryanodine receptor signaling in hypertrophy. PLoS Biol. 5, 203–211. (doi:10.1371/journal.pbio.0050021) [DOI] [PMC free article] [PubMed] [Google Scholar]
- 23.Picht E, Zima AV, Blatter LA, Bers DM. 2007. SparkMaster: automated calcium spark analysis with ImageJ. Am. J. Physiol. Cell Physiol. 293, C1073–C1081. (doi:10.1152/ajpcell.00586.2006) [DOI] [PubMed] [Google Scholar]
- 24.Izu LT, Wier WG, Balke CW. 2001. Evolution of cardiac calcium waves from stochastic calcium sparks. Biophys. J. 80, 103–120. (doi:10.1016/S0006-3495(01)75998-X) [DOI] [PMC free article] [PubMed] [Google Scholar]
- 25.Metzler R, Klafter J. 2000. The random walk's guide to anomalous diffusion: a fractional dynamics approach. Phys. Rep. Rev. Sect. Phys. Lett. 339, 1–77. (doi:10.1016/s0370-1573(00)00070-3) [Google Scholar]
- 26.Chen X, Kang JH, Fu CJ, Tan WC. 2013. Modeling calcium wave based on anomalous subdiffusion of calcium sparks in cardiac myocytes. PLoS ONE 8, 9 (doi:10.1371/journal.pone.0057093) [DOI] [PMC free article] [PubMed] [Google Scholar]
- 27.Smith GD, Keizer JE, Stern MD, Lederer WJ, Cheng HP. 1998. A simple numerical model of calcium spark formation and detection in cardiac myocytes. Biophys. J. 75, 15–32. (doi:10.1016/S0006-3495(98)77491-0) [DOI] [PMC free article] [PubMed] [Google Scholar]
- 28.Li JH, Xie WJ, Chen X, Huo YL, Cheng HP, Tan WC. 2017. A novel stochastic reaction-diffusion model of Ca2+ blink in cardiac myocytes. Sci. Bull. 62, 5–8. (doi:10.1016/j.scib.2016.12.001) [DOI] [PubMed] [Google Scholar]
- 29.Sobie EA, Dilly KW, Cruz JD, Lederer WJ, Jafri MS. 2002. Termination of cardiac Ca2+ sparks: an investigative mathematical model of calcium-induced calcium release. Biophys. J. 83, 59–78. (doi:10.1016/S0006-3495(02)75149-7) [DOI] [PMC free article] [PubMed] [Google Scholar]
- 30.Marengo FD, Monck JR. 2000. Development and dissipation of Ca2+ gradients in adrenal chromaffin cells. Biophys. J. 79, 1800–1820. (doi:10.1016/S0006-3495(00)76431-9) [DOI] [PMC free article] [PubMed] [Google Scholar]
- 31.Cannell MB, Kong CHT, Imtiaz MS, Laver DR. 2013. Control of sarcoplasmic reticulum Ca2+ release by stochastic RyR gating within a 3D model of the cardiac dyad and importance of induction decay for CICR termination. Biophys. J. 104, 2149–2159. (doi:10.1016/j.bpj.2013.03.058) [DOI] [PMC free article] [PubMed] [Google Scholar]
- 32.Kong CHT, Laver DR, Cannell MB. 2013. Extraction of sub-microscopic Ca fluxes from blurred and noisy fluorescent indicator images with a detailed model fitting approach. PLoS Comput. Biol. 9, 10 (doi:10.1371/journal.pcbi.1002931) [DOI] [PMC free article] [PubMed] [Google Scholar]
- 33.Qin J, Valle G, Nani A, Chen H, Ramos-Franco J, Nori A, Volpe P, Fill M. 2009. Ryanodine receptor luminal Ca2+ regulation: swapping calsequestrin and channel isoforms. Biophys. J. 97, 1961–1970. (doi:10.1016/j.bpj.2009.07.030) [DOI] [PMC free article] [PubMed] [Google Scholar]
- 34.Qin J, Valle G, Nani A, Nori A, Rizzi N, Priori SG, Volpe P, Fill M. 2008. Luminal Ca2+ regulation of single cardiac ryanodine receptors: Insights provided by calsequestrin and its mutants. J. Gen. Physiol. 131, 325–334. (doi:10.1085/jgp.200709907) [DOI] [PMC free article] [PubMed] [Google Scholar]
- 35.Gyorke I, Gyorke S. 1998. Regulation of the cardiac ryanodine receptor channel by luminal Ca2+ involves luminal Ca2+ sensing sites. Biophys. J. 75, 2801–2810. [DOI] [PMC free article] [PubMed] [Google Scholar]
- 36.Zahradnikova A, Valent I, Zahradnik I. 2010. Frequency and release flux of calcium sparks in rat cardiac myocytes: a relation to RYR gating. J. Gen. Physiol. 136, 101–116. (doi:10.1085/jgp.200910380) [DOI] [PMC free article] [PubMed] [Google Scholar]
- 37.Tadjeran C, Meerschaert MM. 2007. A second-order accurate numerical method for the two-dimensional fractional diffusion equation. J. Comput. Phys. 220, 813–823. (doi:10.1016/j.jcp.2006.05.030) [Google Scholar]
- 38.Lukyanenko V, Gyorke S. 1999. Ca2+ sparks and Ca2+ waves in saponin-permeabilized rat ventricular myocytes. J. Physiol. Lond. 521, 575–585. (doi:10.1111/j.1469-7793.1999.00575.x) [DOI] [PMC free article] [PubMed] [Google Scholar]
- 39.Louch WE, Hake J, Mork HK, Hougen K, Skrbic B, Ursu D, Tonnessen T, Sjaastad I, Sejersted OM. 2013. Slow Ca2+ sparks de-synchronize Ca2+ release in failing cardiomyocytes: evidence for altered configuration of Ca2+ release units? J. Mol. Cell. Cardiol. 58, 41–52. (doi:10.1016/j.yjmcc.2013.01.014) [DOI] [PubMed] [Google Scholar]
- 40.Macquaide N, et al. 2015. Ryanodine receptor cluster fragmentation and redistribution in persistent atrial fibrillation enhance calcium release. Cardiovasc. Res. 108, 387–398. (doi:10.1093/cvr/cvv231) [DOI] [PMC free article] [PubMed] [Google Scholar]
- 41.Sato D, Shannon TR, Bers DM. 2016. Sarcoplasmic reticulum structure and functional properties that promote long-lasting calcium sparks. Biophys. J. 110, 382–390. (doi:10.1016/j.bpj.2015.12.009) [DOI] [PMC free article] [PubMed] [Google Scholar]
- 42.Izu LT, Means SA, Shadid JN, Chen-Izu Y, Balke CW. 2006. Interplay of ryanodine receptor distribution and calcium dynamics. Biophys. J. 91, 95–112. (doi:10.1529/biophysj.105.077214) [DOI] [PMC free article] [PubMed] [Google Scholar]
Associated Data
This section collects any data citations, data availability statements, or supplementary materials included in this article.
Data Availability Statement
Statistical data of Ca2+ release events used in this paper can be accessed at: http://dx.doi.org/10.6084/m9.figshare.5450719.


