

Summary
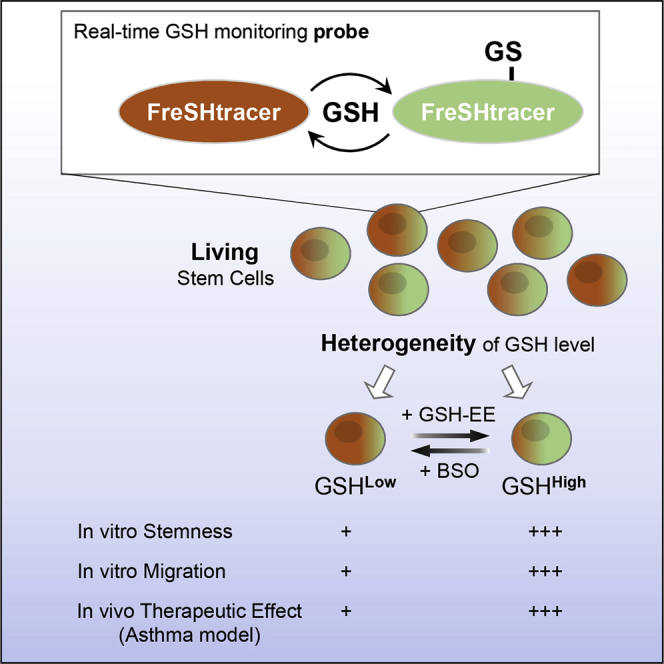
The core functions of stem cells (SCs) are critically regulated by their cellular redox status. Glutathione is the most abundant non-protein thiol functioning as an antioxidant and a redox regulator. However, an investigation into the relationship between glutathione-mediated redox capacity and SC activities is hindered by lack of probe. Here, we demonstrate that cyanoacrylamide-based coumarin derivatives are ratiometric probes suitable for the real-time monitoring of glutathione levels in living SCs. These probes revealed that glutathione levels are heterogeneous among subcellular organelles and among individual cells and show dynamic changes and heterogeneity in repopulating SCs depending on oxidative stress or culture conditions. Importantly, a subpopulation of SCs with high glutathione levels exhibited increased stemness and migration activities in vitro and showed improved therapeutic efficiency in treating asthma. Our results indicate that high glutathione levels are required for maintaining SC functions, and monitoring glutathione dynamics and heterogeneity can advance our understanding of the cellular responses to oxidative stress.
Keywords: glutathione, fluorescent probe, real-time monitoring, stem cell, oxidative stress, heterogeneity, pluripotency, self-renewal, migration, asthma
Graphical Abstract
Highlights
-
•
FreSHtracer is a reversible probe for a fast and ratiometric reaction with GSH
-
•
FreSHtracer and its derivatives enable real-time monitoring of intracellular GSH
-
•
FreSHtracer reports dynamic changes and heterogeneity of GSH level in stem cells
-
•
High GSH levels are required for maintaining functional potency of stem cells
By developing and characterizing new fluorescent probes enabling fast, reversible, and ratiometric reaction with glutathione, Jeong et al. reveal considerable dynamics and heterogeneity in glutathione levels in living stem cells in response to environmental stress and also show that high glutathione levels are required for maintaining stemness of murine embryonic stem cells or therapeutic potency of mesenchymal stem cells.
Introduction
Reactive oxygen species (ROS) are important signaling molecules that regulate cellular metabolism, proliferation, and survival (Winterbourn and Hampton, 2008). An increase of ROS induces the thiol oxidation of cysteine residues on signaling proteins, resulting in alterations of protein activities to regulate cellular functions. In particular, ROS-mediated oxidation plays an important role in regulating a variety of signaling proteins in stem cells (SCs) that influence self-renewal capacity, pluripotency, viability, and genomic stability, including OCT4, NRF2, FoxOs, APE1/Ref-1, ATM, HIF-1, p38, and p53 (Wang et al., 2013). For example, OCT4, a pluripotency-related transcription factor, is inactivated via cysteine oxidation under glutamine-depleted conditions, favoring the differentiation and functional maturation of embryonic SCs (ESCs) (Marsboom et al., 2016). Disruption of Nrf2, a master regulator of redox homeostasis, impinges upon the functions of embryonic and adult SCs such as the self-renewal and pluripotency in ESCs (Jang et al., 2014), the migration and retention of hematopoietic SCs in the bone marrow niche (Tsai et al., 2013), and the proliferation and homeostasis in intestinal (Hochmuth et al., 2011) and airway basal SCs (Paul et al., 2014). Thus, the cellular redox regulation is critical for maintaining stemness and functional potency of ESCs and adult SCs.
Cellular redox homeostasis depends on the balance between ROS production and their elimination via enzymes and antioxidant molecules such as glutathione (GSH), a thiol-containing tripeptide that plays a major role in maintaining redox homeostasis owing to its high concentration (approximately 1–10 mM). GSH is synthesized in the cytosol and is then transported to cellular compartments such as the mitochondria, nucleus, and ER, where redox buffering is required for organelle-specific functions. GSH eliminates hydrogen peroxide (H2O2) through a glutathione peroxidase-catalyzed reaction, producing water and oxidized GSH (GSSG), which is regenerated to GSH by glutathione reductase at the expense of NADPH (Lu, 2013). Therefore, changes in the GSH levels in response to oxidative stress can reflect the redox buffering capacity of a particular cell type or cellular compartment. Moreover, GSH also acts as a regulator for ROS-triggered signal transmission. GSH reduces ROS-induced disulfides in signaling proteins, either by glutaredoxin or by forming S-glutathionylated proteins through a thiol-disulfide exchange reaction, thereby modulating the intensity and duration of redox signaling (Winterbourn and Hampton, 2008). Furthermore, ESCs and inducible pluripotent SCs harbor particularly high GSH levels, which confer protection against unfavorable DNA damage (Dannenmann et al., 2015). Thus, monitoring the dynamic changes of GSH levels in living SCs is required to evaluate the redox buffering capacity and signaling processes that modulate SC functions during several physiological and pathological processes. However, obtaining a detailed understanding of the GSH-based redox system has thus far been limited owing to the lack of direct and reliable tools.
Various techniques have been used to estimate GSH levels in living cells to date, including redox-sensitive fluorescent proteins such as rxYFP and roGFP (Gutscher et al., 2008). Since the thiol-disulfide status of these fluorescent proteins is in equilibrium with that of cellular GSH, this method can provide information on the GSH/GSSG redox potential but cannot directly monitor the changes in GSH levels. In addition, the poor efficiency of transfection and consequent cellular damage hinder the application of this genetic method for a wide range of cell types. Several thiol-reactive fluorescent chemical dyes have also been developed as GSH sensors to overcome these problems (Yin et al., 2013). However, these dyes still have drawbacks such as irreversibility, slow kinetics (Kim et al., 2011), low fluorescence quantum yields (Chen et al., 2015), or limited subcellular localization (Umezawa et al., 2017). Moreover, previous works on GSH monitoring have not paid enough attention to the possible errors caused by reactive thiols in cellular proteins.
To overcome the limitations of current GSH probes, we previously reported the synthesis of a coumarin derivative bearing a conjugated 2-cyanoacrylamide group, designated FreSHtracer (fluorescent real-time thiol tracer; Figure 1A), which reacts reversibly with thiols in aqueous solutions (Cho and Choi, 2012). The present study showed that FreSHtracer is a powerful tool for real-time monitoring of GSH dynamics and heterogeneity in living SCs, and revealed that SCs cultured under conventional conditions exhibit the downregulation of GSH levels that results in deterioration of self-renewal and migration function. Therefore, our results prove that monitoring glutathione contents and dynamics in living SCs can be used as a marker to evaluate SC function and enhance its therapeutic potency.
Figure 1.

FreSHtracer Is a Reversible and Ratiometric Probe for Glutathione
(A) Changes in the absorption and fluorescence spectra of FreSHtracer when reacted with increasing concentrations of glutathione (GSH).
(B) Fluorescence ratio (F510/F580; FR) of FreSHtracer plotted as a function of the GSH concentration.
(C) Reversible reaction of FreSHtracer with GSH following treatment with diamide.
(D and E) GSH-specific reaction of FreSHtracer. FreSHtracer equilibrated with GSH (5 mM; 15 min) was treated with H2O2 (0–2 mM) (D), and FreSHtracer equilibrated with oxidized GSH (GSSG, 5 mM) was treated with GSH reductase (5 U/mL) and 0.5 mM NADPH (E).
(F and G) Fluorescence properties of FreSHtracer in dialyzed cell lysates. The FR change was monitored in dialyzed HeLa cell lysates (F) and then plotted against the protein concentration (G).
(H) Effect of oxidants on the PSH-induced FR. Dialyzed cell lysates (25 mg/mL protein) were incubated with FreSHtracer (2 hr) and treated with diamide or H2O2 for 1 hr.
(I and J) Fluorescence properties of FreSHtracer in PSH-GSH mixtures. FreSHtracer was added to dialyzed cell lysates (25 mg/mL protein) spiked with various GSH concentrations. The FR change was monitored for 20 min (I). The final FR value was plotted against the GSH concentration (J).
(K) Effect of oxidants on the FR of the PSH-GSH mixture. PSH-GSH mixtures (25 mg/mL protein and 2 mM GSH) were incubated with FreSHtracer (2 hr) and treated with diamide or H2O2 for 1 hr.
See also Figure S1.
Results
FreSHtracer Is a Ratiometric Probe Suitable for Measuring and Monitoring GSH Levels
We first investigated whether FreSHtracer could be suitable for measuring and monitoring GSH levels even in the presence of abundant cellular protein thiols. In the reaction with GSH, FreSHtracer showed a spectral shift of the λmax of its ultraviolet-visible absorption from 520 nm to 430 nm, resulting in decreased fluorescence emission intensity at 580 nm (F580, λex 520 nm) and increased fluorescence intensity at 510 nm (F510, λex 430 nm; Figures 1A and S1A). The apparent dissociation constant (KD) value for GSH was estimated at 3.6 mM and was unaffected by pH changes ranging from 6.0 to 9.0 (Table S1 and Figure S1B). Notably, the F510/F580 ratio (FR) correlated with the GSH concentration (R2 = 0.9938; Figure 1B), indicating that FreSHtracer can ratiometrically report the GSH concentration. When GSH was added to FreSHtracer, the FR rapidly increased, reaching a plateau within 5 min (Figure 1C), and was then stoichiometrically decreased by treatment with the thiol-specific oxidants diamide and N-ethylmaleimide (NEM), as well as with H2O2 treatment in a dose-dependent manner (Figures 1C, 1D, and S1C–S1E), demonstrating a reversible reaction with GSH. Moreover, the FR was unchanged by treatment with GSSG and only increased when both glutathione reductase and NADPH were added to the mixture to reduce GSSG to GSH (Figure 1E), indicating the specific reaction of FreSHtracer with GSH.
We next characterized the reaction between FreSHtracer and accessible cysteine thiols in cellular proteins (PSH), which were estimated at a concentration of 1.95 ± 0.11 mM in 25 mg/mL protein of the HeLa cell lysates using Ellman's assay, comprising up to 70% of the total cellular thiols (Hansen et al., 2009). When added to diluted protein solutions, the FR slowly increased, reaching a plateau after 90 min (Figure 1F) in a protein concentration-dependent manner, but remained constant in concentrated protein solutions (Figure 1G). These results were confirmed by calculation of the rate constants, showing that the reaction with PSH was approximately 12-fold slower than that with GSH (Figure S1F). The FR of protein solutions decreased by treatment with diamide, but not with H2O2, indicating that PSH is oxidized by diamide but resistant to H2O2-induced oxidation (Figures 1H and S1G). When the changes in the FR of FreSHtracer were monitored in protein solutions spiked with various concentrations of GSH, the FR was found to increase rapidly within 5 min and then gradually increased further over a period of 1.5 hr (Figures 1I and S1H), showing the combined kinetics for GSH and PSH. Moreover, when plotted against the GSH concentration, the FR was shown to increase in a GSH-concentration-dependent manner (Figure 1J). Although the FR was affected by the cellular proteins added, this dependency on the protein concentration became less significant at higher concentration ranges (Figure S1I). Therefore, the FR is expected to be mainly dependent on the GSH concentration and not significantly affected by typical protein concentration variations (50–200 mg/mL) in intact cells (Finka and Goloubinoff, 2013). Considering that the PSH-induced FR remained constant, these results imply that the total FR could be divided into GSH- and PSH-dependent FR values (FRGSH and FRPSH, respectively). Consistently, treatment with H2O2 diminished only the FRGSH with no effect on the FRPSH, whereas treatment with diamide resulted in a dose-dependent decrease in both FRPSH and FRGSH (Figures 1K and S1G). Thus, these results demonstrate that FreSHtracer is capable of monitoring the ROS-induced GSH changes in a cell homogenate.
GSH Levels Are Heterogeneous in the Subcellular Organelles of Living Cells
Next, to utilize FreSHtracer for GSH monitoring in living cells, we evaluated its cytotoxicity. Treatment of up to 10 μM FreSHtracer for 24 hr showed no effect on the viability of HeLa cells and human mesenchymal SCs derived from bone marrow (hBM-MSCs) and ESCs (hES-MSCs) (Hong et al., 2015) (Figure S2). HeLa cells were equilibrated with treatment of 5 μM FreSHtracer for 2 hr. Confocal and ratiometric pseudo-color images revealed that FreSHtracer was distributed inside the cells, exhibiting a wide range of FR values (Figure 2A). The FR in the nucleus was about 1.5- to 2-fold higher than that of the cytoplasm. The FR of the nucleolus revealed relatively lower GSH levels, and the FR of the peripheral cytoplasm was higher than that of other regions. Moreover, variable FR values were observed in the cytoplasm, which produced a mosaic pattern in the pseudo-color images, possibly arising from GSH in the ER and mitochondria. When HeLa cells were treated with diamide following equilibration with 5 μM FreSHtracer for 2 hr, the FR gradually decreased by diamide (or NEM) and then rapidly increased by DTT (Figures 2B and S3), demonstrating that FreSHtracer reacts reversibly with thiols in the intracellular environment.
Figure 2.

FreSHtracer Visualizes GSH Levels within Subcellular Compartments in Living Cells
(A) Representative confocal images of F510 and F580, and pseudo-color images of the fluorescence ratio (FR) for HeLa cells, hBM-MSCs, and hES-MSCs. The cells were incubated with FreSHtracer (5 μM) for 2 hr. Images of a HeLa cell and hBM-MSCs are the same, with cells indicated by arrows in Figure 4A (0 min).
(B) A reversible reaction of FreSHtracer with intracellular thiols. In HeLa cells equilibrated FreSHtracer (5 μM, 2 hr), F510 and F580 were monitored at 5-s intervals after treatment with diamide (DA), followed by 0.5 mM DTT. (a) Confocal and pseudo-color images of FreSHtracer-loaded cells indicated by numbered arrowheads. (b and c) The F510, F580, and FR of the two cells (arrowheads) were monitored. (d) The average FR values in the whole cell, cytoplasm, and nucleoplasm (n = 4 cells/time point) are shown.
(C) The structure of MitoFreSHtracer, and changes in its fluorescence spectra when reacted with GSH.
(D) Confocal and ratiometric pseudo-color images of a MitoFreSHtracer-loaded (10 μM, 1.5 hr) HeLa cell.
Images are the same with the cell indicated by arrowhead 1 in E (0 min).
(E) Effect of DA (0.5 mM) on the FR within MitoFreSHtracer-loaded HeLa cells. Left: pseudo-color images of the FR. Right: time course of FR changes within the indicated cells (arrowheads).
(F) Effect of antimycin A (0, 100, 200 μM; 75 min) on FR values in MitoFreSHtracer-loaded HeLa cells. Left: pseudo-color images of the FR. Right: concentration-dependent decreases in the FR values within antimycin A-treated cells (n = 90 cells from n = 3 independent experiments).
Data represent the mean ± SEM of the FR; ∗∗∗p < 0.001. Scale bars, 10 μm (A, B, D, E, F). See also Figures S2–S4.
The mitochondrion is the major site of endogenous ROS generation during normal oxidative metabolism (Balaban et al., 2005). Cytosolic GSH is transported to the mitochondria, preventing macromolecular damage and modulating ROS-induced signaling (Mari et al., 2013). To further analyze the FR heterogeneity in the cytoplasm, we synthesized a mitochondria-targeting FreSHtracer derivative, designated MitoFreSHtracer (Figure 2C), by attaching a triphenylphosphonium moiety to FreSHtracer (Murphy and Smith, 2007). MitoFreSHtracer reacted rapidly and reversibly with GSH, exhibited GSH-dependent FR values similar to those of FreSHtracer (KD = 1.3 mM, Figures S4A–S4C), and showed no cytotoxic effect on HeLa cells with treatment up to 10 μM for 24 hr (Figure S4D).
Confocal images revealed that MitoFreSHtracer localized to the mitochondria in HeLa cells (Figure 2D), and the FR decreased upon diamide treatment (Figure 2E), indicating that GSH levels within the mitochondria can be monitored by MitoFreSHtracer. Remarkably, there was wide variation in the FR values among mitochondria within a single cell, even under normal culture conditions (Figure 2D), indicating that the GSH levels in the mitochondria of a single cell are heterogeneous. Moreover, a concentration-dependent decrease in the FR was observed when the cells were treated with antimycin A, which generates ROS in mitochondria by inhibiting electron transport (Drose and Brandt, 2008) (Figure 2F). Simultaneous analyses showed that mitochondrial ROS levels increased with treatment of DHR123, a non-fluorescent rhodamine derivative that localizes to the mitochondria and emits fluorescence when oxidized by ROS (Figures S4E and S4F). Taken together, these results demonstrate that GSH levels differ among organelles as well as among different regions within the same compartment of a live cell.
Real-Time Measurement of GSH Concentrations in Living Cells
Although GSH is the most abundant thiol in cells, proteins constitute a significant portion of cellular thiol (Hansen et al., 2009). Thus, we examined whether FreSHtracer could be not significantly affected by the presence of protein thiols for reporting the continuous changes of GSH levels in living cells. When HeLa cells were treated with various concentrations of buthionine sulfoximine (BSO) for 48 hr to suppress GSH synthesis, measurements of the FR in the GSH-depleted cells showed that the FRGSH accounted for approximately 55% of the total FR in normal cells, and the intracellular GSH concentration, which was independently measured by luminescence-based assays in cell lysates, was directly correlated with the FR determined by confocal microscopy (R2 = 0.9135; Figure 3A) and flow cytometry (R2 = 0.9753; Figure 3B).
Figure 3.

FreSHtracer Can Report the GSH Concentration within Live Cells
(A and B) Determination of the F510/F580 ratio (FR) fraction attributable to GSH (FRGSH). The FR within buthionine sulfoximine (BSO)-treated HeLa cells (3–4 × 10³ cells/cm2; 48 hr) in confocal imaging of each cell (n = 10 cells; A) or the FR within flow-cytometric analysis of BSO-treated cells (n = 3 independent biological replicates; B) were plotted against the GSH concentration determined by luminescence-based methods following cell lysis (n = 3 independent biological replicates; A and B, right).
(C–E) Effect of oxidants on the FR of GSH-depleted cells (FRPSH). BSO-treated HeLa cells (48 hr, 80 μM), equilibrated with FreSHtracer (2 hr, 5 μM), were treated for 15 min with (E) or without (C and D) 50 μM 1-chloro-2,4-dinitrobenzene (CDNB), an irreversible inhibitor of thioredoxin reductase. Fluorescence intensities were measured every 10 s by confocal microscopy following treatment with H2O2 (C) or diamide (DA; D and E). Ratiometric pseudo-color images (C–E, upper) depict the FR (n = 4 cells/time point; C–E, lower). Arrows indicate time points of treatment of H2O2 or diamide.
All error bars represent mean ± SEM. Scale bars, 10 μm (A, C, D, E).
The in vitro experiments described above established that H2O2 treatment diminishes only the FRGSH, while having little effect on the FRPSH (Figures 1H and 1K). In line with these in vitro data, the GSH-depleted cells showed no change in their FR values following the addition of either 100 μM or 500 μM H2O2 over a period of 40 min (Figure 3C), indicating that oxidation of GSH, and not PSH, caused the FR change in H2O2-treated cells. Thus, FreSHtracer can report the real-time dynamic changes of GSH concentration in live cells under oxidative stress. Interestingly, when the GSH-depleted cells were treated with diamide as a control experiment, the FR decreased but was then immediately restored to the original level (Figure 3D). This restoring activity was abrogated by treatment with 1-chloro-2,4-dinitrobenzene, an inhibitor of thioredoxin reductase (Figure 3E), indicating that thioredoxin, instead of GSH, is required to reduce the disulfides of PSH. These results indicate that FreSHtracer can successfully distinguish between GSH and PSH in living cells.
Cellular GSH Levels Dynamically Change under Oxidative Stress
ROS production by various cellular conditions significantly affected SC functions such as self-renewal and differentiation (Ito and Suda, 2014). Thus, we monitored the H2O2-induced changes in GSH levels. When HeLa cells and hBM-MSCs were treated with H2O2, the FR decreased rapidly, then remained unchanged before increasing slowly, and ultimately returned to the untreated level. The profile and time course of FR changes in the cytoplasm and nucleoplasm were similar to those observed in whole cells (Figure 4A). Notably, GSH levels in HeLa cells were more sensitive to H2O2 treatment than those in hBM-MSCs. In HeLa cells treated with increasing concentrations of H2O2, both the decrease in the FR and the lag time for recovery were accentuated (Figure 4B).
Figure 4.

Heterogeneity and Dynamic Changes of GSH Levels in Living Cells
(A and B) HeLa cells and hBM-MSCs were incubated with FreSHtracer (5 μM) for 2 hr, and the fluorescence ratio (FR) changes in response to H2O2 treatment were monitored. HeLa cells and hBM-MSCs equilibrated with FreSHtracer (5 μM, 2 hr) were treated with 50 μM and 100 μM H2O2, respectively, and images were recorded every 10 s using a confocal microscope. Ratiometric pseudo-color images of cells (A, left) depicting the FR of whole cells, the cytoplasm, and the nucleoplasm (n = 7 cells/time point in HeLa cells; n = 20 cells/time point in hBM-MSCs; A, right), and the H2O2 concentration-dependent changes of FR in HeLa cells (B) are shown. A HeLa cell and hBM-MSCs images (A, left) indicated by arrows are reused in Figure 2A.
(C) FR changes of RAW264.7 cells following phorbol 12-myristate 13-acetate (PMA) treatment. RAW264.7 cells equilibrated with FreSHtracer (4 hr, 5 μM) were treated with either ethanol (control) or PMA (0.5 μg/mL). Images were taken every 10 s using a confocal microscope. Left: ratiometric pseudo-color images of control and PMA-treated RAW264.7 cells. Right: FR changes following PMA treatment within the indicated cells (arrowheads).
(D) Effect of serum deprivation on the FR. Following equilibration for 2 hr with 5 μM FreSHtracer, images were taken using a confocal microscope. Upper panel: pseudo-color images depicting the FR. Lower panel: FR within whole cells, the cytoplasm, and the nucleoplasm (n = 30 cells from n = 3 independent experiments).
(E and F) Effect of cell confluence and passage on the FR. HeLa cells (1 × 10⁴, 2 × 10⁴, and 4 × 10⁴ cells/cm2) were cultured for 24 hr and incubated with FreSHtracer (5 μM, 2 hr), followed by confocal microscopy analysis (E, upper). The FR within whole cells, the cytoplasm, and the nucleoplasm was analyzed (n = 30 cells from n = 3 independent experiments; E, lower). hBM-MSCs were subcultured from passage number (P) 4.5 to 6 by seeding at three different densities (1 × 10³, 2 × 10³, and 4 × 10³ cells/cm2) and cultured for 3 days, following equilibration with FreSHtracer (2 μM, 2 hr; F, left). The cells were analyzed using flow cytometry (F, right).
For all bar graphs, values represent mean ± SEM; ∗p < 0.05, ∗∗p < 0.01, ∗∗∗p < 0.001. Scale bars, 10 μm (A, C, D, E).
To confirm these results, we monitored the GSH changes induced by endogenously produced ROS. In macrophages, ROS are produced by NADPH oxidase when the cells are activated. Therefore, RAW264.7 cells were loaded with FreSHtracer and treated with phorbol 12-myristate 13-acetate (PMA). Confocal microscopy revealed that the FR decreased gradually over 30 min upon PMA treatment in every region of the treated cells and was then slowly restored to the control level during the following 30 min (Figure 4C). Moreover, ROS production was also reported to increase in cells cultured at a low density or in serum-deprived medium (Gutscher et al., 2008). Therefore, we monitored the effect of culture conditions on the changes of GSH levels. Exposure of HeLa cells to serum-free medium for 18 hr significantly reduced the FR in the cytoplasm and in the nucleoplasm (Figure 4D). When cultured at different densities, the average FR of densely cultured HeLa cells was significantly higher than that of sparsely cultured cells, despite the large variation in the FR, particularly in the nucleoplasm (Figure 4E).
We then extended these results to monitor the GSH levels in hBM-MSCs. The cells were serially subcultured at different seeding densities. Flow-cytometric analysis showed that the hBM-MSC populations were heterogeneous with respect to GSH levels, and, notably, the number of cells with a high GSH content (GSHHigh) gradually decreased with increasing passages, especially when cultured at a low cell density (Figure 4F), indicating that GSH levels in SCs depend on the culture conditions. Together, these results demonstrate that GSH levels are dynamically changed in response to oxidative stress, and that FreSHtracer can provide spatiotemporal information of GSH levels for estimating the redox buffering capacity of individual cells.
High GSH Levels Are Required for Stem Cell Function
To further explore the biological significance of the reprogrammed GSH levels in SCs, we sorted hBM-MSCs by flow cytometry and divided them into three subpopulations based on the FR (FRHigh, FRMid, and FRLow cells; Figure S5A), following the rapid removal of FreSHtracer in sorted cells (Figure S5B). When we compared the functional characteristics of sorted SC subpopulations in vitro, the FRHigh hBM-MSCs, compared with FRMid and FRLow cells, significantly enhanced the cellular functions regarding colony-forming unit fibroblasts (CFU-F) and the chemoattraction to platelet-derived growth factor (PDGF) (Figures S5C and S5D).
To further validate the improved functionality of SCs with a high GSH content, via fluorescence-activated cell sorting we sorted hES-MSCs into FRHigh, FRMid, and FRLow subpopulations based on the FR (Figure 5A). The GSH concentrations in the cell lysates from each population were directly proportional to their FR levels, validating the FR-based sorting method (Figure 5B). Intriguingly, the decrease of FR and the lag time for recovery following treatment with 100 μM H2O2 were inversely proportional to the FR levels of the sorted cell population (Figure 5C). Moreover, the FR of FRHigh cells recovered to higher than basal levels after H2O2 exposure, indicating that FRHigh cells have greater GSH-restoring capacity compared with control cells.
Figure 5.

Intracellular GSH Levels Modulate the Self-Renewal and Migration Activities of Mesenchymal Stem Cells
(A) Sorting of hES-MSCs according to the F510/F580 ratio (FR) into three populations: FRHigh, FRMid, and FRLow cells. Cells were characterized as described below, following the removal of FreSHtracer.
(B and C) Luminescence-based quantification of GSH in cell lysates (n = 2 independent biological replicates; B) and comparison of FR changes following treatment with 100 μM H2O2 (n = 3 cells; C) in FRHigh, FRMid, and FRLow hES-MSCs.
(D–I) Analyses of cell proliferation (n = 6 independent biological replicates; D), colony-forming unit fibroblasts (CFU-F; n = 15 independent biological replicates; E), limiting dilution by replating primary CFU colonies (n = 6 independent biological replicates; F), chemotaxis to stromal derived factor-1α (SDF1α; 150 ng/mL, n = 8 independent biological replicates; G), chemotaxis to 10 ng/mL platelet-derived growth factor (PDGF)-AA in the absence or presence of STI571 (0.5 μg/mL), a PDGFR inhibitor (n = 8 independent biological replicates; H), and qPCR of OCT4, SOX2, CXCR4, cMET, PDGFRA, PDGFRB, VEGFR1, and VEGFR2 (n = 8 independent biological replicates; I) in hES-MSCs sorted based on the FR and in unsorted control (naive) cells.
(J–L) Functional role of high GSH levels in hES-MSCs. CFU-F (n = 10 independent biological replicates; J), chemotaxis to 10 ng/mL PDGF-AA (n = 8 independent biological replicates; K), and qPCR assays of stemness and migration-related genes (n = 4 independent biological replicates; L) in control and BSO-treated FRHigh hES-MSCs or control and GSH-EE supplemented FRLow cells.
For all bar graphs, values represent mean ± SEM; ∗p < 0.05, ∗∗p < 0.01, ∗∗∗p < 0.001; n.s., not significant. Scale bars, 200 μm (G and H). See also Figures S5 and S6.
As shown in Figure 5D, the sorted hES-MSCs showed no significant difference in proliferation rate. When multipotency was examined, both FRHigh and FRLow cells exhibited a similar capacity to differentiate into chondrogenic, adipogenic, and osteogenic lineages (Figure S6A), but FRHigh hES-MSCs, compared with FRLow cells, showed a significant increase in the induction of some lineage markers, including SOX9, AP2, and OCN (Figure S6B). Additionally, FRHigh hES-MSCs had approximately 4.7- and 4.9-fold higher numbers of CFU-F than did FRMid and FRLow cells, respectively (Figure 5E). When individual CFU colonies were harvested and reseeded for limiting dilution assay, CFU colonies from FRHigh hES-MSCs showed two times the clonogenic activity than those from FRLow cells (Figure 5F), indicating the enhanced self-renewal activity of FRHigh hES-MSCs. FRHigh cells in both types of SCs showed significantly enhanced chemoattraction to stromal derived factor 1 compared with naive or FRLow cells (Figure 5G). The improved chemotactic activities in FRHigh cells were also found by PDGF stimuli and were significantly blocked by a PDGF receptor (PDGFR) inhibitor, STI571 (Figure 5H). Accordingly, FRHigh hES-MSCs showed significantly higher mRNA levels of pluripotency- or migration-related genes than did naive and FRLow cells, including OCT4 and CXCR4 (Figure 5I).
To prove the functional role of high GSH levels, we depleted cellular GSH in FRHigh hES-MSCs using BSO and found that GSH depletion severely impaired the enhanced clonogenic and migration capacities as well as upregulation of the related genes observed in FRHigh hES-MSCs (Figures 5J–5L, S6C, and S6D). In line with these data, declined cellular functions in FRLow hES-MSCs were reversed to levels similar to those of FRHigh cells by glutathione ethyl ester (GSH-EE), a cell-permeable glutathione. Moreover, naive cells treated with BSO and GSH-EE resulted in the significant repression and activation of chemoattraction to PDGF, respectively (Figure S6E).
To further investigate the significance of a high GSH content among other types of SC, we fractionated murine ESCs (mESCs) into higher- and lower-GSH level cells based on the FR of FreSHtracer (Figures 6A and 6B). Compared with FRLow mESCs, FRHigh cells displayed remarkably enhanced cellular function regarding GSH recovery capacity following H2O2 treatment (Figures 6C and 6D) and exhibited dome-like morphological colonies with positive alkaline phosphatase staining, characteristic of undifferentiated ESCs (Figure 6E). Additionally, FRHigh mESCs were superior to FRLow cells in terms of clonogenic efficiency as exhibited in the limiting dilution assay representing self-renewal activity (Figure 6F) and greater expression of pluripotency-related genes (Figures 6G and 6H). When they were differentiated by forming embryoid bodies (EBs), FRLow mESCs exhibited defects in EB formation (Figure 6I) and induction of several lineage markers, such as neural (e.g., Neurog2 and Olig2) and mesodermal (e.g., T and Nkx2.5) markers (Figures 6J and S6F). The defective differentiation capacity in cells from FRLow EB was further validated by in vitro neuronal differentiation, evidenced by a lack of βIII-tubulin+ neurons (Figure 6K) and by impaired induction of neuronal markers (Figure 6L). Taken together, these findings demonstrate that high cellular GSH levels are required for maintaining the core functions in SCs.
Figure 6.

Impaired Pluripotency and Differentiation in Murine Embryonic Stem Cells with Low GSH Levels
(A) Sorting of murine ESCs (mESCs) according to the F510/F580 ratio (FR) into FRHigh and FRLow populations.
(B) Luminescence-based quantification of GSH in cell lysates (n = 4 independent biological replicates).
(C and D) Representative pseudo-colored confocal images of the FR (C) and the comparison of their FR changes (n = 4 cells; D) in FRHigh and FRLow mESCs, following treatment with 100 μM H2O2. Scale bars, 10 μm.
(E) Representative pictures for bright-field (upper panel) and alkaline phosphatase (AP) staining (lower panel). Scale bars, 200 μm.
(F–H) Clonogenic capacity in limiting dilution (n = 5 independent biological replicates; F), qPCR (n = 4 independent biological replicates; G), and western blot (H) analyses in FRHigh and FRLow mESCs and in unsorted control (naive) cells.
(I) Representative pictures (left) and quantitation (n = 6 independent biological replicates; right) for size of 5-day embryoid body (EB) formed from FRHigh and FRLow mESCs. Scale bars, 200 μm.
(J) qPCR analyses for lineage-specific genes (Neurog2, Olig2, T, and Nkx2.5) in EBs at the indicated day (n = 4 independent biological replicates).
(K and L) Immunostaining of βIII-tubulin+ neuron cells (green; K) qPCR analyses of neural lineage markers (Neurog1, Neurod1, Nkx2.2, Ascl2, Gfap, S100b, and Olig2; n = 4 independent biological replicates; L) during ESC differentiation. Nuclei were counterstained with DAPI (blue; K). The βIII-tubulin+ neuron cells were quantitated by their frequency in total DAPI+ cells (n = 5 independent biological replicates; K, right panel). Scale bars, 100 μm.
Values represent mean ± SEM; ∗p < 0.05, ∗∗p < 0.01, ∗∗∗p < 0.001. See also Figure S6.
GSHHigh Stem Cells Show Higher Therapeutic Effectiveness in a Mouse Model of Asthma
To confirm these results in vivo, we compared the therapeutic effectiveness of FRHigh and FRLow hES-MSCs in a mouse model of virus-associated asthma. The mice were sensitized and challenged with ovalbumin and poly(I:C) and then injected with the sorted or naive hES-MSCs via the tail vein (Figure 7A). Histological examination showed that inflammatory responses were markedly attenuated around the bronchial and perivascular areas in the lungs of the FRHigh cell-injected mice compared with those of the FRLow or naive cell-injected mice (Figure 7B). The number of inflammatory cells in the bronchoalveolar lavage fluid from FRHigh cell-injected mice was lower than that from FRLow or naive cell-injected mice (Figure 7C). Similarly, tumor necrosis factor α (TNF-α) and interleukin-17 (IL-17) levels were lower, whereas IL-10 levels were higher in the bronchoalveolar lavage fluid from FRHigh cell-injected mice (Figure 7D). qRT-PCR confirmed the significantly decreased mRNA levels of inflammatory cytokines in the lung tissues of FRHigh cell-injected mice (Figure 7E). Moreover, immunohistochemical staining with human β2-microglobulin antibody showed a marked increase of engrafted cells in the lungs of FRHigh hES-MSC-injected mice, which were identified as type-2 alveolar cells by staining with anti-prosurfactant protein C (SFTPC) antibody (Figures 7F and S7). These results indicated that the injected hES-MSCs differentiated into the alveolar epithelium (Krause et al., 2001, Rojas et al., 2005), contributing to tissue regeneration. Taken together, these results suggest that GSH levels can be used as a marker to evaluate SC function for enhancing the therapeutic potency.
Figure 7.

Stem Cells with High GSH Levels Exhibit Increased Therapeutic Efficacy
(A) Scheme for establishment of the poly(I:C)-induced mouse model of asthma.
(B–F) Naive, FRHigh, and FRLow hES-MSCs, or PBS were administered to mice treated with ovalbumin (OVA) and poly(I:C). (B) H&E staining of lung tissues. Sham, sham-operated. (C) Number of total cells, macrophages, neutrophils, lymphocytes, and eosinophils (n = 30 independent biological replicates from n = 10 mice) and (D) ELISA-based detection of TNF-α, IL-10, and IL-17 in the bronchoalveolar lavage fluid (n = 10 independent biological replicates from n = 10 mice). (E) qPCR analysis of Tnfa, Clcl2, Il1b, Il12a, and Il18 expression using RNA isolated from the lung tissues (n = 10 independent biological replicates from n = 10 mice). (F) Immunofluorescent staining of human β-2 microglobulin expression (hB2M, red) and prosurfactant protein C (SFTPC, green) in the lung tissues. Nuclei were stained with DAPI (blue).
For all bar graphs, values represent mean ± SEM; ∗p < 0.05, ∗∗p < 0.01, ∗∗∗p < 0.001; n.s., not significant. Scale bars, 200 μm (B and F). See also Figure S7.
Discussion
GSH, the most abundant non-protein thiol in cells, functions as a redox buffer, preventing oxidative damage and regulating redox signaling. Therefore, the intracellular GSH level has been used as an important indicator to assess the intensity of oxidative stress (Winterbourn and Hampton, 2008). Since GSH levels are continuously fluctuating, owing to its regeneration and increased de novo synthesis under oxidative stress conditions (Lu, 2013), the real-time monitoring of GSH levels is required for a detailed analysis of the strength and duration of oxidative damage and consequent redox signaling. In the present study, we demonstrated that FreSHtracer, a chemical probe with the ability to undergo reversible addition reactions with thiols, can be used to monitor and measure GSH levels in living cells. The reaction with GSH induces changes in the fluorescence excitation and emission of the probe, which enables the ratiometric measurement of GSH, thus excluding the possible errors caused by different uptake of the FreSHtracer dye for individual cells and a specific organelle. FreSHtracer readily penetrates through cell membranes, and can report GSH levels with no cytotoxicity under both physiological and various ROS-generating conditions. More importantly, our detail in vitro kinetic and in vivo cellular studies showed that the FreSHtracer probe can successfully distinguish GSH from protein thiols (Figures 1 and 3). This simple, rapid, and ratiometric method is well suited for studying GSH dynamics of SCs using various techniques, including microscopic and flow-cytometric analyses.
Our results showed that GSH levels are much higher in the nucleus than in the cytosol, as proposed previously (García-Giménez et al., 2013). In addition, GSH levels decreased in the nucleus and cytosol to a similar extent, and maintained a concentration gradient under oxidative stress conditions, suggesting an unidentified mechanism that transports GSH into the nucleus against such a gradient. The maintenance of high GSH levels in the nucleus also suggests that GSH regulates DNA synthesis, transcription, and repair through modulation of redox signaling (García-Giménez et al., 2013).
Mitochondrial GSH (mGSH) constitutes 10%–15% of the total cellular GSH pool and is imported from the cytosol to play a major role in maintaining mitochondrial redox homeostasis (Mari et al., 2013). Our results with MitoFreSHtracer demonstrated that the mGSH levels differ among the mitochondria in a single cell. Such heterogeneity of mGSH levels might reflect differences in the activity of GSH transporters, rate of ROS production, and/or activity of NADPH production. With defects in these activities, depletion of mGSH results in DNA damage or apoptotic cell death and contributes to the pathogenesis of a number of diseases (Mari et al., 2013). Thus, MitoFreSHtracer could become an indispensable tool for investigating the regulation of mGSH in a variety of contexts.
A low ROS level is critical to preserve the self-renewal process of SCs (Mohyeldin et al., 2010) as well as to prevent mutations or damage that could impair their genetic and epigenetic integrity (Bigarella et al., 2014, Heo et al., 2017). Hematopoietic SCs with low ROS levels sorted by dichlorofluorescence staining exhibited long-term repopulating capacity (Jang and Sharkis, 2007). Consistently, we demonstrated that GSH levels were well correlated with the self-renewal activity of SCs. These results provide insight into the role of GSH in regulating redox signaling, which plays an important role in determining the SC fate, possibly modulating the activities of transcriptional factors such as NRF2 or FoxOs (Bigarella et al., 2014). Thus, monitoring of cellular GSH is necessary to evaluate SC function.
There is conflicting evidence on the role of ROS in the regulation of SC activities. ROS generated by Nox1 in neural SCs or by Nox2 in spermatogonial SCs were shown to be required for their self-renewal activity (Le Belle et al., 2011, Morimoto et al., 2013). In contrast, ROS exhibited inhibitory effects on SC function (Kim and Wong, 2009, Nakamura et al., 2010). In addition, the defective hematopoietic SC functions observed in Nrf2-deficient mice were found to be independent of the ROS level (Merchant et al., 2011). These seemingly contradictory results might be attributed to microenvironment- and cell-type-specific mechanisms. Embryonic or quiescent adult SCs minimize ROS production by residing within a specialized niche with a relatively low oxygen concentration (1%–8%) in the body (Mohyeldin et al., 2010) and by depending on anaerobic glycolysis through low mitochondrial biogenesis (Ito and Suda, 2014). Moreover, in the present study, GSHHigh SCs exhibited greater GSH-regenerating activity than GSHLow SCs (Figures 5C and 6D). Therefore, the intrinsic activities of GSH synthesis and regeneration, rather than the amount of ROS produced, are responsible for determining the effect of ROS on cellular function.
Flow-cytometric analysis of SC populations revealed substantial heterogeneity of GSH levels among individual cells, and GSHHigh cell fractionation using FreSHtracer showed the enhanced functionalities evidenced in both in vitro and in vivo analyses. Importantly, we found that this heterogeneity of GSH levels changed in the SC population with increasing passage numbers (Figure 4F). These findings indicate that SCs respond differently to oxidative stress even under exposure to an atmospheric oxygen concentration (21%). Further work is needed to investigate the mechanism by which GSH levels are differentially regulated in SCs in response to ROS. FreSHtracer is a useful tool for the real-time monitoring of intracellular GSH levels in living SCs and for fractionating cells according to their GSH levels. Comparison of the signaling pathways between GSHHigh and GSHLow cells could be helpful in identifying the key players involved in the GSH regulation of SCs.
In summary, we demonstrated that FreSHtracer could be used for studying various aspects of GSH homeostasis, including synthesis, transport, and regeneration. Spatiotemporal information regarding intracellular GSH levels in living cells might facilitate detailed investigations into the molecular mechanisms contributing to altered cellular functions in response to internal and external stresses. During the preparation of this paper, recent studies also reported very similar coumarin derivatives for the monitoring of GSH levels inside HeLa cells (Chen et al., 2017, Jiang et al., 2017).
Experimental Procedures
Detailed methods are provided in Supplemental Experimental Procedures.
Cell Lines and Culture
HeLa and RAW264.7 cells were purchased from the Korean Cell Line Bank (Seoul, Korea) and the American Type Culture Collection (ATCC; Manassas, VA), respectively. The cells were grown in phenol red-free DMEM (Welgene, LM 001-10; Gyeongsan, Korea) supplemented with 10% heat-inactivated fetal bovine serum (HyClone; GE Healthcare, Melbourne, VIC, Australia), 100 U/mL penicillin, 100 μg/mL streptomycin sulfate, and 2 mM glutamine. hES-MSCs were kindly provided by Hyung-Min Chung (Konkuk University, Korea). Cellular GSH of hES-MSCs was depleted by treating cells with 80 μM BSO (Sigma-Aldrich, St. Louis, MO) for 24 hr and was restored with 1 mM GSH-EE (Sigma-Aldrich) for 2 hr, followed by their functional assays. hBM-MSCs (Lonza, Walkersville, MD) were cultured according to the manufacturer's instructions. Culture, EB formation, and in vitro neuronal differentiation of murine E14TG2a ESCs (ATCC) were performed as previously described (Heo et al., 2017).
Confocal Imaging of the Fluorescence Ratio within Living Cells
HeLa cells (1.8 × 10⁵ cells/dish), RAW264.7 cells (2 × 10⁵ cells/dish), hBM-MSCs (8 × 10⁴ cells/dish), hES-MSCs (1.5 × 10⁵ cells/dish), and murine E14TG2a ESCs (5 × 10⁵ cells/dish) were seeded onto 35-mm coverglass-bottom dishes (SPL Life Sciences, Pocheon, Korea) and cultured at 37°C in a 5% CO2 incubator for 16–20 hr. The cells were then equilibrated with 5 μM FreSHtracer in 2 mL of culture medium, followed by microscopic analysis. For mitochondrial GSH imaging, HeLa cells were incubated with 10 μM MitoFreSHtracer for 1.5 hr, washed twice with PBS, and analyzed in 2 mL of fresh culture medium using a confocal microscope. Time-lapse imaging of the cells was performed using a Nikon A1 laser-scanning confocal microscope. The cells were maintained at 37°C in a 5% CO2 atmosphere by a stage-top incubator. The chamber was mounted on a Nikon ECLIPSE Ti inverted microscope, equipped with a CFI Plan apochromat 60×, 1.40-numerical aperture (NA) objective (oil immersion) or a CFI Plan apochromat 20×, 0.8-NA objective. FreSHtracer was excited by lasers at 405 nm and 488 nm, and the emissions were detected through 500- to 550-nm and 570- to 620-nm band-pass filters. Cells in the focused area were gently treated with 20 μL of 100× concentrated solutions of H2O2, diamide, or DTT. Data were analyzed and pseudo-color ratio images were generated using NIS-Elements AR software. FreSHtracer was prepared according to our previously reported method (Cho and Choi, 2012). This probe is now commercially available (Cell2in, Seoul, Korea).
Animal Study Approval
All animal experiments were approved and performed in accordance with guidelines set by the Institutional Animal Care and Use Committee of the University of the Ulsan College of Medicine (2015-12-061).
Statistical Analysis
We used a two-sided t test for single pairwise comparisons. We also used one-way ANOVA with a Tukey post hoc test for multiple comparisons. Values are expressed as the mean and SEM. All statistical analyses were performed using GraphPad Prism 5 software.
Author Contributions
E.M.J., K.C., and D-.M.S. designed the experiments; E.M.J., J-.H.Y., J.L., J-.W.S., A.Y.C., J.H., K.B.L., J-.H.L., W.J.L., H-.J.K., Y.H.S., S-.J.L., S-.Y.C., and K.C. performed the experiments; E.M.J., D-.M.S., K.C., and I-.G.K. wrote the paper.
Acknowledgments
We thank Dr. Hyung-Min Chung for providing the hES-MSCs, Hyewon Kang for assisting with the stem cell experiments, and the staff of the Biomedical Imaging Center and FACS Center of the Core Research Facilities of Seoul National University College of Medicine for their technical advice and assistance. This work was funded by the National Research Foundation of Korea through the Basic Science Research Program (NRF-2013R1A1A2065273, NRF-2014R1A2A2A01006731, NRF-2014R1A1A2055832, NRF-2017R1D1A1B03035059, and NRF-2017M3A9B4061890); the Korea Healthcare Technology R&D Project, Ministry of Health and Welfare, Republic of Korea (HI10C0185 and HI14C3339); and the Brain Korea 21 PLUS program of the Korean Ministry of Education, Science and Technology. I-.G.K., K.C., D-.M.S., E.M.J., and J-.W.S. co-founded Cell2in, a company developing cell therapy using FreSHtracer.
Published: January 4, 2018
Footnotes
Supplemental Information includes Supplemental Experimental Procedures, seven figures, and one table and can be found with this article online at https://doi.org/10.1016/j.stemcr.2017.12.007.
Contributor Information
Dong-Myung Shin, Email: d0shin03@amc.seoul.kr.
Kihang Choi, Email: kchoi@korea.ac.kr.
In-Gyu Kim, Email: igkim@plaza.snu.ac.kr.
Supplemental Information
References
- Balaban R.S., Nemoto S., Finkel T. Mitochondria, oxidants, and aging. Cell. 2005;120:483–495. doi: 10.1016/j.cell.2005.02.001. [DOI] [PubMed] [Google Scholar]
- Bigarella C.L., Liang R., Ghaffari S. Stem cells and the impact of ROS signaling. Development. 2014;141:4206–4218. doi: 10.1242/dev.107086. [DOI] [PMC free article] [PubMed] [Google Scholar]
- Chen J., Jiang X., Carroll S., Huang J., Wang J. Theoretical and experimental investigation of thermodynamics and kinetics of thiol-Michael addition reactions: a case study of reversible fluorescent probes for glutathione imaging in single cells. Org. Lett. 2015;17:5978–5981. doi: 10.1021/acs.orglett.5b02910. [DOI] [PMC free article] [PubMed] [Google Scholar]
- Chen J., Jiang X., Zhang C., MacKenzie K.R., Stossi F., Palzkill T., Wang M.C., Wang J. Reversible reaction-based fluorescent probe for real-time imaging of glutathione dynamics in mitochondria. ACS Sens. 2017;2:1257–1261. doi: 10.1021/acssensors.7b00425. [DOI] [PMC free article] [PubMed] [Google Scholar]
- Cho A.Y., Choi K. A coumarin-based fluorescence sensor for the reversible detection of thiols. Chem. Lett. 2012;41:1611–1612. [Google Scholar]
- Dannenmann B., Lehle S., Hildebrand D.G., Kubler A., Grondona P., Schmid V., Holzer K., Froschl M., Essmann F., Rothfuss O. High glutathione and glutathione peroxidase-2 levels mediate cell-type-specific DNA damage protection in human induced pluripotent stem cells. Stem Cell Reports. 2015;4:886–898. doi: 10.1016/j.stemcr.2015.04.004. [DOI] [PMC free article] [PubMed] [Google Scholar]
- Drose S., Brandt U. The mechanism of mitochondrial superoxide production by the cytochrome bc1 complex. J. Biol. Chem. 2008;283:21649–21654. doi: 10.1074/jbc.M803236200. [DOI] [PubMed] [Google Scholar]
- Finka A., Goloubinoff P. Proteomic data from human cell cultures refine mechanisms of chaperone-mediated protein homeostasis. Cell Stress Chaperones. 2013;18:591–605. doi: 10.1007/s12192-013-0413-3. [DOI] [PMC free article] [PubMed] [Google Scholar]
- García-Giménez J.L., Markovic J., Dasí F., Queval G., Schnaubelt D., Foyer C.H., Pallardó F.V. Nuclear glutathione. Biochim. Biophys. Acta. 2013;1830:3304–3316. doi: 10.1016/j.bbagen.2012.10.005. [DOI] [PubMed] [Google Scholar]
- Gutscher M., Pauleau A.L., Marty L., Brach T., Wabnitz G.H., Samstag Y., Meyer A.J., Dick T.P. Real-time imaging of the intracellular glutathione redox potential. Nat. Methods. 2008;5:553–559. doi: 10.1038/nmeth.1212. [DOI] [PubMed] [Google Scholar]
- Hansen R.E., Roth D., Winther J.R. Quantifying the global cellular thiol-disulfide status. Proc. Natl. Acad. Sci. USA. 2009;106:422–427. doi: 10.1073/pnas.0812149106. [DOI] [PMC free article] [PubMed] [Google Scholar]
- Heo J., Lim J., Lee S., Jeong J., Kang H., Kim Y., Kang J.W., Yu H.Y., Jeong E.M., Kim K. Sirt1 regulates DNA methylation and differentiation potential of embryonic stem cells by antagonizing Dnmt3l. Cell Rep. 2017;18:1930–1945. doi: 10.1016/j.celrep.2017.01.074. [DOI] [PubMed] [Google Scholar]
- Hochmuth C.E., Biteau B., Bohmann D., Jasper H. Redox regulation by Keap1 and Nrf2 controls intestinal stem cell proliferation in Drosophila. Cell Stem Cell. 2011;8:188–199. doi: 10.1016/j.stem.2010.12.006. [DOI] [PMC free article] [PubMed] [Google Scholar]
- Hong K.S., Bae D., Choi Y., Kang S.W., Moon S.H., Lee H.T., Chung H.M. A porous membrane-mediated isolation of mesenchymal stem cells from human embryonic stem cells. Tissue Eng. Part C Methods. 2015;21:322–329. doi: 10.1089/ten.tec.2014.0171. [DOI] [PMC free article] [PubMed] [Google Scholar]
- Ito K., Suda T. Metabolic requirements for the maintenance of self-renewing stem cells. Nat. Rev. Mol. Cell Biol. 2014;15:243–256. doi: 10.1038/nrm3772. [DOI] [PMC free article] [PubMed] [Google Scholar]
- Jang J., Wang Y., Kim H.S., Lalli M.A., Kosik K.S. Nrf2, a regulator of the proteasome, controls self-renewal and pluripotency in human embryonic stem cells. Stem Cells. 2014;32:2616–2625. doi: 10.1002/stem.1764. [DOI] [PMC free article] [PubMed] [Google Scholar]
- Jang Y.Y., Sharkis S.J. A low level of reactive oxygen species selects for primitive hematopoietic stem cells that may reside in the low-oxygenic niche. Blood. 2007;110:3056–3063. doi: 10.1182/blood-2007-05-087759. [DOI] [PMC free article] [PubMed] [Google Scholar]
- Jiang X., Chen J., Bajić A., Zhang C., Song X., Carroll S.L., Cai Z.L., Tang M., Xue M., Cheng N. Quantitative real-time imaging of glutathione. Nat. Commun. 2017;8:16087. doi: 10.1038/ncomms16087. [DOI] [PMC free article] [PubMed] [Google Scholar]
- Kim G.J., Lee K., Kwon H., Kim H.J. Ratiometric fluorescence imaging of cellular glutathione. Org. Lett. 2011;13:2799–2801. doi: 10.1021/ol200967w. [DOI] [PubMed] [Google Scholar]
- Kim J., Wong P.K. Loss of ATM impairs proliferation of neural stem cells through oxidative stress-mediated p38 MAPK signaling. Stem Cells. 2009;27:1987–1998. doi: 10.1002/stem.125. [DOI] [PubMed] [Google Scholar]
- Krause D.S., Theise N.D., Collector M.I., Henegariu O., Hwang S., Gardner R., Neutzel S., Sharkis S.J. Multi-organ, multi-lineage engraftment by a single bone marrow-derived stem cell. Cell. 2001;105:369–377. doi: 10.1016/s0092-8674(01)00328-2. [DOI] [PubMed] [Google Scholar]
- Le Belle J.E., Orozco N.M., Paucar A.A., Saxe J.P., Mottahedeh J., Pyle A.D., Wu H., Kornblum H.I. Proliferative neural stem cells have high endogenous ROS levels that regulate self-renewal and neurogenesis in a PI3K/Akt-dependant manner. Cell Stem Cell. 2011;8:59–71. doi: 10.1016/j.stem.2010.11.028. [DOI] [PMC free article] [PubMed] [Google Scholar]
- Lu S.C. Glutathione synthesis. Biochim. Biophys. Acta. 2013;1830:3143–3153. doi: 10.1016/j.bbagen.2012.09.008. [DOI] [PMC free article] [PubMed] [Google Scholar]
- Mari M., Morales A., Colell A., Garcia-Ruiz C., Kaplowitz N., Fernandez-Checa J.C. Mitochondrial glutathione: features, regulation and role in disease. Biochim. Biophys. Acta. 2013;1830:3317–3328. doi: 10.1016/j.bbagen.2012.10.018. [DOI] [PMC free article] [PubMed] [Google Scholar]
- Marsboom G., Zhang G.F., Pohl-Avila N., Zhang Y., Yuan Y., Kang H., Hao B., Brunengraber H., Malik A.B., Rehman J. Glutamine metabolism regulates the pluripotency transcription factor OCT4. Cell Rep. 2016;16:323–332. doi: 10.1016/j.celrep.2016.05.089. [DOI] [PMC free article] [PubMed] [Google Scholar]
- Merchant A.A., Singh A., Matsui W., Biswal S. The redox-sensitive transcription factor Nrf2 regulates murine hematopoietic stem cell survival independently of ROS levels. Blood. 2011;118:6572–6579. doi: 10.1182/blood-2011-05-355362. [DOI] [PMC free article] [PubMed] [Google Scholar]
- Mohyeldin A., Garzon-Muvdi T., Quinones-Hinojosa A. Oxygen in stem cell biology: a critical component of the stem cell niche. Cell Stem Cell. 2010;7:150–161. doi: 10.1016/j.stem.2010.07.007. [DOI] [PubMed] [Google Scholar]
- Morimoto H., Iwata K., Ogonuki N., Inoue K., Atsuo O., Kanatsu-Shinohara M., Morimoto T., Yabe-Nishimura C., Shinohara T. ROS are required for mouse spermatogonial stem cell self-renewal. Cell Stem Cell. 2013;12:774–786. doi: 10.1016/j.stem.2013.04.001. [DOI] [PubMed] [Google Scholar]
- Murphy M.P., Smith R.A. Targeting antioxidants to mitochondria by conjugation to lipophilic cations. Annu. Rev. Pharmacol. Toxicol. 2007;47:629–656. doi: 10.1146/annurev.pharmtox.47.120505.105110. [DOI] [PubMed] [Google Scholar]
- Nakamura B.N., Lawson G., Chan J.Y., Banuelos J., Cortes M.M., Hoang Y.D., Ortiz L., Rau B.A., Luderer U. Knockout of the transcription factor NRF2 disrupts spermatogenesis in an age-dependent manner. Free Radic. Biol. Med. 2010;49:1368–1379. doi: 10.1016/j.freeradbiomed.2010.07.019. [DOI] [PMC free article] [PubMed] [Google Scholar]
- Paul M.K., Bisht B., Darmawan D.O., Chiou R., Ha V.L., Wallace W.D., Chon A.T., Hegab A.E., Grogan T., Elashoff D.A. Dynamic changes in intracellular ROS levels regulate airway basal stem cell homeostasis through Nrf2-dependent Notch signaling. Cell Stem Cell. 2014;15:199–214. doi: 10.1016/j.stem.2014.05.009. [DOI] [PMC free article] [PubMed] [Google Scholar]
- Rojas M., Xu J., Woods C.R., Mora A.L., Spears W., Roman J., Brigham K.L. Bone marrow-derived mesenchymal stem cells in repair of the injured lung. Am. J. Respir. Cell Mol. Biol. 2005;33:145–152. doi: 10.1165/rcmb.2004-0330OC. [DOI] [PMC free article] [PubMed] [Google Scholar]
- Tsai J.J., Dudakov J.A., Takahashi K., Shieh J.H., Velardi E., Holland A.M., Singer N.V., West M.L., Smith O.M., Young L.F. Nrf2 regulates haematopoietic stem cell function. Nat. Cell Biol. 2013;15:309–316. doi: 10.1038/ncb2699. [DOI] [PMC free article] [PubMed] [Google Scholar]
- Umezawa K., Yoshida M., Kamiya M., Yamasoba T., Urano Y. Rational design of reversible fluorescent probes for live-cell imaging and quantification of fast glutathione dynamics. Nat. Chem. 2017;9:279–286. doi: 10.1038/nchem.2648. [DOI] [PubMed] [Google Scholar]
- Wang K., Zhang T., Dong Q., Nice E.C., Huang C., Wei Y. Redox homeostasis: the linchpin in stem cell self-renewal and differentiation. Cell Death Dis. 2013;4:e537. doi: 10.1038/cddis.2013.50. [DOI] [PMC free article] [PubMed] [Google Scholar]
- Winterbourn C.C., Hampton M.B. Thiol chemistry and specificity in redox signaling. Free Radic. Biol. Med. 2008;45:549–561. doi: 10.1016/j.freeradbiomed.2008.05.004. [DOI] [PubMed] [Google Scholar]
- Yin C., Huo F., Zhang J., Martinez-Manez R., Yang Y., Lv H., Li S. Thiol-addition reactions and their applications in thiol recognition. Chem. Soc. Rev. 2013;42:6032–6059. doi: 10.1039/c3cs60055f. [DOI] [PubMed] [Google Scholar]
Associated Data
This section collects any data citations, data availability statements, or supplementary materials included in this article.