

Abstract
Endoplasmic reticulum (ER)–plasma membrane (PM) junctions form functionally active microdomains that connect intracellular and extracellular environments. While the key role of these interfaces in maintenance of intracellular Ca2+ levels has been uncovered in recent years, the functional significance of ER‐PM junctions in non‐excitable cells has remained unclear. Here, we show that the ER calcium sensor protein STIM1 (stromal interaction molecule 1) interacts with the plasma membrane‐localized adenylyl cyclase 6 (ADCY6) to govern melanogenesis. The physiological stimulus α‐melanocyte‐stimulating hormone (αMSH) depletes ER Ca2+ stores, thus recruiting STIM1 to ER‐PM junctions, which in turn activates ADCY6. Using zebrafish as a model system, we further established STIM1's significance in regulating pigmentation in vivo. STIM1 domain deletion studies reveal the importance of Ser/Pro‐rich C‐terminal region in this interaction. This mechanism of cAMP generation creates a positive feedback loop, controlling the output of the classical αMSH‐cAMP‐MITF axis in melanocytes. Our study thus delineates a signaling module that couples two fundamental secondary messengers to drive pigmentation. Given the central role of calcium and cAMP signaling pathways, this module may be operative during various other physiological processes and pathological conditions.
Keywords: ADCY6, cAMP, Orai1, pigmentation, STIM1
Subject Categories: Development & Differentiation, Physiology, Signal Transduction
Introduction
The endoplasmic reticulum (ER) is the largest membrane system in animal cells that forms a continuous network extending from the cellular plasma membrane (PM) to the nuclear envelope (David, 2013; English & Voeltz, 2013). ER is a key biosynthetic hub that produces variety of secretory proteins and lipid species (David, 2013; Stefan et al, 2013) and additionally maintains a large intracellular Ca2+ store. Store‐operated Ca2+ entry (SOCE) is a crucial pathway activated at ER‐PM junctions (Smyth et al, 2010). SOCE is initiated upon Ca2+ release from the intracellular stores of ER. STIM1, a Ca2+ binding ER membrane protein, senses the decrease in ER Ca2+ levels. Upon loss of Ca2+, STIM1 oligomerizes and interacts with Orai channels at the plasma membrane. This results in opening of the Orai channels leading to Ca2+ influx into the cells (Smyth et al, 2010). Several other interacting partners for STIM1 such as voltage‐gated Ca2+ channels (CaV), α‐amino‐3‐hydroxy‐5‐methyl‐4‐isoxazolepropionic acid (AMPA) receptors, and TRP channels have been reported and are known to mediate specific signaling events (Park et al, 2010; Wang et al, 2010; Gruszczynska‐Biegala et al, 2016; Shin et al, 2016).
Ca2+ and cAMP are the two fundamental secondary messengers that dictate variety of cellular processes. Interestingly, the two regulate one another at multiple levels downstream of various G‐coupled receptor signaling modules. Changes in bulk cytosolic Ca2+ are known to regulate cAMP levels through the different isoforms of adenylyl cyclases (ADCYs), which catalyze the conversion of ATP to cAMP (Cooper, 2015). cAMP primarily mediates its effects either by activating protein kinase A (PKA) or through phospholipase C (PLC) involving exchange protein directly activated by cAMP (EPAC) (Schmidt et al, 2001; Cooper, 2015). In a variation to this theme, a recent study proposed that the ER Ca2+ stores could directly regulate cAMP signaling (Lefkimmiatis et al, 2009). While this connects the two major signaling hubs, the molecular and physiological context leading to this crosstalk between ER Ca2+ and cAMP remains to be determined.
There are 10 different isoforms of ADCYs, and their expression varies among different cell types. Out of these, nine (ADCY1‐9) are plasma membrane‐bound whereas ADCY10 is soluble and is present in the cytosol (Halls & Cooper, 2017). Interestingly, ADCY1, 3, and 8 are activated by Ca2+, while ADCY5 and 6 are inhibited by Ca2+ (Cooper, 2015; Halls & Cooper, 2017). Recently, Orai1 was reported to regulate cAMP generation by physically interacting with ADCY8 resulting in its activation and thereby elevation of cAMP (Willoughby et al, 2012). However, the question whether STIM1 can physically interact and activate ADCYs, and the cellular context and consequence of this interplay have remained unanswered.
cAMP signaling is the central mediator of melanogenesis programming in melanocytes (D'Orazio & Fisher, 2011). Melanin produced within melanosomes is transferred to neighboring keratinocytes, which provides protection to the skin from UV‐induced cellular damage (Natarajan et al, 2014a). One of the major physiological determinants of pigmentation in humans is α‐melanocyte‐stimulating hormone (αMSH; Videira et al, 2013; Abdel‐Malek et al, 2014). αMSH binds to the G‐coupled receptor melanocortin‐1 receptor (MC1R) and activates melanogenesis via cAMP‐PKA‐microphthalmia transcription factor (MITF) signaling axis (Levy et al, 2006). MITF is the key transcription factor that regulates both pigmentation and melanocyte proliferation. A variety of signaling pathways converge on this master regulator of pigment cell biology for calibrating melanogenesis and melanocyte proliferation (Levy et al, 2006; Lin & Fisher, 2007; Hartman & Czyz, 2015). While the role of cAMP is well established in melanogenesis process, the significance of Ca2+ signaling in controlling melanogenesis remains poorly understood (Videira et al, 2013). Incidentally, depletion of internal Ca2+ stores is a common physiological outcome of hormone‐controlled intracellular signaling (Bootman, 2012). We therefore decided to carefully reexamine the signaling events downstream of αMSH, particularly from the perspective of ER Ca2+ stores and the cAMP signaling. Surprisingly, the role of SOCE components in the signaling events that lead to pigmentation remains poorly understood. An isolated study has implicated a role for Orai1 in endothelin‐1‐mediated melanogenesis (Stanisz et al, 2012). While STIM1 is expressed in melanocytes (Stanisz et al, 2016), its role in melanogenesis remains hitherto uncharacterized.
Here we demonstrate that Ca2+ concentration in ER can directly control cAMP production during αMSH‐induced pigmentation, independently of the changes in cytosolic Ca2+. αMSH induces ER Ca2+ release and activates STIM1 oligomerization at ER‐PM junctions. While the STIM1 and Orai1 activate SOCE, this influx of Ca2+ primarily governs proliferation and is not involved in pigmentation. STIM1 recruitment at PM activates ADCY6, increasing the cAMP levels and thus forming a novel positive feedback loop that sustains elevated cAMP levels required to signal the induction of pigmentation genes. We identify a critical role of STIM1 S/P‐rich domain in ADCY6 interaction and melanogenesis. Further, by studying STIM1 in zebrafish, we substantiate the significance of this protein in pigmentation biology. This elucidation of the physiological circumstances leading to the initiation of the cAMP production through ADCY6‐STIM1 interaction could provide new avenues for developing therapeutic strategies for treatment of malignant and pigmentary disorders.
Results
Transcriptome analysis identifies importance of Ca2+ signaling in melanogenesis
Melanogenesis is a complex process wherein melanin pigment is produced in melanosomes by melanocytes. While the classical pathway of αMSH‐cAMP‐PKA‐MITF is known to govern pigmentation and proliferation, a recent study suggested αMSH's role in activating PLCβ/PI(4,5)P2 pathway (Maresca et al, 2012) that is known to induce release of Ca2+ from ER stores. This suggested a distinct possibility of a crosstalk between cAMP and Ca2+ during melanocyte pigmentation. In order to get a broader understanding of the pathways involved in melanogenesis, we performed whole‐genome transcriptome profiling of human primary melanocyte. We compared between the melanocyte pigmentation inducer tyrosine and depigmenting agent phenylthiourea (PTU) (Fig 1A). RNA expression analysis revealed differential regulation for the expected melanogenic genes, and surprisingly, both the Ca2+ and cAMP signaling networks emerged among the key enriched pathways (Fig 1B). Although tyrosine and PTU act downstream in the melanogenesis pathway, perturbation of Ca2+ and cAMP pathways, probably through feedback signaling, suggested relevance of these modules in melanogenesis.
Figure 1. SOCE is enhanced with increase in pigmentation.
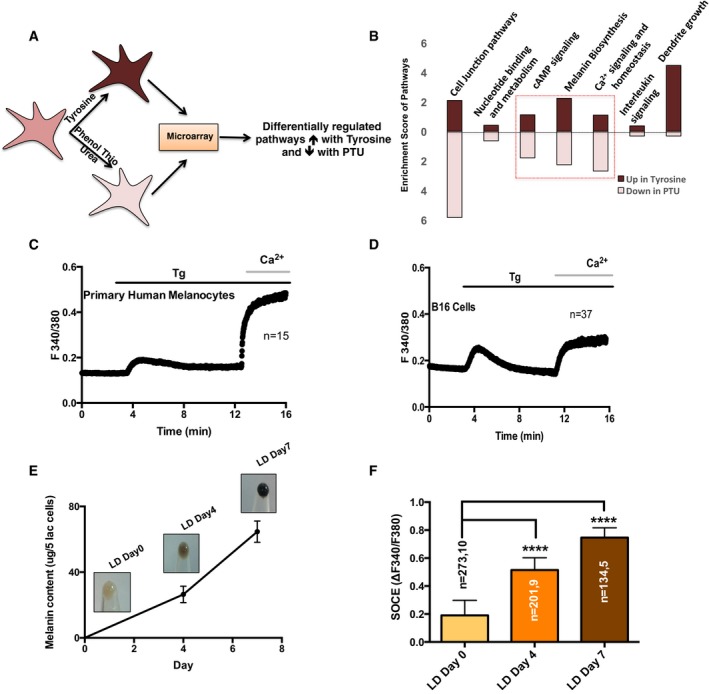
- Pictorial representation of the microarray performed on human primary melanocytes for identification of novel regulators of the pigmentation.
- Pathway enrichment plot for the differentially regulated signaling pathways upon tyrosine and PTU treatment.
- Representative Ca2+ imaging trace of Tg‐stimulated SOCE measurement in primary human melanocytes. Here, “n” denotes the number of cells in the trace.
- Representative Ca2+ imaging trace of Tg‐stimulated SOCE measurement in B16 cells. Here, “n” denotes the number of cells in the trace.
- B16 cell pellet pictures of LD day 0, LD day 4, and LD day 7 along with the analysis of melanin concentration in these cells. The error bars indicate SD (N = 3).
- SOCE was measured on different days of LD cultures, and data for amplitude of SOCE are presented in bar graphs.
While cAMP signaling is the central mediator of the melanogenesis programming, the relevance of Ca2+ signaling is not well established. Activation of SOCE at ER‐PM junction is one of the key components of cellular Ca2+ homeostasis. In order to understand the role of SOCE in mammalian melanogenesis, we examined SOCE in primary human melanocytes and in mouse B16F10 melanoma (B16) cells. We performed live‐cell ratiometric Ca2+ imaging using FURA2 dye that measures cytosolic Ca2+ levels and used classical pharmacological tool thapsigargin (Tg) for rapidly depleting ER Ca2+ levels. A typical Ca2+ imaging trace is shown in Fig 1C for primary melanocytes, where the first peak corresponds to the release of Ca2+ from ER stores. After reaching the steady‐state levels, addition of extracellular Ca2+ showed a sharp increase in the relative fluorescence intensity that corresponds to the Ca2+ entry into the cells. Similar trace could be obtained for the depigmented B16 cells (Fig 1D), although the amplitude of SOCE was much smaller for depigmented B16 cells.
To examine whether the Ca2+ entry through SOCE is modulated during the melanogenesis, we measured SOCE during the course of pigmentation. We had earlier developed a pigmentation oscillator model with B16 cells, wherein low‐density (LD) plating of non‐pigmented cells brings about synchronous pigmentation over a period of 7 days (Natarajan et al, 2014b). As measured by the melanin concentration assay, LD day 0 cells are non‐pigmented; day 4 cells show intermediate pigment levels while day 7 cells are highly pigmented (Fig 1E). This model is shown to recapitulate the pigmentation responses observed in primary melanocytes (Natarajan et al, 2014b). Overlay of the Ca2+ imaging traces showed dramatic change in the SOCE amplitude with more than twofold increase at day 4 and greater than threefold increase on day 7, in comparison with day 0 cells (Fig 1F). The correlation of SOCE amplitude with increased melanin content suggested a role of Ca2+ signaling in pigmentation biology. We therefore investigated whether the proteins involved in establishing SOCE are also regulated during melanogenesis.
STIM1 and Orai1 mediate melanocyte SOCE
STIM and Orai proteins are the primary mediators of SOCE. To identify the specific STIM and Orai homologs that mediate SOCE in B16 cells, we standardized siRNA silencing of STIM and Orai genes (STIM1, STIM2, Orai1, Orai2, and Orai3). The transfection of B16 cells with siRNAs showed significant decrease (60–70%) in the levels of respective target mRNA 72 h post‐transfection (Appendix Fig S1A). The measurement of Ca2+ fluxes and their comparative analysis showed no significant differences for ER Ca2+ release in any of the five knockdowns (Fig 2A and Appendix Fig S1B). However, a marked decrease was seen in the SOCE amplitude with siSTIM1 and siOrai1 (Fig 2A and B). To substantiate these findings, we generated lentiviral‐transduced shSTIM1 and shOrai1 B16 stable cell lines (Appendix Fig S2A). In both these lines, we obtained around 75% decrease in the respective mRNA levels (Appendix Fig S2B and C) and 55–60% reduction in their protein levels (Appendix Fig S2D and E). The Ca2+ imaging studies in the two stable lines showed no significant differences in the ER Ca2+ release (Appendix Fig S1C) and 50% reduction in the amplitude of SOCE in comparison with shControl B16 stable line (Fig 2C and D). This suggested that STIM1 and Orai1 mediate SOCE in melanocytes.
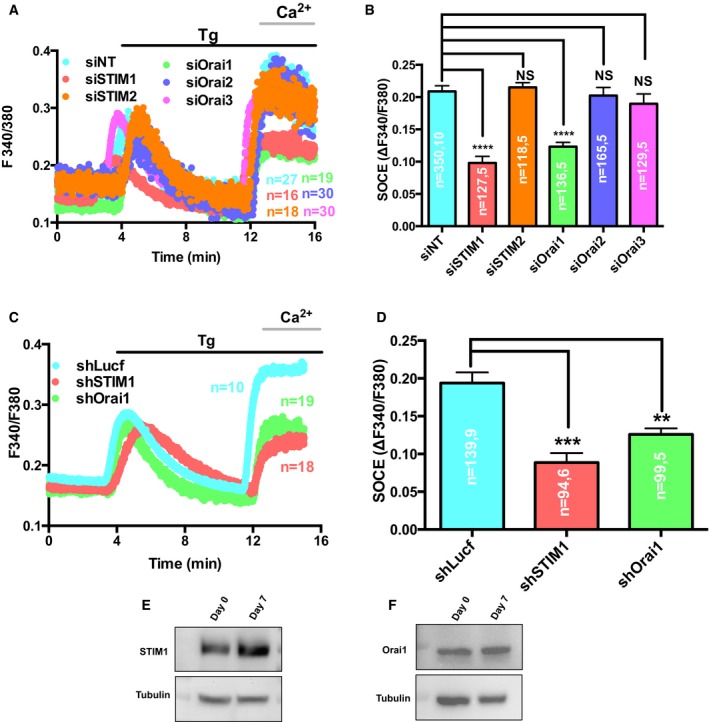
Figure 2. STIM1 and Orai1 mediate SOCE in melanocytes.
-
ARepresentative SOCE traces of all five STIM and Orai homologs' knockdowns and non‐targeting siRNA control where “n” denotes the number of cells in that particular trace.
-
BThe amplitude of SOCE was calculated from a number of experiments, and data are presented in bar graphs.
-
CRepresentative Ca2+ imaging trace of B16 stable cell lines; control shLuciferase, shSTIM1 and shOrai1 stables where “n” denotes the number of cells in that particular trace.
-
DThe amplitude of SOCE was calculated from a number of experiments, and data are presented in bar graphs.
-
E, FWestern blot analysis showing an increase in STIM1 protein expression on LD day 7 in comparison with day 0 whereas expression of Orai1 remained largely unchanged.
We then examined the expression levels of STIM1 and Orai1 during B16 LD pigmentation. About threefold increase in STIM1 protein expression on LD day 7 could be noted, as compared to the day 0 cells (Fig 2E). Orai1 levels however showed no significant difference (Fig 2F). This was somewhat surprising since the increased Ca2+ influx through SOCE would require formation of cognate STIM1‐Orai1 complexes. Since Ca2+ is ubiquitously known to play an important role in cellular proliferation, we therefore deliberated whether the observed SOCE increase in B16 pigmentation model is an outcome of increased proliferative rates.
STIM1 and Orai1 regulate melanocyte proliferation and melanoma growth
The central transcription factor of melanocyte MITF is known to regulate both cellular proliferation and pigmentation, and thus, two pathways could be subtly regulated through a common node. Cellular proliferation assays with STIM1 and Orai1 knockdown showed 25–30% reduction in proliferation of B16 cells at 48 and 72 h post‐transfection (Fig 3A). The knockdown of MITF resulted in 40% decrease in B16 proliferation. Orai2 and Orai3 silencing showed no significant changes, while STIM2 knockdown enhanced B16 proliferation by approximately 10% (Fig 3A). The proliferation effects for STIM1 and Orai1 were also studied in primary human melanocytes. Primary melanocytes are terminally differentiated and possess weak proliferative capabilities, and therefore, external stimuli of αMSH were used in this study. We achieved about 50% knockdown of STIM1 and Orai1 in primary melanocytes (Fig EV2A and B). Silencing of both STIM1 and Orai1 reduced αMSH‐induced melanocyte proliferation by 35–40% (Fig 3B). For corroborating the role of STIM1 and Orai1 in proliferation, we examined the growth of melanoma tumors after subcutaneous injections of shLuciferase control and shSTIM1 or shOrai1 B16 stable cell lines in C57Bl/6 mice. Interestingly, previous reports implicate STIM1 and Orai1 in melanoma metastasis (Sun et al, 2014; Hooper et al, 2016), but their role in melanoma growth remained largely uninvestigated. Post‐injections, we followed melanoma tumor development for 15 days by measuring tumor volume (on every alternate day). As shown in Fig 3C, knockdown of both STIM1 and Orai1 drastically reduced melanoma growth. Similarly, the mean melanoma weight at the end of study was also significantly reduced with both shSTIM1 and shOrai1 B16 stables (Fig 3D). Collectively, these studies suggest that STIM1 and Orai1 regulate melanocyte proliferation and melanoma development in vivo.
Figure 3. STIM1 regulates melanocyte proliferation and pigmentation while Orai1 only mediates proliferation.
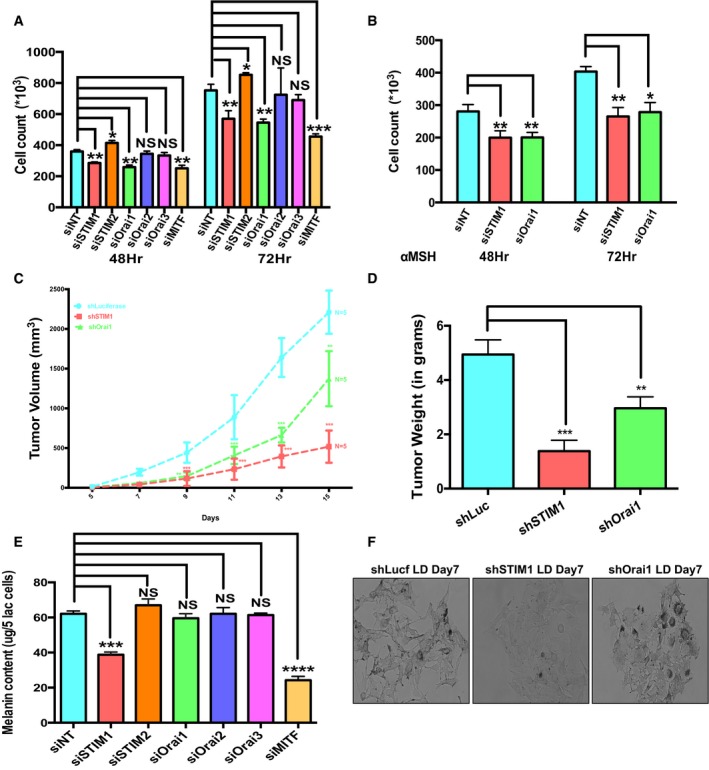
- B16 cell proliferation upon knockdown of STIM and Orai homologs 48 and 72 h post‐transfection with siRNAs (N = 3).
- αMSH‐stimulated primary human melanocyte proliferation post‐siRNAs transfections (N = 3).
- B16 melanoma tumor volumes upon subcutaneous injection of B16 stable cell lines in C57Bl/6 mice (five mice/group).
- Tumor weights in the experimental groups after sacrificing mice on the 15th day post‐tumor cell injection (N = 5).
- Melanin content assay performed on the siRNA‐transfected cells for quantifying the affect on LD pigmentation upon all five STIM and Orai homologs' silencing (N = 3).
- Representative bright‐field images of shLuciferase, shSTIM1, and shOrai1 B16 stable cells on LD day 7.
Figure EV2. STIM1 but not Orai1 regulates αMSH‐induced primary human melanocyte pigmentation.
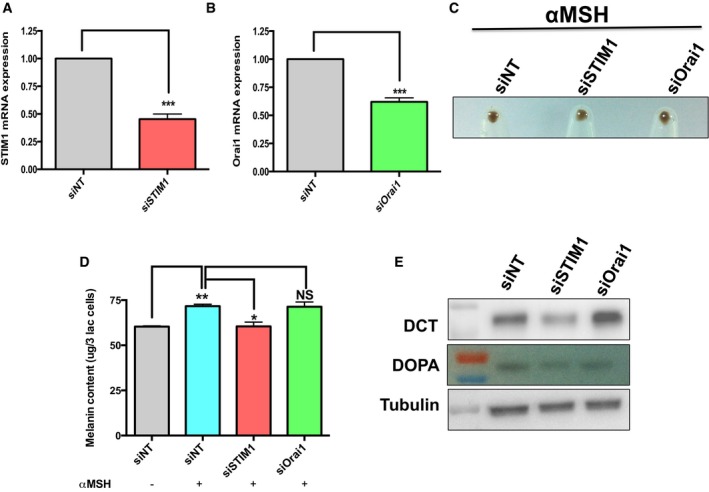
- qRT–PCR analysis of STIM1 48 h post‐transfection with STIM1 siRNA (N = 3).
- qRT–PCR analysis of Orai1 48 h post‐transfection with Orai1 siRNA (N = 3).
- Primary human melanocyte pellets showing the extent of αMSH‐driven pigmentation upon STIM1 or Orai1 silencing in comparison with siNT control.
- Melanin content analysis evaluating changes in αMSH‐induced pigmentation upon STIM1 and Orai1 silencing (N = 3).
- Western blots and gel images of tyrosinase activity (DOPA assay) in primary human melanocytes transfected with either control siRNA or STIM1/Orai1 siRNA.
STIM1 but not Orai channels mediate pigmentation
Having established STIM1 and Orai1 role in proliferation, we next examined their involvement in pigmentation process. The B16 LD pigmentation levels upon knockdown of STIM and Orai homologs were compared to the levels observed in case of non‐targeting control siRNA. The targeted siRNA screening suggested that STIM1 silencing decreases melanogenesis, while knockdown of STIM2 and all the three Orai homologs showed no difference in the levels of melanin formation (Fig 3E). STIM1 silencing resulted in ~35% decrease in melanin content on LD day 7 while Orai1 silencing did not affect melanogenesis (Figs 3E and EV1A and B). The control MITF knockdown resulted in 60% decrease in melanin levels (Figs 3E and EV1B). To provide confidence to the siRNA‐mediated knockdown specificity, we expressed human‐mCherry STIM1 in siSTIM1 cells. Western blot analysis showed expression of human‐mCherry STIM1 in these cells (Fig EV1C). The LD day 7 cells expressing human‐mCherry STIM1 along with siSTIM1 indeed showed melanin content comparable to control cells (Fig EV1C). Further, B16 LD pigmentation experiments with shSTIM1 and shOrai1 stable cells also showed a clear decrease in pigmentation level in the bright‐field images of LD day 7 cells with STIM1 knockdown. The Orai1 knockdown cells however showed comparable pigmentation to the control shRNA stable cells (Fig 3F). The GFP expression, used as control, showed similar lentiviral transduction efficiency for all the three conditions (Fig EV1D). Together, these studies provided an interesting perspective of Orai1‐independent role of STIM1 in melanogenesis. To further establish this novel finding, we carefully examined the role of STIM1 in primary melanocytes and also in the zebrafish model system.
Figure EV1. STIM1 but not Orai1 regulates melanogenesis.
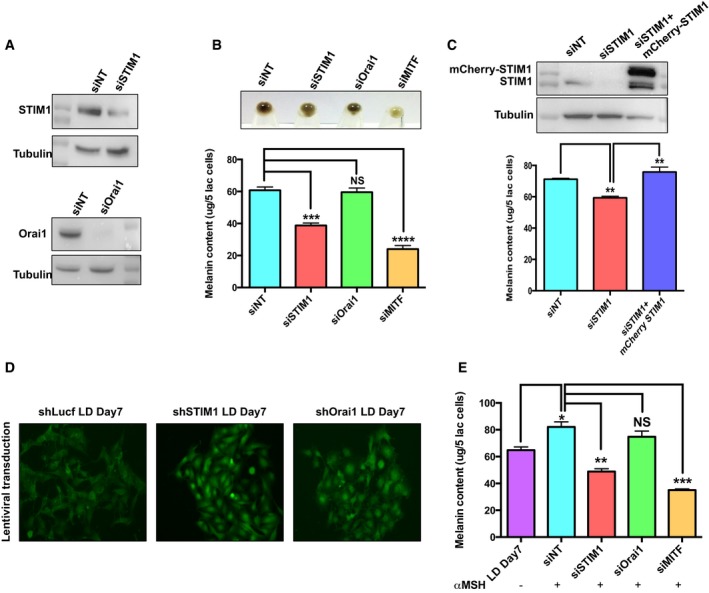
- Western blots demonstrating siRNA‐based knockdown of STIM1 and Orai1.
- Representative cell pellets of LD day 7 upon STIM1, Orai1, and MITF silencing along with melanin content analysis (N = 3).
- Western blot for examining mCherry‐STIM1 expression in B16 cells and melanin content analysis for evaluating rescue of pigmentation loss with mCherry‐STIM1 (N = 3).
- Lentiviral‐transduced B16 stable cell lines used for LD melanogenesis assay showing comparable transduction efficiency.
- Melanin content analysis in the unstimulated LD cells and upon αMSH stimulation in LD cells transfected with siNT, siSTIM1, siOrai1, or siMITF (N = 3).
αMSH‐induced pigmentation requires STIM1
Using the physiological stimuli αMSH, we monitored the significance of STIM1 and Orai1 in primary melanocytes and B16 pigmentation. We observed significant decrease in the αMSH‐induced melanin generation with STIM1 knockdown and not with Orai1 silencing in the primary human melanocytes (Fig EV2C and D). The analysis of key melanogenic enzymes in the primary melanocytes also substantiated these findings, wherein tyrosinase activity as well as the levels of dopachrome tautomerase (DCT) was substantially reduced upon STIM1 but not Orai1 silencing (Fig EV2E). Similar data for STIM1 and Orai1 knockdown could be noted in B16 LD cells with αMSH stimulation. While Orai knockdown shows similar melanin content to control cells, there was more than 40% decrease for STIM1 knockdown cells (Fig EV1E).
We then examined the role of STIM1 in regulating pigmentation in vivo by using zebrafish system. The melanogenesis program is broadly conserved across vertebrates and owing to translucency of zebrafish embryos; the pigmentation can be easily monitored visually and quantified with microscopic analysis (Kelsh et al, 1996). Zebrafish contains two STIM1 paralogs namely zSTIM1a and zSTIM1b, and we followed changes in pigmentation by using morpholino‐based knockdown strategy (Bill et al, 2009). Substantial reduction in the pigmented black‐colored melanophores (melanocyte equivalents in zebrafish) could be observed in zSTIM1a morphants in comparison with the control morphants at 36 hpf (hours post‐fertilization) (Fig 4A). This phenotype was observed in more than 70% embryos (Fig 4B). However, the zSTIM1b morpholino injections showed no perturbation in zebrafish pigment (Fig 4A and B). Since morpholinos are injected at single‐cell stage, the loss of pigmented melanophores in zSTIM1a morphants could be a consequence of the developmental arrest or reduced pigment synthesis. The precursor pigment cells, melanoblasts, can be monitored by the presence of MITF, while the melanophores can be studied by the expression of tyrosinase‐related protein 1 (TyRP1). We therefore generated mitfa:GFP and ftyrp1:GFP transgenic zebrafish lines and quantified the melanoblasts and melanophores at 32 hpf and at 48 hpf, respectively, using imaging FACS analysis (Fig 4C and D, and Appendix Fig S3). zSTIM1a knockdown showed similar number and localization of melanoblasts as well as the melanophores (Fig 4C and D, and Appendix Fig S3), indicating that zSTIM1a knockdown does not perturb the development and migration of melanophores during the early stages of embryo development. We therefore analyzed the expression levels of two key melanogenic enzymes tyrosinase and DCT by performing whole embryo in situ hybridization (WISH). We observed substantial reduction in the expression levels of both of them (Fig 4E and F) in zSTIM1a morphants in comparison with control morphants. It is important to note that just like mammals, αMSH plays a critical role in mediating zebrafish pigmentation as well (Logan et al, 2006; Selz et al, 2007). αMSH has been shown to regulate melanophore dispersion and patterning in zebrafish (Logan et al, 2006; Richardson et al, 2008).
Figure 4. STIM1 plays a critical role in pigmentation in vivo .
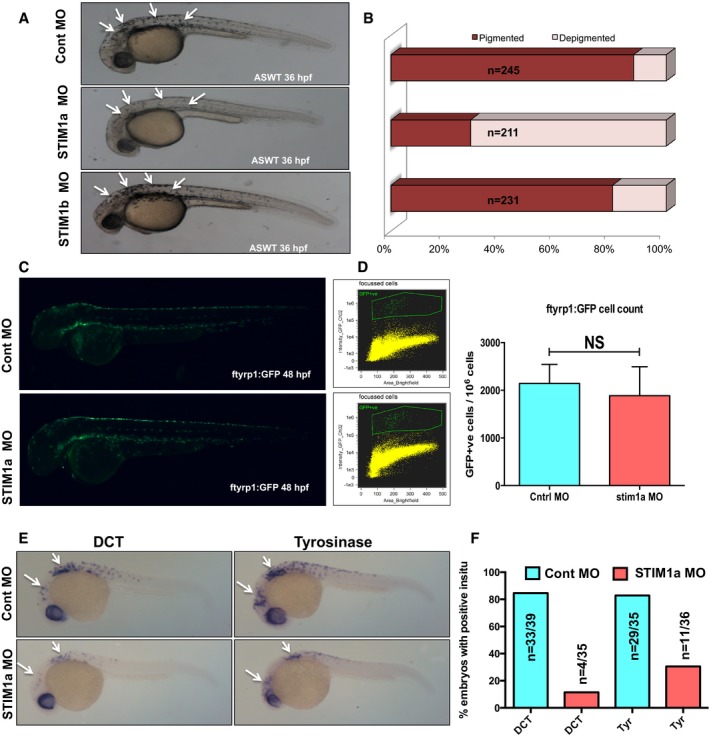
- Representative images of wild‐type zebrafish embryos injected with either control morpholino or morpholino targeting zebrafish STIM1a or zebrafish STIM1b. Arrows indicate zebrafish melanophores.
- The pigmentation phenotype analyzed in over 200‐zebrafish embryos/condition from three independent sets of injections and data are plotted in bar graphs.
- Images of ftyrp1:GFP transgenic zebrafish line injected with either control morpholino or STIM1a morpholino showing GFP‐positive differentiated melanophores at 48 hpf.
- Imaging FACS analysis showing the numbers of differentiated melanophores in control and STIM1a morphants (N = 3).
- Representative images of whole embryo in situ hybridization (WISH) for DCT and tyrosinase (tyr). Arrows points to WISH patterns in zebrafish embryos.
- Bar graphs with quantification of in situ data presented in panel (E).
Our cellular as well as physiological models thus establish that STIM1 plays a significant role in regulating the expression of melanogenic genes. The transcriptional regulation of melanogenic genes is primarily governed by MITF, which is in turn regulated by the cAMP levels. Since STIM1 is an ER Ca2+ sensor, we reasoned that the increased melanogenesis could be through ER Ca2+ release. Further, we questioned whether the cAMP and Ca2+ signaling pathways could crosstalk through the recruitment of STIM1 at the plasma membrane.
αMSH stimulates ER Ca2+ release through IP3 generation
We initially examined whether αMSH can mobilize cytosolic Ca2+ levels in melanocytes. Ca2+ imaging studies with primary melanocytes and B16 cells in the absence of extracellular Ca2+ indeed showed a transient rise in cytosolic Ca2+ levels upon αMSH treatment (Fig 5A and B). This increase in cytosolic Ca2+ levels is due to the release of intracellular stores. To examine whether the source of intracellular Ca2+ release was ER, we included Tg in these assays. Addition of αMSH after the Tg‐induced ER Ca2+ store depletion showed no further elevation in cytosolic Ca2+ (Fig 5C). Since IP3 receptors are primarily involved in ER Ca2+ release, the αMSH‐triggered ER Ca2+ release is likely to involve changes in IP3 levels. We performed competitive ELISAs to measure IP3 levels upon αMSH treatment. Time‐course studies over 20 min showed accumulation of IP3 within 2 min and the levels peak at 5 min post‐treatment (Fig 5D). The IP3 generation classically involves PLC activation through Gq receptor activation; however, in certain instances, Gs receptors are known to activate inositol pathway indirectly through PLC activation either via PKA (Luo et al, 1999) or through EPAC (Schmidt et al, 2001). In any case, PLC activation is required for IP3 generation. Therefore, we performed αMSH‐induced ER Ca2+ release experiments after pre‐incubation of cells with either PLC inhibitor U73122 or its inactive analog U73343. As presented in Fig 5E, we observed almost complete abrogation of ER Ca2+ release upon treatment with U73122 while its inactive analog did not affect Ca2+ release, suggesting that indeed, αMSH stimulates PLC activation. Both PKA and EPAC are activated by cAMP, and since αMSH in melanocytes is known to specifically activate Gs receptors (MC1R), the PLC activation is probably governed through cAMP‐mediated activation of PKA and/or EPAC. Indeed, the addition of forskolin, ADCY activator that increases cellular cAMP levels, is sufficient to induce increase in cytosolic calcium through ER Ca2+ mobilization (Fig 5F). Further, inhibition of ADCYs with generic inhibitor SQ22536 resulted in significant decrease in the αMSH‐induced ER Ca2+ release (Fig 5E and Appendix Fig S4). Collectively, these experiments suggest that αMSH‐induced rise in cAMP activates IP3 generation, thereby stimulating ER Ca2+ release in melanocytes.
Figure 5. αMSH mobilizes ER calcium.
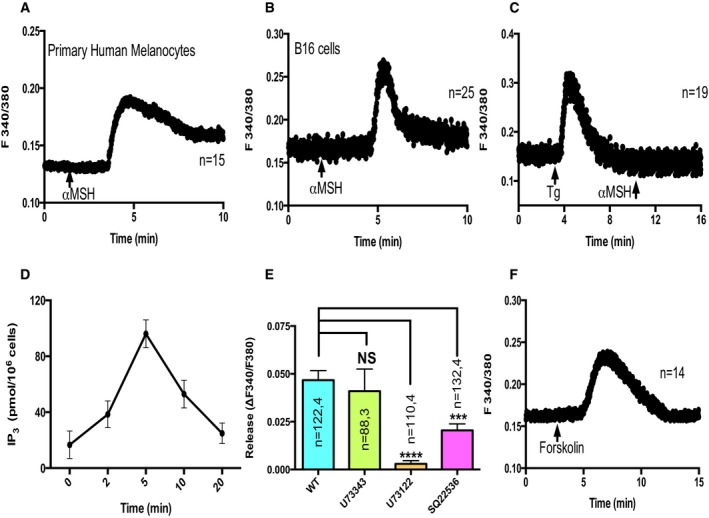
- In the absence of extracellular Ca2+, 5 μM αMSH treatment leads to rise in cytosolic Ca2+ levels in primary human melanocytes. Here, “n” corresponds to the number of cells imaged.
- In the absence of extracellular Ca2+, αMSH induces increase in cytosolic Ca2+ in B16 cells.
- αMSH is not able to induce cytosolic Ca2+ rise after ER Ca2+ store depletion with 2 μM Tg.
- Time‐course competitive ELISAs for estimating IP3 generation upon αMSH application (N = 3). Error bars indicate SD.
- Amplitude of αMSH‐induced ER Ca2+ release upon pre‐treatment of cells with PLC inhibitor, PLC inhibitor's inactive analog, and ADCY inhibitor.
- Forskolin induces rise in cytosolic Ca2+ in B16 cells in the absence of extracellular Ca2+.
STIM1 oligomerization mediates Ca2+‐cAMP crosstalk and regulates melanogenesis
ER Ca2+ release has been earlier shown to stimulate STIM1 oligomerization, and we therefore examined whether αMSH can induce STIM1 oligomerization and its recruitment at the ER‐PM junctions (sub‐plasmalemmal regions). For studying this, we expressed eYFP‐STIM1 in B16 cells and stimulated these cells with αMSH. Live‐cell confocal microscopy revealed that αMSH could stimulate STIM1 oligomerization and translocation to the sub‐plasmalemmal regions within 4–5 min of treatment (Movie EV1). The representative images in Fig 6A show a cell expressing eYFP‐STIM1 at resting state and post‐αMSH treatment. Clearly, upon αMSH stimulus, STIM1 puncta are observed at the cell periphery. We next quantified the intensity of STIM1 puncta by selecting ROIs in proximity of plasma membrane. The STIM1 puncta intensities measured in 40 cells at the resting state, and post‐αMSH stimulation showed a twofold increase upon αMSH addition (Fig 6B).
Figure 6. STIM1 oligomerization regulates pigmentation and cAMP generation.
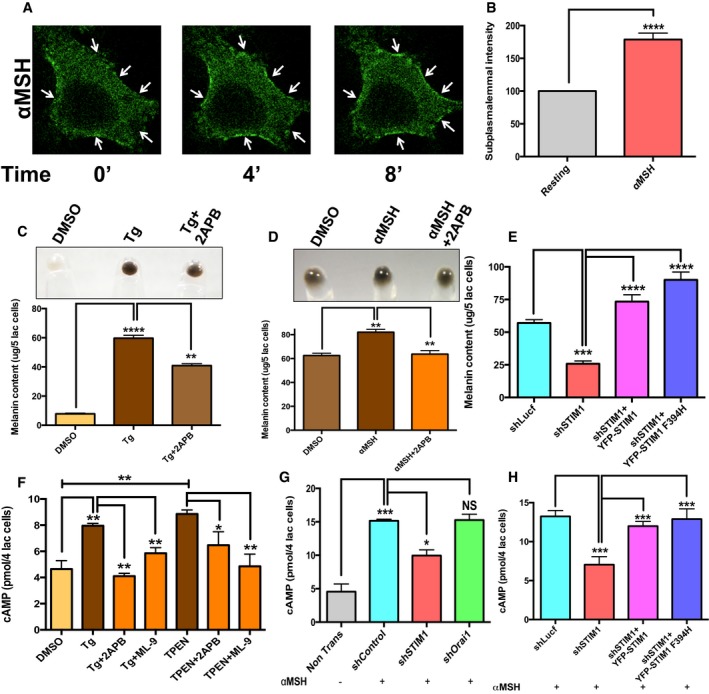
- αMSH treatment induces sub‐plasmalemmal STIM1 oligomerization in B16 cells (please also refer to Movie EV1). Arrows point to sub‐plasmalemmal STIM1 puncta.
- Sub‐plasmalemmal intensity of STIM1 puncta measured in the same cell at resting state and upon αMSH stimulation (n = 40 cells).
- Cell pellets and melanin content analysis upon Tg treatment in B16 LD cultures and co‐treatment with 50 μM 2APB (N = 3).
- Cell pellets and melanin content analysis upon treatment with either vehicle control DMSO or αMSH alone or αMSH along with 2APB (N = 3).
- Melanin content analysis in the LD assay upon STIM1 silencing and its rescue with YFP‐hSTIM1 and SOAR mutant YFP‐hSTIM1 F394H (N = 6).
- ELISA‐based cAMP measurements upon Tg or TPEN treatment and upon co‐application of either 2APB or ML‐9 (N = 2).
- αMSH‐induced cAMP generation upon either STIM1 silencing or Orai1 knockdown in comparison with shLuciferase control (N = 2).
- cAMP generation upon STIM1 silencing and its rescue with YFP‐hSTIM1 and SOAR mutant YFP‐hSTIM1 F394H (N = 4).
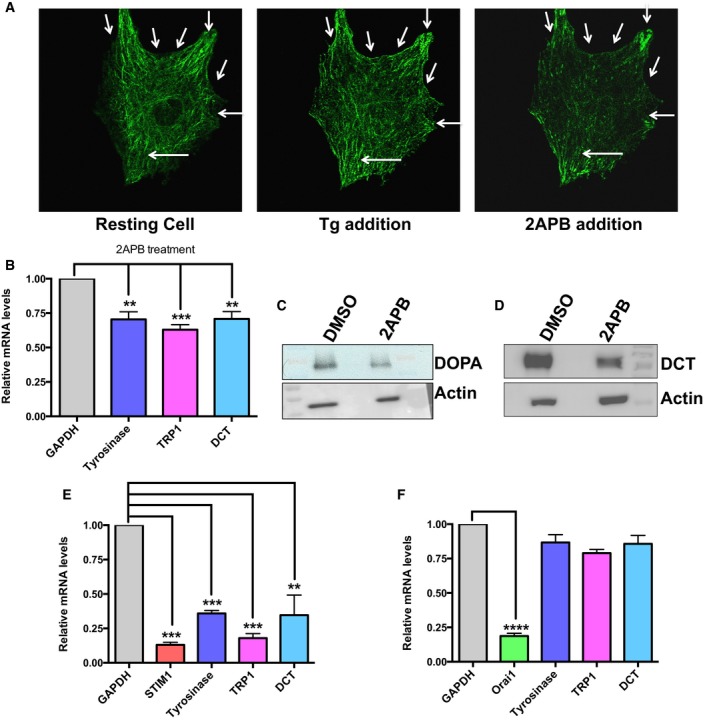
We next probed the requirement of STIM1 oligomerization in melanogenesis by using pharmacological modulators. While Tg is a known inducer of STIM1 oligomerization, 2‐aminoethoxydiphenyl borate (2APB) can disrupt these oligomers (DeHaven et al, 2008). The STIM1 was monitored by live‐cell confocal microscopy using eYFP‐STIM1. Under resting conditions, cells show uniform expression of STIM1 (Fig EV3A). Tg addition activates STIM1 oligomerization (sub‐plasmalemmal puncta) while subsequent addition of 2APB to the cell rapidly disintegrates protein oligomers (Fig EV3A). Interestingly, addition of 100 nM Tg for 16 h was able to induce melanogenesis in B16 cells cultured in low density and co‐treatment with 50 μM 2APB significantly inhibited Tg‐activated melanogenesis (Fig 6C). The same effect could be observed for αMSH stimulation, wherein 2APB treatment substantially abrogated pigmentation (Fig 6D). These phenotypic changes were subsequently confirmed by studying expression of melanogenic genes both upon pharmacological inhibition of STIM1 oligomerization and STIM1 silencing. In comparison with vehicle control, 2APB treatment significantly reduced the mRNA expression of tyrosinase, TyRP1, and DCT (Fig EV3B). This was also substantiated by examining tyrosinase activity and DCT protein expression levels. Indeed, 2APB treatment decreases both the tyrosinase activity and DCT expression levels (Fig EV3C and D). Similarly, the transcript level analysis of the key pigmentation genes showed that STIM1 but not Orai1 knockdown significantly decreases their expression (Fig EV3E and F). Further, for validating Orai‐independent role of STIM1 in melanogenesis, we performed experiments with STIM1 SOAR mutant (STIM1 F394H). As reported earlier, this STIM1 mutant oligomerizes normally, but it is not able to activate Orai1 (Wang et al, 2014). We performed complementation studies with either wild‐type STIM1 or STIM1 F394H in shSTIM1 stable B16 cells for evaluating their ability to rescue the decrease in pigmentation observed upon STIM1 knockdown. As shown in Fig 6E, both wild‐type STIM1 and STIM1 F394H were able to rescue the loss in melanogenesis. All these data collectively reveal an intriguing Orai‐independent role of STIM1 oligomerization in pigmentation and its implication in the key melanogenic gene expression.
Figure EV3. STIM1 oligomerization regulates expression of key melanogenic genes.
-
AConfocal images of B16 cells transfected with eYFP‐STIM1 showing that Tg activates STIM1 oligomerization and 2APB disrupts STIM1 puncta. Arrows point to oligomeric STIM1 punta.
-
BqRT–PCR data demonstrating that 2APB application for 48 h reduces mRNA expression of tyrosinase, TyRP1, and DCT (N = 3).
-
C, DGel images of tyrosinase activity and Western blots for DCT on LD day 7 treated with either vehicle control (DMSO) or 2‐APB.
-
EqRT–PCR analysis showing that STIM1 silencing not only decreases mRNA expression of STIM1 but also that of tyrosinase, TyRP1, and DCT (N = 3).
-
FqRT–PCR analysis showing that Orai1 knockdown decreases Orai1 mRNA levels, but expression of melanogenic genes remains largely unaffected (N = 3).
We then attempted to answer how STIM1 regulates expression of pigmentation genes tyrosinase, TyRP1, and DCT. In melanocytes, these genes are transcriptionally under control of MITF which is activated downstream of cAMP (Levy et al, 2006; Videira et al, 2013). Our microarray data suggest that along with melanogenesis and Ca2+ signaling pathways, cAMP signaling cascade is also highly enriched in response to changes in pigmentation. Further, a recent study suggested an Orai1‐independent role of STIM1 in cAMP generation (Lefkimmiatis et al, 2009). We therefore investigated whether STIM1 is involved in regulating cAMP synthesis by activating ADCYs in melanocytes. We performed competitive ELISAs to evaluate the changes in the cellular cAMP levels induced upon activation and disruption of STIM1 oligomerization. The application of pharmacological modulators extensively used for inducing STIM1 oligomerization, that is, Tg and TPEN (a Ca2+ chelator that chelates both ER and cytosolic Ca2+) resulted in ~2‐fold increase in cellular cAMP levels (Fig 6F). This increase in cAMP levels was almost completely abolished upon co‐treatment with STIM1 oligomerization inhibitors 2APB and ML‐9 (DeHaven et al, 2008; Smyth et al, 2008; Lefkimmiatis et al, 2009; Fig 6F). Similar increase in cAMP levels could also be measured upon addition of αMSH to B16 cells. These increased cellular cAMP levels are reduced by 50% in shSTIM1 B16 stables (Fig 6G), while the cells transfected with shOrai1 showed cAMP levels comparable to control shRNA condition (Fig 6G). Additionally, for corroborating Orai1‐independent role of STIM1 in αMSH‐induced cAMP generation, we performed rescue experiments with either wild‐type STIM1 or STIM1 F394H. Both wild‐type STIM1 and STIM1 F394H were able to enhance cAMP generation in shSTIM stable cells (Fig 6H). Our studies thus demonstrate a crucial, Orai1‐independent, role of STIM1 at the ER‐PM junctions in facilitating pigmentation by increasing the levels of cAMP.
STIM1 interacts with ADCY6 for driving pigmentation
Since cAMP is produced by ADCYs, we investigated whether STIM1 could stimulate a specific ADCY at the ER‐PM junctions. There are 10 isoforms of ADCYs, and our microarray data suggest that all of them are expressed in B16. We therefore performed targeted siRNA screens against all 10 isoforms of ADCYs. The silencing of ADCY isoforms was confirmed by qRT–PCRs. We observed around 50–60% reduction in the target mRNA levels with these siRNAs (Appendix Fig S5). The siRNA screening of ADCYs in the LD melanogenic assay gave four hits of ADCY4, ADCY6, ADCY7, and ADCY9 wherein silencing of these ADCYs decreased melanogenesis by 30–35% (Fig 7A). Similar screen in the αMSH‐activated pigmentation showed that knockdown of three ADCYs—ADCY5, ADCY6, and ADCY9—decreases pigmentation (Fig 7A). These ADCYs could be regulating pigmentation either through mechanisms involving STIM1 or independent of STIM1. Therefore, we tested these ADCYs for their contribution to αMSH‐stimulated Ca2+ release and interaction with STIM1. We evaluated the extent of ER Ca2+ release upon αMSH application in the B16 cells transfected with siRNA against ADCY5, ADCY6, ADCY9 or siControl. We also included cells transfected with siRNA targeting ADCY8 in this assay as an additional control as ADCY8 is shown to be directly activated by Orai1 in other systems (Willoughby et al, 2012). As presented in Fig 7B, we observed a significant decrease in αMSH‐induced Ca2+ release only in the case of cells transfected with siADCY5 and siADCY6, suggesting that these ADCYs connect MC1R activation to ER Ca2+ release in melanocytes. We next examined whether STIM1 physically interacts with one or multiple of these ADCYs for mediating cAMP‐regulated pigmentation. We expressed mCherry‐hSTIM1 in B16 cells and performed immunoprecipitation with mCherry antibody. Interestingly, we observed that only ADCY6 physically interacts with STIM1 upon Tg‐induced STIM1 oligomerization (Fig 7C and Appendix Fig S6). We further performed reverse co‐IPs, wherein we immunoprecipitated ADCY6 and performed blotting for STIM1. In these set of experiments as well, we observed that ADCY6 physically interacts with STIM1 after Tg treatment but not under resting conditions (Fig 7D). Our attempts to co‐immunoprecipitate STIM1 with ADCY4, 5, 7, and 9 suggested that these ADCYs do not interact with STIM1 in our model system (Appendix Fig S6). For further corroborating STIM1 interaction with ADCY6, we studied STIM1 and ADCY6 communication by performing acceptor bleaching (AB) fluorescence resonance energy transfer (FRET) studies. AB FRET is widely used for studying protein–protein interactions (Llopis et al, 2000; Sroka et al, 2016). We expressed STIM1‐YFP and ADCY6‐CFP in B16 cells and evaluated FRET efficiency 4 min post‐treatment with either Tg or DMSO control. AB FRET calculates the FRET efficiency before the acceptor bleaching, and therefore, we performed bleaching post‐treatment with Tg or DMSO. As presented in Fig 7E, we observed that substantial FRET efficiency was observed only upon Tg treatment and not in case of vehicle control implying dynamic nature of this interaction. Taken together, these studies identify ADCY6 as a novel interacting partner for STIM1, and this interaction regulates cAMP generation that leads to enhanced melanogenesis.
Figure 7. STIM1 physically interacts with ADCY6.
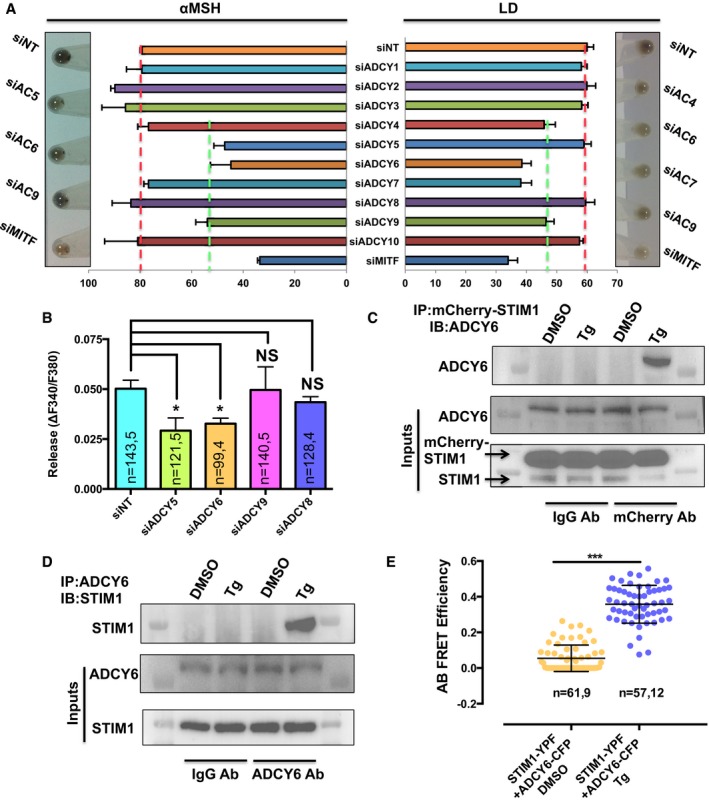
- Melanin content analysis upon silencing of ADCYs in αMSH‐induced pigmentation and in LD melanogenesis assay and cell pellet pictures of the ADCY hits (N = 2).
- The amplitude of αMSH‐induced Ca2+ release upon silencing of ADCY hits from αMSH screening along with an additional control of siADCY8.
- Blotting for ADCY6 upon immunoprecipitation of mCherry‐STIM1 with mCherry antibody demonstrating that STIM1 interacts with ADCY6 upon ER Ca2+ depletion.
- Blot showing reverse co‐IP wherein immunoprecipitation of ADCY6 was performed and subsequent blotting with STIM1 antibody.
- Scatter plots of AB FRET efficiencies demonstrate STIM1‐YFP and ADCY6‐CFP interact post‐ER Ca2+ depletion. Here, “n = x, y” represents x = number of ROIs and y = number of cells.
Next we asked the question whether just the ectopic expression of ADCY6 with constitutively active STIM1 (STIM1 D76A) is enough to induce pigmentation. We started by evaluating the affect of expressing STIM1 D76A or corresponding wild‐type STIM1 control on αMSH‐induced Ca2+ release. As presented in Fig EV4A, no significant differences were observed in the αMSH‐induced Ca2+ release upon overexpression of either wild‐type STIM1 or STIM1 D76A. We then examined the ability of STIM1 D76A and wild‐type STIM1 in rescuing the decrease in cAMP generation and LD melanogenesis observed upon STIM1 silencing. As expected, both STIM1 D76A and wild‐type STIM1 were able to restore cAMP levels and pigmentation (Fig EV4B and C). After characterizing the role of STIM1 D76A in the LD pigmentation model, we investigated whether its overexpression is enough to induce melanogenesis in non‐pigmented high‐density (HD) B16 cultures. The ectopic expression of STIM1 D76A alone or along with ADCY6 is not able to induce pigmentation in these cells. We next examined the affect of STIM1 D76A and ADCY6 overexpression on αMSH‐stimulated pigmentation. Interestingly, STIM1 D76A alone is not able to enhance the αMSH‐induced pigmentation; however, ADCY6 alone increases it significantly, suggesting that ADCY6 could be the limiting factor in these cells. Further, STIM1 D76A along with ADCY6 enhances αMSH‐stimulated pigmentation by almost threefold. We therefore observe that the constitutively active STIM1 is able to rescue the STIM1 knockdown effects, but it cannot constitutively activate pigmentation by itself. However, simultaneous expression of ADCY6 with constitutively active STIM1 remarkably increases αMSH‐induced pigmentation.
Figure EV4. Constitutively active STIM1 rescues cAMP generation and melanogenesis.
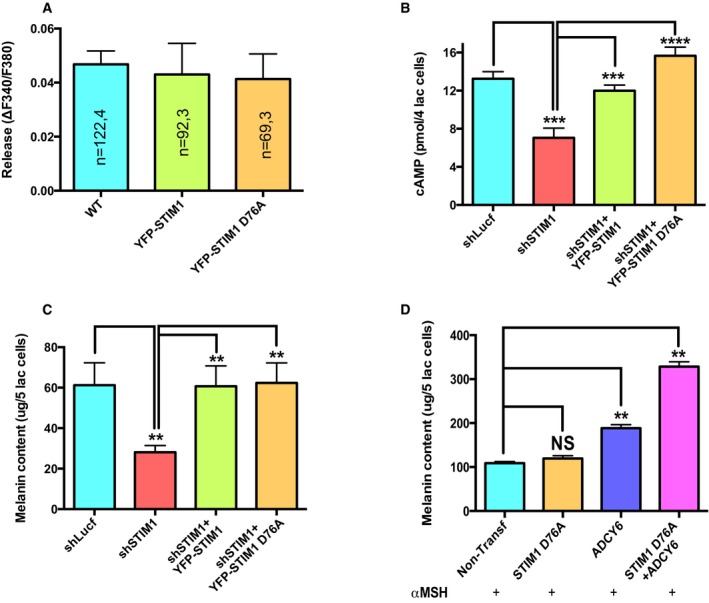
- Amplitude of αMSH‐induced Ca2+ release in WT cells and in cells overexpressing either wild‐type STIM1 (YFP‐STIM) or constitutively active STIM1 YFP‐STIM1 D76A.
- αMSH‐stimulated cAMP generation upon STIM1 silencing and its rescue with YFP‐STIM or YFP‐STIM1 D76A (N = 4).
- LD day 7 melanin content analysis in the B16 shSTIM1 stables and rescue with YFP‐STIM or YFP‐STIM1 D76A (N = 6).
- Melanin content analysis of B16 cells stimulated with αMSH in non‐transfected control cells and in cells overexpressing either YFP‐STIM1 D76A, ADCY6‐CFP, or YFP‐STIM1 D76A along with ADCY6‐CFP (N = 2).
STIM1 C‐terminus S/P‐rich domain regulates pigmentation
For identifying the specific STIM1 domain involved in regulating pigmentation, we employed hSTIM1 C‐terminus truncations (Fig 8A). These truncations were characterized earlier (Derler et al, 2009), and we expressed them in shSTIM1 stable B16 cells for evaluating their ability to rescue the decrease in pigmentation observed due to STIM1 silencing. The full‐length eYFP‐STIM1 (STIM1FL) was able to rescue the decrease in pigmentation, but STIM1 C‐terminus truncations (STIM11–535, STIM11–485, STIM11–474, and STIM11–450) were not able to rescue the fall in pigmentation observed with STIM1 knockdown (Fig 8B). The longest of these truncations, STIM11–535 is deficient of polylysine (K)‐ and serine/proline‐rich (S/P) domain, which suggested that most likely poly‐K‐ and/or S/P‐rich domain contributes to melanogenesis. For determining the primary STIM1 domain regulating pigmentation and ADCY6 interaction, we performed complementation studies with two zebrafish STIM1 paralogs.
Figure 8. STIM1 C‐terminus S/P‐rich domain regulates STIM1 interaction with ADCY6.
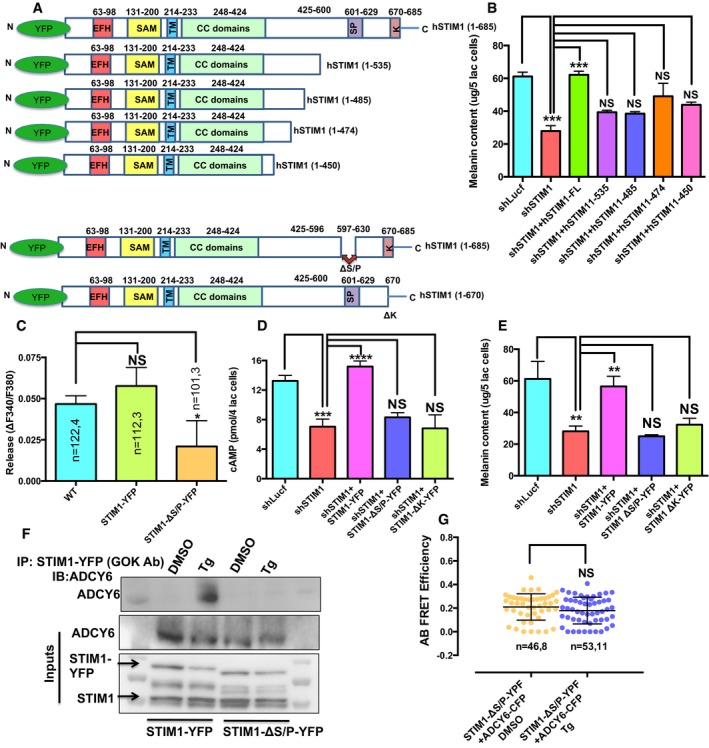
- The cartoon representing the different hSTIM1 truncations employed in the study.
- Melanin content analysis in the LD melanogenesis assay performed with B16 shSTIM1 stables and STIM1 rescue with hSTIM1FL, STIM11–535, STIM11–485, STIM11–474, or STIM11–450 (N = 3).
- Amplitude of αMSH‐induced ER Ca2+ release in WT B16 cells and cell overexpression either STIM1‐YFP or STIM1 ΔS/P‐YFP.
- αMSH‐stimulated cAMP generation upon STIM1 silencing and its rescue with STIM1‐YFP, STIM1 ΔS/P‐YFP, or STIM1 ΔK‐YFP (N = 4).
- LD day 7 melanin content analysis in the B16 shSTIM1 stables and STIM1 rescue with STIM1‐YFP, STIM1 ΔS/P‐YFP, or STIM1 ΔK‐YFP (N = 6).
- Co‐IP blots showing that full‐length STIM1, but not STIM1 ?S/P, interacts with ADCY6 after ER Ca2+ depletion.
- Scatter plots of AB FRET efficiencies between STIM1 ΔS/P‐YFP and ADCY6‐CFP. Here, “n = x, y” represents x = number of ROIs and y = number of cells.
An interesting observation from the zebrafish experiments was that the depigmented phenotype was only observed in zSTIM1a morphants but not in zSTIM1b morphants. The sequence analysis of zSTIM1a and zSTIM1b proteins with that of human STIM1 (hSTIM1) and mice STIM1 (mSTIM1) showed that the C‐terminal domains of STIM1 involved in Orai activation, that is, SOAR (STIM1 Orai activating region) or CAD (CRAC activation domain; Park et al, 2009; Yuan et al, 2009) as well as fast Orai inactivation, that is, CMD (CRAC modulatory domain; Derler et al, 2009) are conserved in both zSTIM1a and zSTIM1b. We then carefully examined the differences in the poly‐K‐ and S/P‐rich domains of zSTIM1a and zSTIM1b in comparison with hSTIM1 and mSTIM1 sequence. The poly‐K domain is fairly well conserved across hSTIM1, mSTIM1, zSTIM1a, and zSTIM1b, suggesting that most likely it is not contributing to STIM1‐ADCY6 interaction. Interestingly, we observed 8‐amino acid deletion in S/P region of zSTIM1b that is conserved across zSTIM1a, hSTIM1, and mSTIM1 (Fig EV5A). We therefore started investigating the specific contribution of the C‐terminal S/P‐rich region to pigmentation and STIM1‐ADCY6 interaction by cloning zSTIM1a and zSTIM1b in mCherry construct. We performed rescue experiments in shSTIM1 stable B16 cells with either mCherry‐zSTIM1a or mCherry‐zSTIM1b in the LD pigmentation model. We observed that while zSTIM1a was able to almost completely recover the decrease in pigmentation seen with shSTIM1, zSTIM1b was not able to rescue the loss in pigmentation, suggesting that C‐terminus S/P‐rich domain plays an important role in STIM1‐regulated pigmentation (Fig EV5B). To ensure that the zSTIM1b protein was expressed and functionally active in B16 cells, we examined whether this protein is functional in the context of SOCE activation. The ectopic expression of zSTIM1b in B16 cells resulted in around 60% increase in SOCE in comparison with empty mCherry vector (Fig EV5C–E), suggesting that indeed, zSTIM1b was functionally able to couple with Orai1. These data implicate an important role for STIM1 S/P‐rich domain in regulating pigmentation and ADCY6 interaction. We further corroborated the importance of STIM1 S/P domain by performing several studies with hSTIM1 ΔS/P construct (Ritchie et al, 2012). As presented in Fig 8C, the overexpression of STIM1 ΔS/P results in significant decrease in the αMSH‐induced ER Ca2+ release. We next examined the ability of STIM1 ΔS/P in rescuing the decrease in cAMP generation and LD pigmentation observed in the shSTIM1 stable cells. We observed that the STIM1 ΔS/P complementation is not able to restore the loss in cAMP generation and pigmentation; however, corresponding full‐length STIM1 is able to rescue them (Fig 8D and E). We next performed co‐IPs and FRET studies for investigating role of STIM1 S/P domain in ADCY6 interaction. As presented in Fig 8F and G, STIM1 ΔS/P does not interact with ADCY6. Collectively, these studies implicate a critical role of STIM1 S/P domain in ADCY6 interaction and pigmentation.
Figure EV5. STIM1 C‐terminus S/P‐rich domain regulates STIM1‐mediated melanogenesis.
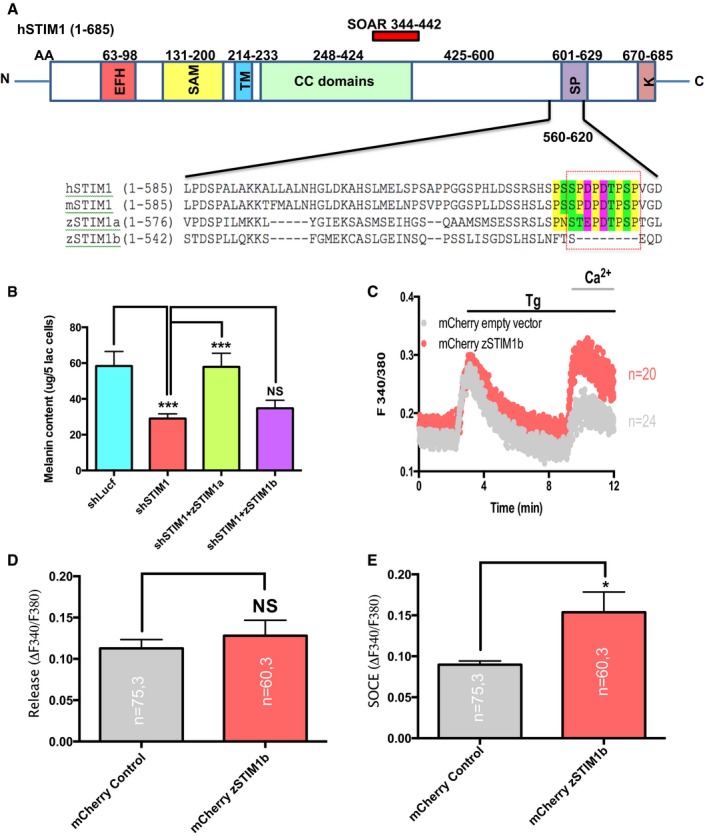
- Domain architecture of hSTIM1 and the protein sequence analysis of C‐terminus of hSTIM1, mSTIM1, zSTIM1a, and zSTIM1b.
- Melanin content analysis in B16 shSTIM1 stables and its rescue with zSTIM1a and zSTIM1b (N = 5).
- Representative SOCE traces of B16 cells expressing either empty mCherry vector or mCherry‐zSTIM1b plasmid.
- The quantitative analysis of ER Ca2+ release in vector control and zSTIM1b‐expressing cells.
- The analysis of SOCE amplitude upon ectopic expression of zSTIM1b.
Our data suggest that STIM1 travels to ER‐PM junctions and interacts with ADCY6. For further substantiating the role of STIM1 movement toward these junctions in pigmentation, we employed STIM1 ΔK mutant that does not target to ER‐PM junctions (Liou et al, 2007; Calloway et al, 2011; Maleth et al, 2014). As expected, the rescue experiments performed with STIM1 ΔK mutant demonstrate that it does not restore the decline in cAMP generation and pigmentation observed in shSTIM1 stables (Fig 8D and E). Taken together, we demonstrate that upon αMSH stimuli, STIM1 oligomerize and move toward ER‐PM junctions. At these sites, STIM1 interacts with ADCY6 through its S/P domain for enhancing cAMP generation and pigmentation.
Discussion
cAMP and Ca2+ are the principle intracellular signaling mediators that govern array of physiological processes. Not surprisingly, these two second messenger pathways crosstalk at multiple levels to fine‐tune the functional outcomes. In this study, we elucidate one such regulatory cascade wherein depletion of ER Ca2+ results in the direct activation of cAMP generation during the process of melanogenesis. The existence of such a pathway was proposed earlier (Lefkimmiatis et al, 2009), but the molecular players involved and physiological contexts underlying its initiation have thus far remained elusive. We show that the melanogenic stimuli αMSH, which is secreted by keratinocytes upon UV exposure, establish a positive feedback loop connecting cAMP and Ca2+ signaling pathways. This signaling cascade requires STIM1 translocation to the ER‐PM junctions to selectively activate ADCY6 in melanocytes.
The physiological stimuli αMSH regulates melanogenesis through Gs receptor MC1R by activating cAMP‐PKA‐MITF signaling axis (Levy et al, 2006; Videira et al, 2013; Abdel‐Malek et al, 2014). In a recent study, UV radiations were shown to induce ER Ca2+ release through Gq retinal receptor resulting in higher pigmentation levels (Bellono et al, 2014). Our studies identify an intriguing regulatory node, wherein the αMSH‐Gs receptor activation mobilizes the ER Ca2+ release through PLC activation and downstream IP3 signaling (Fig 5). Our studies with ADCY inhibitor and siRNA targeting ADCYs suggest that cAMP generation plays an important role in this signaling cascade. This regulation is most likely achieved through cAMP‐mediated activation of PKA and/or EPAC. Interestingly, literature suggests that PKA and EPAC can induce IP3 generation by activating PLCβ (Luo et al, 1999) and PLCε (Schmidt et al, 2001), respectively. However, at this stage we cannot completely rule out the possibility of activation of a Gq receptor by αMSH in melanocytes. Interestingly, αMSH was recently reported to activate an orphan G‐coupled receptor, GPR139. Upon overexpression in CHO cells, this orphan receptor was demonstrated to behave like a Gq receptor (Nøhr et al, 2017). It is important to note that αMSH was reported to be 100‐fold less potent agonist of GPR139 in comparison with MC4R, a Gs receptor (Nøhr et al, 2017). The expression of GPR139 is limited to central nervous system, and the existence of similar αMSH‐activated receptor in melanocytes remains uncharacterized. Future studies aimed at identifying Gq receptor (if any), the specific cAMP effector protein, and the PLC isoform functioning downstream of αMSH will further delineate the molecular details of this pathway.
In order to maintain Ca2+ levels, melanocytes establish SOCE through STIM1 and Orai1. While we observed substantial increase in SOCE with increase in pigmentation, surprisingly Orai1 knockdown did not affect melanogenesis but only decreased melanocyte proliferation (Fig 3). On the contrary, STIM1 was required for both melanoma growth and pigmentation. This suggested an Orai1‐independent role of STIM1 in pigmentation, which was further substantiated by performing studies with STIM1 SOAR mutant (STIM1 F394H) (Fig 6). Therefore, we have identified unanticipated but exciting independent roles for STIM1‐Orai1‐mediated SOCE in melanoma and for STIM1 in pigmentation (Fig 9). Further, for examining role of STIM1 in pigmentation in vivo, we performed studies with zebrafish embryos. Depletion of STIM1 in this model indeed showed substantial decrease in the pigmentation of the embryos (Fig 4). Using zebrafish transgenic lines, we demonstrate that the STIM1 knockdown performed at single‐cell stage does not perturb melanophore development and migration. Interestingly, STIM1 silencing clearly showed decreased expression of melanogenic enzymes in zebrafish (Fig 4).
Figure 9. STIM1 activates Orai1 and ADCY6 at ER‐PM junctions for driving melanocyte proliferation and pigmentation.
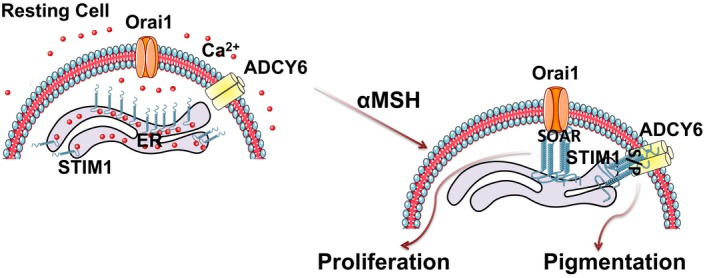
Schematic representation showing αMSH induces ER Ca2+ release and recruitment of STIM1 to ER‐PM junctions. STIM1 via its S/P domain interacts with ADCY6 at these junctions and regulates αMSH‐induced pigmentation. Additionally, STIM1 activates Orai1‐mediated Ca2+ influx for driving αMSH‐stimulated melanocyte proliferation. STIM1 therefore interacts with two distinct proteins at ER‐PM junctions for simultaneously driving two diverse cellular functions.
To elucidate the mechanism by which STIM1 was affecting melanogenic genes, we examined upstream factor cAMP that regulates activity of master transcription regulator MITF. Intriguingly, STIM1 recruitment at the plasma membrane showed twofold increase in the levels of cAMP (Fig 6E and F). To identify the cognate ADCY in this process, we performed targeted siRNA screen for all 10 ADCYs using two different screening methodologies. Surprisingly, the ADCYs that function with MC1R have not been established thus far. We here identified ADCY5, ADCY6, and ADCY9 as modulators of αMSH‐stimulated melanogenesis. Our immunoprecipitation and FRET studies revealed specific interaction of ADCY6 with STIM1 (Fig 7). STIM1 domain deletion studies, complementation analyses with two zebrafish STIM1 paralogs, and experiments with STIM1 ΔS/P domain identified an important role for S/P‐rich region of STIM1 in the ADCY6 interaction (Figs 8 and EV5). However, at this stage, it is not certain whether STIM1 and ADCY6 interact directly or form a complex at the ER‐PM junction. A recent study reported that STIM1 activates ADCY5 in polycystic cholangiocytes in the pathological condition of hepatic cyst formation. In this model, STIM1 recruitment to PM does not activate Orai1 channels and the increase in cAMP levels was suggested to be associated with decreased cytoplasmic Ca2+ levels (Spirli et al, 2017).
The αMSH‐induced signaling deciphered in this study is an interesting example of positive feedback loop activation wherein production of cAMP leads to further increase in cAMP levels through ER Ca2+ depletion. The feedback loop occurs to increase the output leading to the amplification of the melanin synthesis within melanocytes. Post‐initiation of the signaling cascade by the external stimuli, this intracellular amplification may also function as a cell‐autonomous module even after removal of the stimuli. However, the counter‐signal is formed by the STIM1‐Orai1 Ca2+ channels, which would refill the ER Ca2+ stores through sarcoplasmic–endoplasmic reticulum Ca2+ ATPase (SERCA). Thus, Ca2+ through STIM1‐Orai1 can act as counter‐signal that may break the loop. Under extreme stress conditions, this loop may stay active for longer duration that could lead to pathological outcomes. Interestingly, several dermatological disorders are characterized with localized hyperpigmented patches. These conditions are often associated with trauma, oxidative stress, and ischemia (Ortonne & Bissett, 2008; Davis & Callender, 2010; Roberts, 2015), all of which are known modulators of ER Ca2+ levels (Weber et al, 2001; Ermak & Davies, 2002; Treiman, 2002). It is tempting to speculate that the melanogenic signaling pathway identified in this study could be the underlying mechanism for such cutaneous hyperpigmentation. The intensity and duration of this signaling cascade may be the defining feature dictating such hyperpigmentary pathologies.
In conclusion, our study reports several novel findings on melanogenesis and its regulation by ER Ca2+ sensor STIM1. We identify ADCY6 as a novel interacting partner of STIM1 at ER‐PM junctions, and this interaction plays an important role in regulating pigmentation. Further, we delineate a physiologically relevant positive feedback response governed through cAMP‐Ca2+ crosstalk that leads to augmented melanogenesis. Future studies will attempt to delineate the kinetics of this loop and will explore its functional significance in pigmentary disorders. Given the centrality of this signaling module, it is very likely that this loop may be involved in variety of other physiological processes and pathological conditions.
Materials and Methods
Reagents
Thapsigargin, 2APB, αMSH, synthetic melanin, cAMP kit, and most of the other reagents were procured from Sigma. Catch and Release IP kit was from Millipore. Smartpool siRNAs were procured from Dharmacon, and shRNA clones for lentiviral packaging were from Open Biosystems. Primary human melanocytes were procured from Lonza. Media and other cell culture components were obtained from Invitrogen.
LD melanogenesis assay
As described earlier (Natarajan et al, 2014b), non‐pigmented mouse B16 cells were seeded at the density of 100 cells/cm2 for 6–8 days for inducing melanogenesis. Pigmented cells were then used for performing desired experiments.
Microarray analysis for pathway enrichment
For mapping changes in transcriptional signatures and signaling pathways corresponding to changes in melanocyte pigmentation, we performed microarray profiling of human primary melanocytes after treating them for 48 h with either tyrosine (a substrate of tyrosinase enzyme) or phenylthiourea (PTU, an inhibitor of tyrosinase enzyme). Upon analysis, some pathways showed differential regulation in PTU versus tyrosine‐treated melanocytes, indicating pigmentation‐dependent regulation of these pathways. The evaluation for pathway enrichment was done with Bioinformatics tool used for microarray analysis and functional annotation DAVID (Database for Annotation, Visualization and Integrated Discovery). For analysis, a cutoff of > 2 and < −2 fold change w.r.t. control was used to sort the genes for up‐regulation and down‐regulation. Finally, the lists of genes were fed on to DAVID software for gene functional classification. The percent enrichment (percentage of involved genes/total genes) was plotted after averaging the enrichment score for all the pathways (GO IDs) under related categories of function. The differentially regulated pathways in tyrosine‐ and PTU‐treated cells, respectively, were plotted together as depicted in Fig 1.
Calcium imaging
Fura2 Ca2+ imaging was performed as described earlier (Motiani et al, 2010, 2013a,b). Imaging was performed using Olympus IX series microscope coupled to high‐speed Evolve camera and Lambda DG4 for ratiometric imaging. Data shown in trace originate from multiple cells (the number of cells is denoted as “n” on each trace) on single imaging dish. Large numbers of such dishes were imaged, and final data are plotted in the form of bar graphs.
Melanin content assay
Melanin content assay was performed as described earlier (Kageyama et al, 2004). Briefly, cells were lysed in 1 N NaOH by heating at 80°C for 2 h, and then, absorbance was measured at 405 nm. Finally, the melanin content was estimated by interpolating the sample readings on melanin standard curve (μg/ml) obtained with synthetic melanin.
Lentiviral packaging and transduction
Lentiviral packaging and transduction was performed as reported by us previously (Zhang et al, 2011; Motiani et al, 2013a,b). Briefly, lentiviral packaging was done by co‐transfecting pVSVG, pdR8.2, and desired shRNA clone in HEK cells. Two days post‐transfections, lentiviral particles were collected from cell supernatant and were used for transducing target cell line.
Zebrafish work
Fish experiments were performed in strict accordance with the recommendations and guidelines laid down by the CSIR‐Institute of Genomics and Integrative Biology, India. The Institutional Animal Ethics Committee (IAEC) of the CSIR‐Institute of Genomics and Integrative Biology approved the protocol (Proposal No. 45a). For further experimental details of zebrafish work, please refer supplementary information.
Data availability
The microarray data are submitted to Gene Expression Omnibus and its accession number is GSE107450.
Statistical analysis
Experiments were performed at least three times except siADCY pigmentation screens, which were performed twice. Data are typically presented as Mean ± SEM, and unpaired Student's t‐test was performed for determining statistical significance. For statistics on melanoma tumor growth curves, ANOVA was performed. P‐value < 0.05 was considered as significant and is presented as “*”; P‐value < 0.01 is presented as “**”, and P‐value < 0.001 is presented as “***”.
Please refer to Appendix Experimental Procedures for other experimental procedures.
Author contributions
Conceptualization: RKM and RSG; Methodology: RKM and VTN; Investigation: RKM, JT, AV, SK, SSh, and SSr; Zebrafish work: DAR and SSi; Writing: RKM and RSG; Funding acquisition: RKM, VTN, and RSG; Supervision: RSG.
Conflict of interest
R.S.G. is Co‐founder and Director on the Board of Vyome Biosciences Pvt. Ltd., a biopharmaceutical company working in the Dermatology area.
Supporting information
Appendix
Expanded View Figures PDF
Movie EV1
Source Data for Expanded View
Review Process File
Source Data for Figure 2
Source Data for Figure 7
Source Data for Figure 8
Acknowledgements
R.K.M. is an INSPIRE Faculty Fellow (IFA12‐LSBM‐038) funded by DST, India. This work was funded by CSIR project “TOUCH” (BSC‐0302). Authors would like to thank Institutional Zebrafish facility and Confocal Microscopy facility incharges for their help. Calcium imaging facility was supported by CSIR project “CARDIOMED” (BSC‐0122). Technical assistance of Manish Kumar and Preity Sharma is highly appreciated. shRNA constructs for lentiviral generation were gifted by Mohamed Trebak (Penn State University, Hershey, USA). mCherry‐STIM1, YFP‐STIM1, and STIM1 truncation plasmids were generously provided by Rainer Schindl and Christoph Romanin (Institute of Biophysics, Johannes Kepler University, Linz, Austria). Jonathan Soboloff (Temple University, PA, USA) gifted STIM1‐YFP and STIM1 ΔS/P‐YFP plasmids. We acknowledge Yandong Zhou and Donald Gill (Penn State University, Hershey, USA) for sharing STIM1 F394H construct.
See also: J Soboloff et al (March 2018)
Contributor Information
Rajender K Motiani, Email: rajmotiani@igib.in.
Rajesh S Gokhale, Email: rsg@nii.ac.in.
References
- Abdel‐Malek ZA, Swope VB, Starner RJ, Koikov L, Cassidy P, Leachman S (2014) Melanocortins and the melanocortin 1 receptor, moving translationally towards melanoma prevention. Arch Biochem Biophys 563: 4–12 [DOI] [PubMed] [Google Scholar]
- Bellono NW, Najera JA, Oancea E (2014) UV light activates a Galphaq/11‐coupled phototransduction pathway in human melanocytes. J Gen Physiol 143: 203–214 [DOI] [PMC free article] [PubMed] [Google Scholar]
- Bill BR, Petzold AM, Clark KJ, Schimmenti LA, Ekker SC (2009) A primer for morpholino use in zebrafish. Zebrafish 6: 69–77 [DOI] [PMC free article] [PubMed] [Google Scholar]
- Bootman MD (2012) Calcium signaling. Cold Spring Harb Perspect Biol 4: a011171 [DOI] [PMC free article] [PubMed] [Google Scholar]
- Calloway N, Owens T, Corwith K, Rodgers W, Holowka D, Baird B (2011) Stimulated association of STIM1 and Orai1 is regulated by the balance of PtdIns(4,5)P(2) between distinct membrane pools. J Cell Sci 124: 2602–2610 [DOI] [PMC free article] [PubMed] [Google Scholar]
- Cooper DM (2015) Store‐operated Ca(2)(+)‐entry and adenylyl cyclase. Cell Calcium 58: 368–375 [DOI] [PubMed] [Google Scholar]
- David R (2013) Organelle dynamics: bridging the ER and plasma membrane. Nat Rev Mol Cell Biol 14: 66–67 [DOI] [PubMed] [Google Scholar]
- Davis EC, Callender VD (2010) Postinflammatory hyperpigmentation: a review of the epidemiology, clinical features, and treatment options in skin of color. J Clin Aesthet Dermatol 3: 20–31 [PMC free article] [PubMed] [Google Scholar]
- DeHaven WI, Smyth JT, Boyles RR, Bird GS, Putney JW Jr (2008) Complex actions of 2‐aminoethyldiphenyl borate on store‐operated calcium entry. J Biol Chem 283: 19265–19273 [DOI] [PMC free article] [PubMed] [Google Scholar]
- Derler I, Fahrner M, Muik M, Lackner B, Schindl R, Groschner K, Romanin C (2009) A Ca2(+)release‐activated Ca2(+) (CRAC) modulatory domain (CMD) within STIM1 mediates fast Ca2(+)‐dependent inactivation of ORAI1 channels. J Biol Chem 284: 24933–24938 [DOI] [PMC free article] [PubMed] [Google Scholar]
- D'Orazio J, Fisher DE (2011) Central role for cAMP signaling in pigmentation and UV resistance. Cell Cycle 10: 8–9 [DOI] [PubMed] [Google Scholar]
- English AR, Voeltz GK (2013) Endoplasmic reticulum structure and interconnections with other organelles. Cold Spring Harb Perspect Biol 5: a013227 [DOI] [PMC free article] [PubMed] [Google Scholar]
- Ermak G, Davies KJ (2002) Calcium and oxidative stress: from cell signaling to cell death. Mol Immunol 38: 713–721 [DOI] [PubMed] [Google Scholar]
- Gruszczynska‐Biegala J, Sladowska M, Kuznicki J (2016) AMPA receptors are involved in store‐operated calcium entry and interact with STIM proteins in rat primary cortical neurons. Front Cell Neurosci 10: 251 [DOI] [PMC free article] [PubMed] [Google Scholar]
- Halls ML, Cooper DM (2017) Adenylyl cyclase signalling complexes – pharmacological challenges and opportunities. Pharmacol Ther 172: 171–180 [DOI] [PubMed] [Google Scholar]
- Hartman ML, Czyz M (2015) MITF in melanoma: mechanisms behind its expression and activity. Cell Mol Life Sci 72: 1249–1260 [DOI] [PMC free article] [PubMed] [Google Scholar]
- Hooper R, Zaidi MR, Soboloff J (2016) The heterogeneity of store‐operated calcium entry in melanoma. Sci China Life Sci 59: 764–769 [DOI] [PMC free article] [PubMed] [Google Scholar]
- Kageyama A, Oka M, Okada T, Nakamura S, Ueyama T, Saito N, Hearing VJ, Ichihashi M, Nishigori C (2004) Down‐regulation of melanogenesis by phospholipase D2 through ubiquitin proteasome‐mediated degradation of tyrosinase. J Biol Chem 279: 27774–27780 [DOI] [PubMed] [Google Scholar]
- Kelsh RN, Brand M, Jiang YJ, Heisenberg CP, Lin S, Haffter P, Odenthal J, Mullins MC, van Eeden FJ, Furutani‐Seiki M, Granato M, Hammerschmidt M, Kane DA, Warga RM, Beuchle D, Vogelsang L, Nusslein‐Volhard C (1996) Zebrafish pigmentation mutations and the processes of neural crest development. Development 123: 369–389 [DOI] [PubMed] [Google Scholar]
- Lefkimmiatis K, Srikanthan M, Maiellaro I, Moyer MP, Curci S, Hofer AM (2009) Store‐operated cyclic AMP signalling mediated by STIM1. Nat Cell Biol 11: 433–442 [DOI] [PubMed] [Google Scholar]
- Levy C, Khaled M, Fisher DE (2006) MITF: master regulator of melanocyte development and melanoma oncogene. Trends Mol Med 12: 406–414 [DOI] [PubMed] [Google Scholar]
- Lin JY, Fisher DE (2007) Melanocyte biology and skin pigmentation. Nature 445: 843–850 [DOI] [PubMed] [Google Scholar]
- Liou J, Fivaz M, Inoue T, Meyer T (2007) Live‐cell imaging reveals sequential oligomerization and local plasma membrane targeting of stromal interaction molecule 1 after Ca2+ store depletion. Proc Natl Acad Sci USA 104: 9301–9306 [DOI] [PMC free article] [PubMed] [Google Scholar]
- Llopis J, Westin S, Ricote M, Wang Z, Cho CY, Kurokawa R, Mullen TM, Rose DW, Rosenfeld MG, Tsien RY, Glass CK (2000) Ligand‐dependent interactions of coactivators steroid receptor coactivator‐1 and peroxisome proliferator‐activated receptor binding protein with nuclear hormone receptors can be imaged in live cells and are required for transcription. Proc Natl Acad Sci USA 97: 4363–4368 [DOI] [PMC free article] [PubMed] [Google Scholar]
- Logan DW, Burn SF, Jackson IJ (2006) Regulation of pigmentation in zebrafish melanophores. Pigment Cell Res 19: 206–213 [DOI] [PubMed] [Google Scholar]
- Luo X, Zeng W, Xu X, Popov S, Davignon I, Wilkie TM, Mumby SM, Muallem S (1999) Alternate coupling of receptors to Gs and Gi in pancreatic and submandibular gland cells. J Biol Chem 274: 17684–17690 [DOI] [PubMed] [Google Scholar]
- Maleth J, Choi S, Muallem S, Ahuja M (2014) Translocation between PI(4,5)P2‐poor and PI(4,5)P2‐rich microdomains during store depletion determines STIM1 conformation and Orai1 gating. Nat Commun 5: 5843 [DOI] [PMC free article] [PubMed] [Google Scholar]
- Maresca V, Flori E, Camera E, Bellei B, Aspite N, Ludovici M, Catricala C, Cardinali G, Picardo M (2012) Linking alphaMSH with PPARgamma in B16‐F10 melanoma. Pigment Cell Melanoma Res 26: 113–127 [DOI] [PubMed] [Google Scholar]
- Motiani RK, Abdullaev IF, Trebak M (2010) A novel native store‐operated calcium channel encoded by Orai3: selective requirement of Orai3 versus Orai1 in estrogen receptor‐positive versus estrogen receptor‐negative breast cancer cells. J Biol Chem 285: 19173–19183 [DOI] [PMC free article] [PubMed] [Google Scholar]
- Motiani RK, Hyzinski‐Garcia MC, Zhang X, Henkel MM, Abdullaev IF, Kuo YH, Matrougui K, Mongin AA, Trebak M (2013a) STIM1 and Orai1 mediate CRAC channel activity and are essential for human glioblastoma invasion. Pflugers Arch 465: 1249–1260 [DOI] [PMC free article] [PubMed] [Google Scholar]
- Motiani RK, Zhang X, Harmon KE, Keller RS, Matrougui K, Bennett JA, Trebak M (2013b) Orai3 is an estrogen receptor alpha‐regulated Ca(2)(+) channel that promotes tumorigenesis. FASEB J 27: 63–75 [DOI] [PMC free article] [PubMed] [Google Scholar]
- Natarajan VT, Ganju P, Ramkumar A, Grover R, Gokhale RS (2014a) Multifaceted pathways protect human skin from UV radiation. Nat Chem Biol 10: 542–551 [DOI] [PubMed] [Google Scholar]
- Natarajan VT, Ganju P, Singh A, Vijayan V, Kirty K, Yadav S, Puntambekar S, Bajaj S, Dani PP, Kar HK, Gadgil CJ, Natarajan K, Rani R, Gokhale RS (2014b) IFN‐gamma signaling maintains skin pigmentation homeostasis through regulation of melanosome maturation. Proc Natl Acad Sci USA 111: 2301–2306 [DOI] [PMC free article] [PubMed] [Google Scholar]
- Nøhr AC, Shehata MA, Hauser AS, Isberg V, Mokrosinski J, Andersen KB, Farooqi IS, Pedersen DS, Gloriam DE, Osborne HB (2017) The orphan G protein‐coupled receptor GPR139 is activated by the peptides: adrenocorticotropic hormone (ACTH), a‐, and b‐melanocyte stimulating hormone (a‐MSH, and b‐MSH), and the conserved core motif HFRW. Neurochem Int 102: 105–113 [DOI] [PMC free article] [PubMed] [Google Scholar]
- Ortonne JP, Bissett DL (2008) Latest insights into skin hyperpigmentation. J Investig Dermatol Symp Proc 13: 10–14 [DOI] [PubMed] [Google Scholar]
- Park CY, Hoover PJ, Mullins FM, Bachhawat P, Covington ED, Raunser S, Walz T, Garcia KC, Dolmetsch RE, Lewis RS (2009) STIM1 clusters and activates CRAC channels via direct binding of a cytosolic domain to Orai1. Cell 136: 876–890 [DOI] [PMC free article] [PubMed] [Google Scholar]
- Park CY, Shcheglovitov A, Dolmetsch R (2010) The CRAC channel activator STIM1 binds and inhibits L‐type voltage‐gated calcium channels. Science 330: 101–105 [DOI] [PubMed] [Google Scholar]
- Richardson J, Lundegaard PR, Reynolds NL, Dorin JR, Porteous DJ, Jackson IJ, Patton EE (2008) mc1r Pathway regulation of zebrafish melanosome dispersion. Zebrafish 5: 289–295 [DOI] [PubMed] [Google Scholar]
- Ritchie MF, Samakai E, Soboloff J (2012) STIM1 is required for attenuation of PMCA‐mediated Ca2+ clearance during T‐cell activation. EMBO J 31: 1123–1133 [DOI] [PMC free article] [PubMed] [Google Scholar]
- Roberts WE (2015) Pollution as a risk factor for the development of melasma and other skin disorders of facial hyperpigmentation is there a case to be made? J Drugs Dermatol 14: 337–341 [PubMed] [Google Scholar]
- Schmidt M, Evellin S, Weernink PA, von Dorp F, Rehmann H, Lomasney JW, Jakobs KH (2001) A new phospholipase‐C‐calcium signalling pathway mediated by cyclic AMP and a Rap GTPase. Nat Cell Biol 3: 1020–1024 [DOI] [PubMed] [Google Scholar]
- Selz Y, Braasch I, Hoffmann C, Schmidt C, Schultheis C, Schartl M, Volff JN (2007) Evolution of melanocortin receptors in teleost fish: the melanocortin type 1 receptor. Gene 401: 114–122 [DOI] [PubMed] [Google Scholar]
- Shin DM, Son A, Park S, Kim MS, Ahuja M, Muallem S (2016) The TRPCs, orais and STIMs in ER/PM junctions. Adv Exp Med Biol 898: 47–66 [DOI] [PubMed] [Google Scholar]
- Smyth JT, Dehaven WI, Bird GS, Putney JW Jr (2008) Ca2+‐store‐dependent and ‐independent reversal of Stim1 localization and function. J Cell Sci 121: 762–772 [DOI] [PMC free article] [PubMed] [Google Scholar]
- Smyth JT, Hwang SY, Tomita T, DeHaven WI, Mercer JC, Putney JW (2010) Activation and regulation of store‐operated calcium entry. J Cell Mol Med 14: 2337–2349 [DOI] [PMC free article] [PubMed] [Google Scholar]
- Spirli C, Mariotti V, Villani A, Fabris L, Fiorotto R, Strazzabosco M (2017) Adenylyl cyclase 5 links changes in calcium homeostasis to cAMP‐dependent cyst growth in polycystic liver disease. J Hepatol 66: 571–580 [DOI] [PMC free article] [PubMed] [Google Scholar]
- Sroka R, Van Lint J, Katz SF, Schneider MR, Kleger A, Paschke S, Seufferlein T, Eiseler T (2016) Cortactin is a scaffolding platform for the E‐cadherin adhesion complex and is regulated by protein kinase D1 phosphorylation. J Cell Sci 129: 2416–2429 [DOI] [PubMed] [Google Scholar]
- Stanisz H, Stark A, Kilch T, Schwarz EC, Muller CS, Peinelt C, Hoth M, Niemeyer BA, Vogt T, Bogeski I (2012) ORAI1 Ca(2+) channels control endothelin‐1‐induced mitogenesis and melanogenesis in primary human melanocytes. J Invest Dermatol 132: 1443–1451 [DOI] [PubMed] [Google Scholar]
- Stanisz H, Vultur A, Herlyn M, Roesch A, Bogeski I (2016) The role of Orai‐STIM calcium channels in melanocytes and melanoma. J Physiol 594: 2825–2835 [DOI] [PMC free article] [PubMed] [Google Scholar]
- Stefan CJ, Manford AG, Emr SD (2013) ER‐PM connections: sites of information transfer and inter‐organelle communication. Curr Opin Cell Biol 25: 434–442 [DOI] [PMC free article] [PubMed] [Google Scholar]
- Sun J, Lu F, He H, Shen J, Messina J, Mathew R, Wang D, Sarnaik AA, Chang WC, Kim M, Cheng H, Yang S (2014) STIM1‐ and Orai1‐mediated Ca(2+) oscillation orchestrates invadopodium formation and melanoma invasion. J Cell Biol 207: 535–548 [DOI] [PMC free article] [PubMed] [Google Scholar]
- Treiman M (2002) Regulation of the endoplasmic reticulum calcium storage during the unfolded protein response–significance in tissue ischemia? Trends Cardiovasc Med 12: 57–62 [DOI] [PubMed] [Google Scholar]
- Videira IF, Moura DF, Magina S (2013) Mechanisms regulating melanogenesis. An Bras Dermatol 88: 76–83 [DOI] [PMC free article] [PubMed] [Google Scholar]
- Wang Y, Deng X, Mancarella S, Hendron E, Eguchi S, Soboloff J, Tang XD, Gill DL (2010) The calcium store sensor, STIM1, reciprocally controls Orai and CaV1.2 channels. Science 330: 105–109 [DOI] [PMC free article] [PubMed] [Google Scholar]
- Wang X, Wang Y, Zhou Y, Hendron E, Mancarella S, Andrake MD, Rothberg BS, Soboloff J, Gill DL (2014) Distinct Orai‐coupling domains in STIM1 and STIM2 define the Orai‐activating site. Nat Commun 5: 3183 [DOI] [PMC free article] [PubMed] [Google Scholar]
- Weber JT, Rzigalinski BA, Ellis EF (2001) Traumatic injury of cortical neurons causes changes in intracellular calcium stores and capacitative calcium influx. J Biol Chem 276: 1800–1807 [DOI] [PubMed] [Google Scholar]
- Willoughby D, Everett KL, Halls ML, Pacheco J, Skroblin P, Vaca L, Klussmann E, Cooper DM (2012) Direct binding between Orai1 and AC8 mediates dynamic interplay between Ca2+ and cAMP signaling. Sci Signal 5: ra29 [DOI] [PubMed] [Google Scholar]
- Yuan JP, Zeng W, Dorwart MR, Choi YJ, Worley PF, Muallem S (2009) SOAR and the polybasic STIM1 domains gate and regulate Orai channels. Nat Cell Biol 11: 337–343 [DOI] [PMC free article] [PubMed] [Google Scholar]
- Zhang W, Halligan KE, Zhang X, Bisaillon JM, Gonzalez‐Cobos JC, Motiani RK, Hu G, Vincent PA, Zhou J, Barroso M, Singer HA, Matrougui K, Trebak M (2011) Orai1‐mediated I (CRAC) is essential for neointima formation after vascular injury. Circ Res 109: 534–542 [DOI] [PMC free article] [PubMed] [Google Scholar]
Associated Data
This section collects any data citations, data availability statements, or supplementary materials included in this article.
Supplementary Materials
Appendix
Expanded View Figures PDF
Movie EV1
Source Data for Expanded View
Review Process File
Source Data for Figure 2
Source Data for Figure 7
Source Data for Figure 8
Data Availability Statement
The microarray data are submitted to Gene Expression Omnibus and its accession number is GSE107450.