

Abstract
Although c‐Myc is essential for melanocyte development, its role in cutaneous melanoma, the most aggressive skin cancer, is only partly understood. Here we used the Nras Q61K INK4a −/− mouse melanoma model to show that c‐Myc is essential for tumor initiation, maintenance, and metastasis. c‐Myc‐expressing melanoma cells were preferentially found at metastatic sites, correlated with increased tumor aggressiveness and high tumor initiation potential. Abrogation of c‐Myc caused apoptosis in primary murine and human melanoma cells. Mechanistically, c‐Myc‐positive melanoma cells activated and became dependent on the metabolic energy sensor AMP‐activated protein kinase (AMPK), a metabolic checkpoint kinase that plays an important role in energy and redox homeostasis under stress conditions. AMPK pathway inhibition caused apoptosis of c‐Myc‐expressing melanoma cells, while AMPK activation protected against cell death of c‐Myc‐depleted melanoma cells through suppression of oxidative stress. Furthermore, TCGA database analysis of early‐stage human melanoma samples revealed an inverse correlation between C‐MYC and patient survival, suggesting that C‐MYC expression levels could serve as a prognostic marker for early‐stage disease.
Keywords: AMPK, c‐Myc, gene targeting, melanoma, oxidative stress
Subject Categories: Cancer
Introduction
Malignant melanoma is an aggressive cancer of melanocytes and frequently originates in the skin. Cutaneous melanoma accounts for 80% of skin cancer‐related deaths (Siegel et al, 2013). Disease incidence and associated mortality rates increased continuously over the years (Gray‐Schopfer et al, 2007; Purdue et al, 2008). Neoplastic transformation of melanocytes results in mutations of proto‐oncogenes, which often cause hyperactivation of the MAP–kinase pathway (Chin et al, 2006). BRAF (V600E) and NRAS (Q61R) mutations are amongst the most frequent genetic aberrations found in patients with cutaneous melanoma. Mutation frequencies are 50–60% and 20%, respectively (Maldonado et al, 2003; Curtin et al, 2005; Xia et al, 2014). Other genetic lesions, which predispose to human melanoma formation, are loss‐of‐function mutations of the INK4A/ARF locus (Chin, 2003). More recently, next‐generation sequencing has been used to characterize the mutational landscape of human melanomas. These studies confirmed the presence of frequent driver mutations found in BRAF and NRAS but additionally identified novel genes whose mutations were associated with either NRAS‐ or BRAF‐driven melanomas (Berger et al, 2012; Xia et al, 2014). Interestingly, approximately one‐third of melanoma patients do not have any mutations in NRAS or BRAF indicating that other mutations, which do not necessarily lead to the hyperactivation of the MAP–kinase pathway, can also cause and/or influence progression of disease (Xia et al, 2014).
The bHLH zipper Myc proto‐oncogenic transcription factor family is comprised of three members: c‐, L‐, and N‐Myc. Myc expression in adult tissues is generally low and restricted to stem or progenitor cells (Laurenti et al, 2009). Myc function has been linked to many cellular processes including cell proliferation, growth, energy metabolism, and various biosynthetic pathways (Eilers & Eisenman, 2008; Kress et al, 2015). Although Myc genes are not frequently mutated in tumors, they are recurrently overexpressed in a plethora of cancers. The reason being that Myc is a downstream effector of many signaling pathways that are involved themselves in oncogenic processes. Subsequently, Myc is upregulated during disease progression. Consistently, activating mutations in MYC genes have not been identified in human melanoma, but C‐MYC has been found to be overexpressed in melanoma metastases as well as in tumor‐derived melanoma cell lines (Kraehn et al, 2001; Zhuang et al, 2008; Pouryazdanparast et al, 2012a). Overexpression of C‐MYC in metastases has been linked to copy number gain (Gerami et al, 2011; Pouryazdanparast et al, 2012a). Functionally, c‐Myc overexpression seems to be necessary to counteract oncogene‐induced senescence in NRASQ61R‐ or BRAFV600E‐driven melanoma (Zhuang et al, 2008). Additional roles that c‐Myc overexpression may play during metastasis of cutaneous melanoma are currently unknown.
While specific roles of c‐Myc overexpression in melanoma require further analysis, the physiological function of Myc in melanocytes has been well established during development (Pshenichnaya et al, 2012). c‐Myc loss of function (LoF) in melanocyte precursors resulted in reduced numbers of melanoblasts and mice revealed a hair graying phenotype. Interestingly, c‐Myc‐deficient melanocyte progenitors upregulated N‐Myc. Combined LoF of c‐Myc and N‐Myc resulted in a complete loss of pigmentation indicating that (i) N‐Myc partially compensates for loss of c‐Myc and (ii) Myc is essential for the melanocytic lineage.
The present study employs a metastasizing Nras Q61K INK4a −/− mouse melanoma model (Ackermann et al, 2005; Pshenichnaya et al, 2012) to address the function of c‐Myc and downstream target signaling for development, maintenance, and progression of disease. We assessed the functional role of c‐Myc either by inactivating c‐Myc or interfering with downstream target molecules. Results were compared and correlated to human melanoma for prognostic and predictive value of the disease.
Results
c‐Myc is essential for initiation of Nras‐driven INK4a‐deficient melanoma
To investigate the role of c‐Myc for melanoma development, we used a genetic LoF approach. We intercrossed mice carrying conditional alleles of c‐Myc (c‐Myc lox/lox; Trumpp et al, 2001) with transgenic melanoma‐prone mice (Tyr::Nras Q61K INK4a −/−). The Nras Q61K oncogene is expressed under the control of the tyrosinase promoter in combination with loss of the tumor suppressor INK4a (Ackermann et al, 2005). In addition, tyrosinase‐driven Cre‐recombinase ensures efficient inactivation of conditional c‐Myc alleles within the melanocytic lineage (Tyr::Nras Q61K INK4a −/− c‐Myc lox/lox and Tyr::Nras Q61K INK4a −/− c‐Myc lox/lox Tyr:Cre mice hereafter referred to as Tyr::Nras Q61K INK4a −/− c‐Myc Δ/Δ ) (Delmas et al, 2003; Ackermann et al, 2005; Pshenichnaya et al, 2012).
In agreement with previous reports (Ackermann et al, 2005), Tyr::Nras Q61K INK4a −/− c‐Myc lox/lox mice developed primary naevi at age of 2 months that progressed with time to melanotic melanoma invading the reticular dermis and subcutis. At 6–7 months, 100% of the mice have developed melanoma and more than 30% showed metastases in lymph nodes (LN), lung, and other organs (Figs 1 and EV1A–L). In contrast, Tyr::Nras Q61K INK4a −/− c‐Myc Δ/Δ mice did not develop melanoma within the investigated time frame, but a hair graying phenotype with normal skin morphology (Fig 1A and C). To test whether the incapacity of developing melanoma in c‐Myc‐mutant mice is simply a consequence of melanocyte deficiency, we performed Fontana‐Masson staining for melanin and also quantified cellular melanin content (Pshenichnaya et al, 2012) of the skin from Tyr::Nras Q61K INK4a −/− c‐Myc lox/lox , Tyr::Nras Q61K INK4a −/− c‐Myc Δ/Δ, C57BL/6, and NSG mice as controls. Positive staining confirmed the presence of residual melanocytes in the skin of Tyr::Nras Q61K INK4a −/− c‐Myc Δ/Δ mice (Fig 1A). The melanin content of Tyr::Nras Q61K INK4a −/− c‐Myc Δ/Δ mice was 15.9‐fold reduced compared to Tyr::Nras Q61K INK4a −/− c‐Myc lox/lox but comparable to C57BL/6 mice (Fig 1B). This is in agreement with a previous report showing that loss of c‐Myc in the melanocytic lineage results in reduced although detectable numbers of melanocyte precursors causing a hair graying phenotype in Tyr::Cre c‐Myc Δ/Δ mice (Pshenichnaya et al, 2012). The result indicates the inability to develop melanoma is not simply due to a complete loss of melanocytes during development.
Figure 1. c‐Myc is essential for melanoma initiation in Tyr::Nras Q61K INK4a −/− mice.
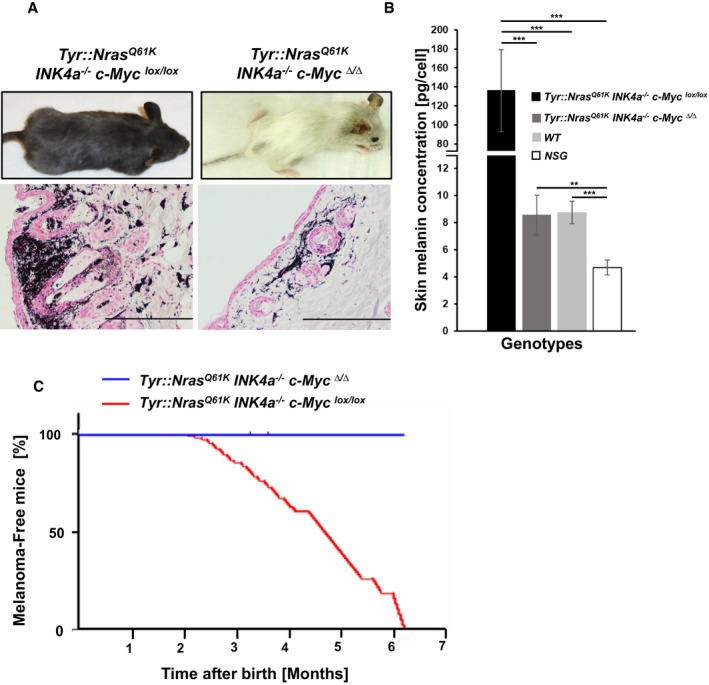
- Representative gross morphology of a Tyr::Nras Q61K INK4a −/− c‐Myc lox/lox melanoma bearing mouse (4 months) and an age‐matched tumor free Tyr::Nras Q61K INK4a −/− c‐Myc ∆/∆ mouse (top row). Histological analysis (Fontana‐Masson stain) of skin sections derived either from a Tyr::Nras Q61K INK4a −/− c‐Myc lox/lox mouse or from a Tyr::Nras Q61K INK4a −/− c‐Myc ∆/∆ mouse showing normal skin architecture (bottom row). Scale bars on images represent 200 μm (40× magnification).
- Bar graphs represent melanin concentration in the skin of indicated genotypes and are shown as mean ± standard deviation (s.d.). A significant decrease (15.9‐fold) in melanin concentration was observed in skin samples collected from Tyr::Nras Q61K INK4a −/− c‐Myc ∆/∆ animals (n = 7, dark gray bar) compared to Tyr::Nras Q61K INK4a −/− c‐Myc lox/lox (n = 6, black bar). Skin samples from C57BL6/J (n = 5, light gray bar, WT) and NSG (n = 5, white bar) were included as base line and negative controls, respectively. Skin samples from 4‐month‐old animals were analyzed. Each sample was measured at least twice. **P < 0.03, ***P < 0.01; Student's t‐test.
- Kaplan–Meier graph of melanoma incidence of Tyr::Nras Q61K INK4a −/− c‐Myc lox/lox (n = 100) and Tyr::Nras Q61K INK4a −/− c‐Myc ∆/∆ (n = 100) mice, for melanoma incidence scoring refer to materials and methods.
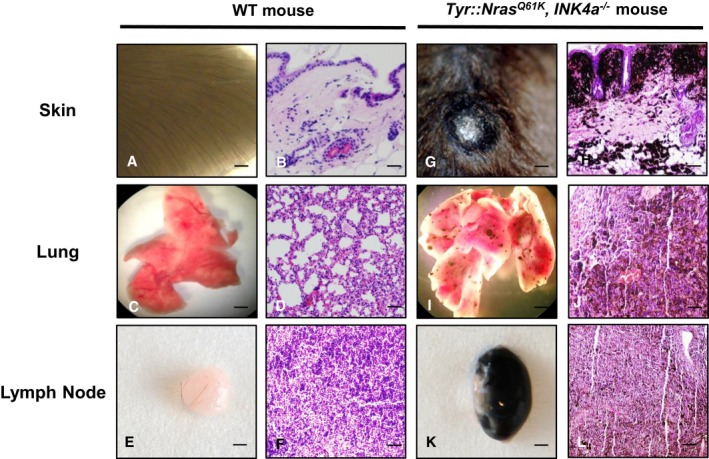
Figure EV1. Tyr::Nras Q61 KINK 4a −/− mouse model undergoes development of metastasis.
-
A–LRepresentative macroscopic pictures and H&E staining of sections taken from skin, lung, and lymph nodes (inguinal) of a metastatic melanoma bearing Tyr::Nras Q61K INK4a −/− mouse compared to an age‐matched wild‐type (WT) control animal. Picture panels: (A, C and E) represent wild‐type (WT) skin, lung, and lymph node, respectively. (G, I and K) depict metastatic Tyr::Nras Q61K INK4a −/− skin, lung, and lymph node, correspondingly. H&E staining sections shown in panels (B, D, and F) represent WT skin, lung, and lymph node. Panels (H, J, and L) show metastatic Tyr::Nras Q61K INK4a −/− skin, lung, and lymph node, respectively. Scale bar for panels (A, C, E, G, I, and K) = 5 mm; scale bar for panels (B,D,F, H, J, and L) = 500 μm.
Increased c‐Myc expression correlates with high tumor initiation potential and is preferentially confined to metastatic melanoma
We investigated next whether c‐Myc protein expression may change during disease progression analyzing primary versus metastatic sites in our (Tyr::Nras Q61K INK4a −/− ) melanoma animals. Thus, we made use of GFP‐c‐Myc knock‐in reporter mice (c‐Myc G/G), which express a functional GFP‐c‐Myc fusion protein (Huang et al, 2008). c‐Myc G/G were intercrossed with Tyr::Nras Q61K INK4a −/− mice to generate c‐Myc G/G Tyr::Nras Q61K INK4a −/− reporter animals (hereafter c‐Myc rep mice) (Fig 2A). c‐Myc protein expression in primary and metastatic tumors in c‐Myc rep mice was analyzed at 7 months of age. Interestingly, CD45−CD31− melanoma cells revealed an increase in both relative numbers and expression levels of GFP‐c‐Myc‐positive cells (hereafter c‐Mychi) at metastatic sites compared to primary tumor. At metastatic sites (LN, spleen, and lung), the percentage of c‐Mychi cells ranged from 36 to 85% compared to only approximately 4% at the primary tumor site (Fig 2B). Next, tumor initiation capacity was assessed comparing c‐Mychi melanoma cells versus c‐Myclo cells. Thus, one thousand CD45−CD31− Mychi or lo cells were FACS sorted from primary tumors and transplanted in Matrigel™ subcutaneously (s.c.) into NSG mice. c‐Mychi cells initiated tumor growth within 25 days post–transplantation, while tumor growth of c‐Myclo cells was detectable only 90 days post‐transplantation (Fig 2C). No metastases were observed. Ninety‐five percent of tumor cells derived from Mychi cells retained c‐Myc expression at experimental end‐stage analysis. Interestingly, 40% of melanoma cells derived from c‐Myclo cells were c‐Mychi 100 days post‐transplantation indicating that c‐Myclo cells can give rise to c‐Mychi tumors (Fig 2C).
Figure 2. c‐Myc is preferentially expressed in metastatic melanoma and correlates with high tumor initiation potential.
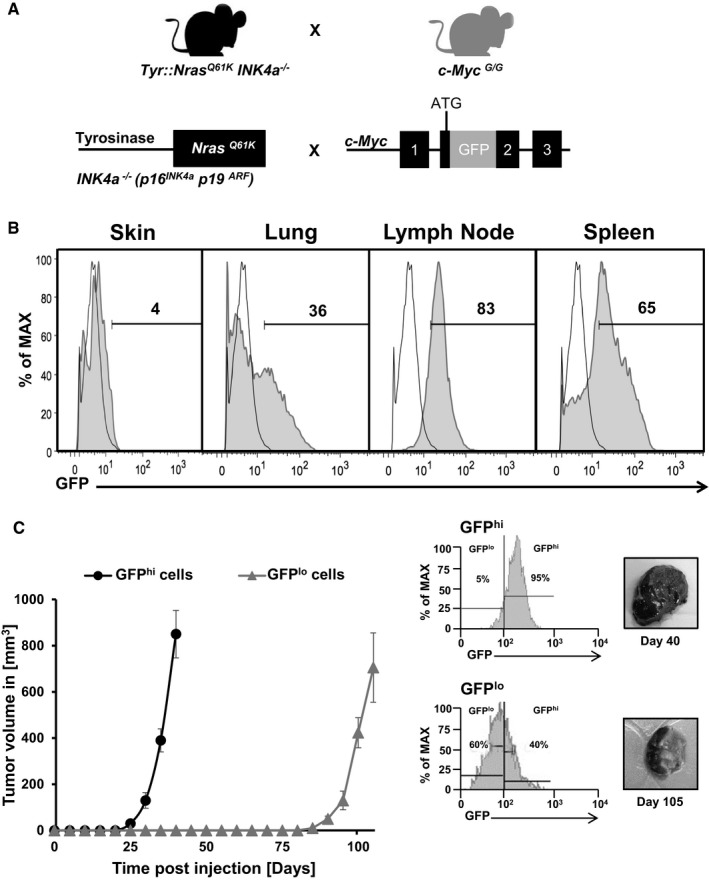
- Schematic depiction of the experimental strategy to generate a c‐Myc reporter melanoma mouse model intercrossing Tyr::Nras Q61K INK4a −/− with c‐Myc G/G reporter mice bearing a GFP cDNA targeted in frame into the second exon of the endogenous c‐Myc locus generating Tyr::Nras Q61K INK4a −/− c‐myc G/G animals.
- Histograms show representative flow cytometric analysis of GFP‐c‐Myc expression in melanoma cells (CD45−CD31−DAPI−) isolated from primary (skin) and metastatic sites (lymph node, lung, spleen) of 7‐month‐old Tyr::Nras Q61K INK4a −/− c‐myc G/G mice (gray filled histograms). Numbers indicate percentage of GFP+c‐Myc+ cells. Melanoma cells from age‐matched Tyr::Nras Q61K INK4a −/− mice (open histograms) were used as control (n = 3).
- Graph shows tumor initiation and growth of GFP‐c‐Myc (“hi”, black filled circles; GFP‐c‐Mychi) and (“lo”, gray filled triangle; GFP‐c‐Myclo) cells derived from metastatic lung melanoma of a Tyr::Nras Q61K INK4a −/− c‐myc G/G, which were s.c. injected in Matrigel™ into NSG mice (n = 5 mice per group). Data points are presented as mean ± standard deviation (s.d.). Histograms show representative flow cytometric analysis of GFP‐c‐Myc expression after tumor resection at endpoint analysis as indicated (n = 3). GFP expression was analyzed on CD45−CD31−DAPI− cells. Pictures show gross morphology of s.c. grown tumors at endpoint analysis as indicated.
Previous reports identified the neural crest stem cell (SC) marker CD271 as a potential cancer SC marker in human melanoma (Boiko et al, 2010; Civenni et al, 2011). Whether CD271 could also be a potential cancer SC marker in our murine melanoma model, its expression was analyzed in c‐Myc rep mice in primary and metastatic tumors. Although CD271 expression was mostly confined to c‐Mychi melanoma cells, transplantation experiments of CD271−c‐Mychi, CD271+c‐Mychi and CD271+c‐Myclo, CD271−c‐Myclo failed to confirm such cancer SC role for CD271 in our model. Differential CD271 expression of c‐Mychi cells did not significantly alter tumor initiation potential (Fig EV2).
Figure EV2. Differential CD271 expression in Tyr::Nras Q61 KINK 4a −/−‐driven melanoma does not alter tumor‐initiating potential.
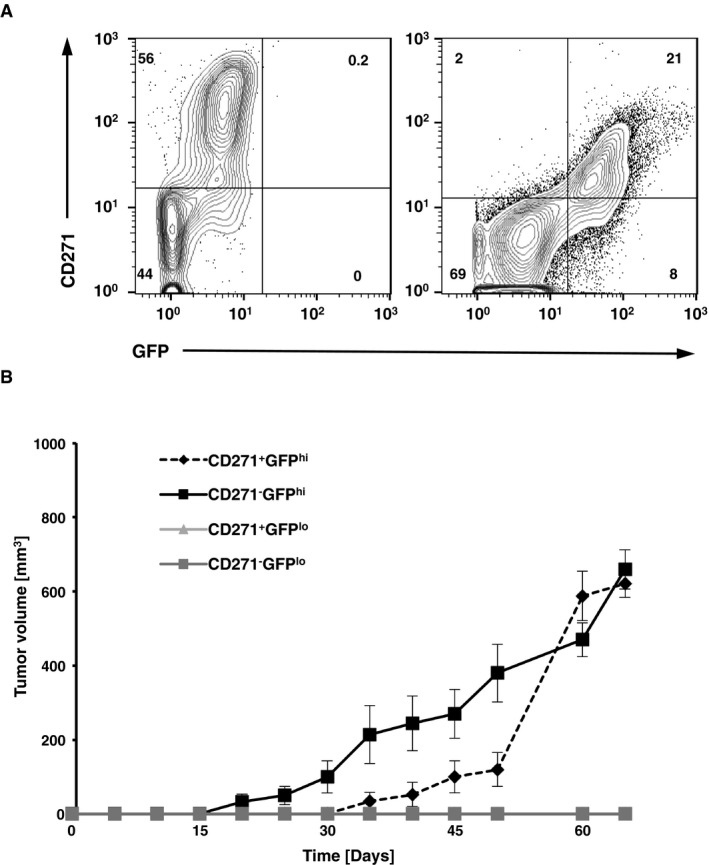
- Flow cytometric analysis shows representative FACS plots of GFP‐c‐Myc and CD271‐expressing (CD45−CD31−DAPI−) melanoma cells isolated from primary (skin) or metastic sites (LN) of a 7‐month‐old Tyr::Nras Q61K INK4a −/− c‐myc G/G animal.
- Graph shows tumor initiation and growth of sorted GFP‐c‐Mychi versus GFP‐c‐Myclo and/or CD271 (+) and (−) melanoma cells in Matrigel™ (1,000 s.c. cells per mouse) from Tyr::Nras Q61K INK4a −/− c‐myc G/G mice injected into Rag2γc −/− recipients. Groups were as follows: black filled diamond, CD271+GFPhi; black squares, CD271−GFPhi; gray triangles, CD271+GFPlo; gray squares, CD271−GFPlo (n = 5 mice per group). For each time point, data are presented as mean ± standard deviation (s.d.).
c‐Myc is essential for survival of Tyr::Nras Q61K INK4a −/−‐driven melanoma
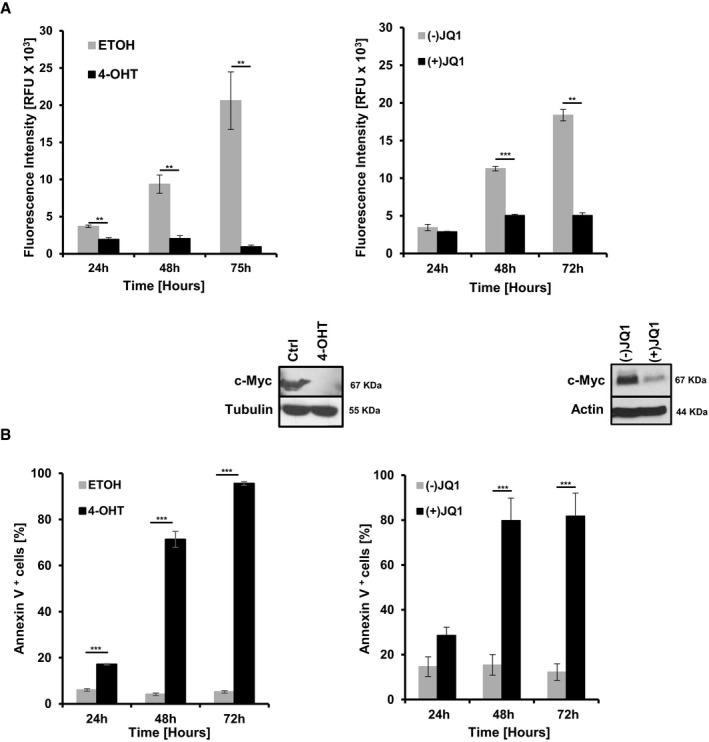
Although c‐Myc is essential for the initiation of Tyr::Nras Q61K INK4a −/−‐driven melanoma and correlates with high tumor initiation potential, its function in established melanoma is unclear. Thus, we generated two c‐Myc‐positive melanoma cell lines, mM1 and mM2, derived from Tyr::Nras Q61K INK4a −/− and Tyr::Nras Q61K INK4a −/− c‐Myc lox/lox mice, respectively. We stably introduced a tamoxifen‐inducible Cre‐ERT transgene followed by subsequent treatment with either vehicle (ETOH) or 4‐OH‐tamoxifen (4‐OHT) to excise the conditional c‐Myc alleles. Cell growth of mM2 in vitro was monitored using the alamarBlue® assay up to 72 h post‐treatment. Vehicle‐treated melanoma cells showed continuous cell growth (Fig 3A, left panel). In contrast, efficient c‐Myc inactivation as determined by Western blot analysis resulted in severely impaired growth and caused apoptosis of Myc‐deficient cells (Fig 3B, left panel). Cre‐ERT‐infected melanoma mM1 cells grew normal in the presence of both ETOH and 4‐OHT confirming that apoptosis is indeed a consequence of loss of c‐Myc function and not due to 4‐OHT treatment or aberrant Cre‐ERT activity (Fig EV3A and B). Genetic c‐Myc LoF results were further validated using the BET bromodomain protein inhibitor JQ1, which was previously shown to inhibit BRD4 at superenhancers, some of which are implicated in regulating c‐Myc transcription (Delmore et al, 2011; Loven et al, 2013). BET inhibition by (+)JQ1 but not the (−)JQ1 enantiomer resulted in reduced c‐Myc expression levels in mM1 and mM2 cells. This correlated with reduced cell growth and induction of apoptosis (Figs 3A and B, and EV3C). Reducing Myc protein levels in the frequently used B16F10 murine cell line revealed similar results (Fig EV3D).
Figure 3. c‐Myc is essential for survival of Tyr::Nras Q61K INK4a −/−‐driven melanoma in vitro .
-
A, BProliferation using the alamarBlue® staining assay (A) and analysis of apoptosis using AnnexinV/7AAD staining (B) was analyzed on Tyr::NRAS Q61K INK4a −/− c‐Myc lox/lox melanoma cells (mM2) stably expressing Cre‐ERT. These cells were treated with either ethanol (ETOH) or 4‐OH‐tamoxifen (4‐OHT) to inactivate the conditional c‐Myc gene (left panels) or treated with the bromodomain inhibitor (+)JQ1 to lower c‐Myc expression (right panels). The inactive (−)JQ1 enantiomer was used as vehicle control for (+)JQ1. Assays were performed at three independent time points (24, 48, and 72 h). Cre‐ERT‐ or JQ1‐mediated gene inactivation and expression of c‐Myc was controlled by Western blot analysis 48 h after treatment. Data are presented as mean ± standard deviation (s.d.) of one representative experiment. Two independent experiments were performed, and in each individual experiment, all data points were done in triplicates (**P < 0.03, ***P < 0.01; Student's t‐test).
Figure EV3. JQ1‐mediated downregulation of c‐Myc in Tyr::Nras Q61 KINK 4a −/− melanoma cells interferes with cell growth and survival.
-
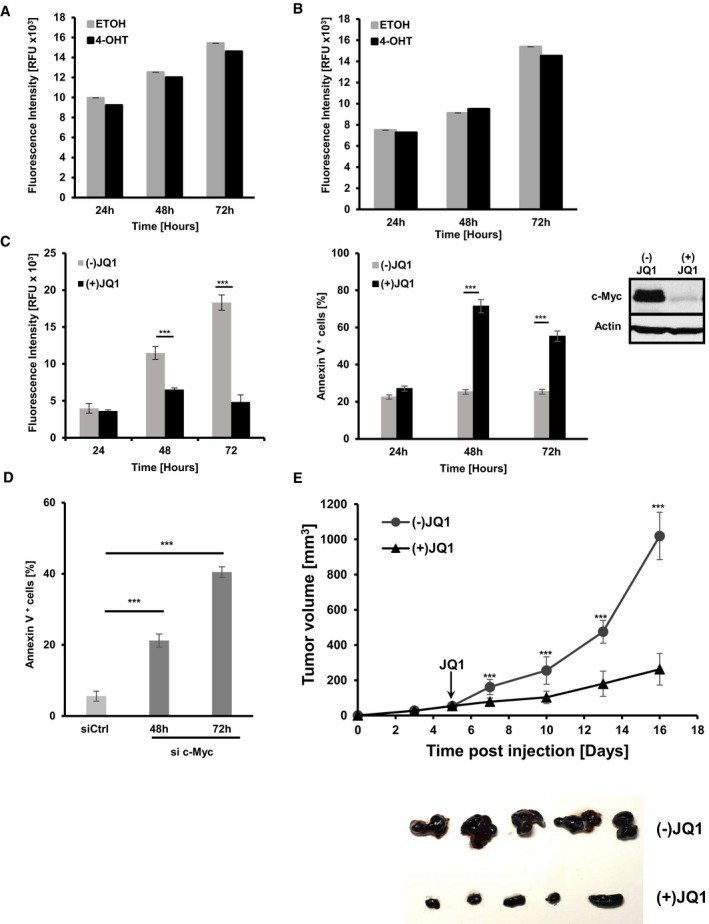
A, BProliferation assay using alamarBlue® staining on Tyr::Nras Q61K INK4a −/− c‐Myc +/+ mM1 melanoma cells (A) or mM1 melanoma cells stably transduced with a Cre‐ERT construct (B) treated with either 4‐OH‐tamoxifen (4‐OHT) to or ethanol (ETOH) as vehicle control. Data are presented as mean ± s.d. of one representative out of two independent experiments. In each experiment, all samples were done in triplicates.
-
CProliferation analysis using alamarBlue® staining (left panel) and quantification of apoptosis by AnnexinV/7AAD staining (left panel) of Tyr::Nras Q61K INK4a −/− c‐Myc +/+ mM1 cells treated with the bromodomain inhibitor (+)JQ1 to lower c‐Myc expression levels. Inactive (−)JQ1 enantiomer was used as control. Data are presented as mean ± s.d. of one representative experiment. Two independent experiments were performed. In each experiment, all samples were done in triplicates. c‐Myc protein levels were assessed by Western blot analysis.
-
DQuantification of apoptotic cells using AnnexinV/7AAD staining of B16F10 melanoma cells 48 or 72 h post siRNA‐mediated knockdown of c‐Myc (dark gray bars) versus control siRNA (light gray bars). Data are presented as mean ± s.d. of one representative out of two independent experiments. In each experiment, all samples were done in triplicates.
-
EGraph shows tumor growth of Tyr::NRAS Q61K INK4a −/− c‐Myc +/+ (mM3) melanoma cells injected s.c. (1 × 10⁵ mM3 cells per mouse) in Matrigel™ into Rag2γc −/− mice. At day 5 post‐transplantation, animals with a tumor volume of 50 mm3 were randomized into two groups (n = 6/group), injected with either (−)JQ1 (gray filled circles; 50 mg/kg/day) or (+)JQ1 (black filled circles; 50 mg/kg/day) starting on day 5. At experimental endpoint, tumors were harvested for gross morphology (bottom panel).
To investigate in vivo whether tumor maintenance is c‐Myc dependent, 1 × 10⁵ mM1 melanoma cells in Matrigel™ were injected s.c. into Rag2γc −/− mice. Seven days post‐transplantation, animals with a tumor volume of 100 mm3 were randomized into two groups (n = 11/group) and treated either with (+) or (−)JQ1. Tumor growth of the (+)JQ1 treated cohort was significantly retarded compared to the (−)JQ1 group (Fig 4A). A similar experiment using another Tyr::Nras Q61K INK4a −/−‐derived cell line (mM3) was performed to exclude the possibility that results are specific to mM1 cells (Fig EV3E). Furthermore, tumors were harvested at 5 and 9 days post JQ treatment for histological analysis of c‐Myc, Ki67, and cleaved caspase‐3 (Fig 4B). (+)JQ1‐treated animals show reduced staining for c‐Myc and Ki67, compared to tumors of the (−)JQ1‐treated cohort. Quantification of Ki67‐stained tumors indicates a reduction of 57% in (+)JQ1‐treated tumors compared to (−)JQ1. Cleaved caspase‐3 staining was comparable between the two cohorts indicating that in vivo (+)JQ1‐mediated tumor growth retardation might mostly be due to inhibition of proliferation. Stainings were similar for both time points investigated. These results strongly suggest that c‐Myc is essential for maintenance of transplanted melanoma cells in vivo.
Figure 4. c‐Myc is essential for survival of Tyr::Nras Q61K INK4a −/−‐driven melanoma in vivo .
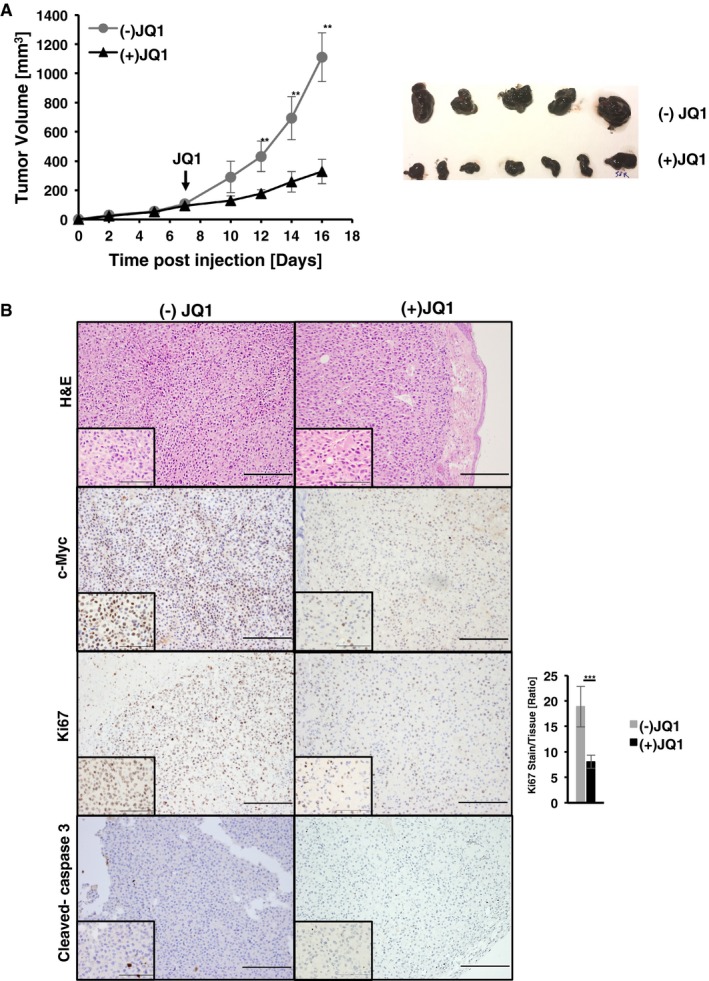
- Graph (left panel) shows tumor growth of Tyr::NRAS Q61K INK4a −/− c‐Myc +/+ (mM1) melanoma cells injected s.c. (1 × 10⁵ mM1 cells per mouse) in Matrigel™ into Rag2γc −/− mice. At day 7 post‐transplantation, animals with a tumor volume of 100 mm3 were randomized into two groups (n = 11/group), injected with either (−)JQ1 (gray filled circles; 50 mg/kg/day) or (+)JQ1 (black filled circles; 50 mg/kg/day) starting on day 7. For each time point, data are presented as mean ± standard deviation (s.d.). At experimental endpoint, tumors were harvested for gross morphology (right panel) (**P < 0.03; Student's t‐test).
- Histological analysis of tumors excised 9 days post JQ treatment. Depicted are representative H&E, nuclear c‐Myc, Ki67, and cleaved caspase‐3 stainings on tumor sections taken from either (−) or (+)JQ‐treated animals. Bar graph depicts quantification of Ki67‐positive cells represented as mean ± standard deviation (s.d.) (n = 5 tumors for (−)JQ1 and 7 for (+)JQ1; ***P < 0.01, Student's t‐test). Scale bars on images represent 200 μm and 100 μm in insets.
c‐Myc alters gene expression of metabolic signaling pathways
We next wanted to elucidate potential mechanisms by which c‐Myc exerts its essential function in Nras/INK4a −/−‐driven melanoma. We sorted GFP‐c‐Mychi and GFP‐c‐Myclo cells from primary and metastatic tumor sites of c‐Myc rep mice and performed gene expression analysis. In GFP‐c‐Mychi compared to GFP‐c‐Myclo melanoma cells, 13,993 genes were found to be significantly up‐ and 3,856 downregulated (Fig 5A). GO analysis indicated that metabolic processes followed by regulation of gene expression, transcription, RNA biosynthesis, and cell‐to‐cell communication were amongst the most significantly changed processes in c‐Mychi melanoma cells (Fig 5B). Expectedly, many genes regulating RNA processing and transcription, cell cycle and growth, and migration and invasion were significantly upregulated in melanoma cells expressing c‐Myc (Appendix Fig S1). KEGG pathway analysis pointed again to metabolic pathways including the 5′AMP‐activated protein kinase (AMPK), mTOR, and PI3K–AKT pathways as the most significantly deregulated pathways (Fig 5C and D). We therefore focused on changes in metabolic gene signatures and tested the relevance of two important metabolic regulators 3‐phosphoinositide‐dependent protein kinase‐1 (PDK1) and the AMPK signaling pathway. PDK1 is a master serine/threonine kinase important for the activation of AKT as well as other AGC kinases (Pearce et al, 2010) and was previously linked to melanoma (Scortegagna et al, 2014). Our reasoning to investigate the AMPK pathway closer was driven by the observation of increased expression of two isoforms of the β regulatory subunit of AMPK (Prkab1 and Prkab2, which encode AMPKβ1 and β2, respectively; Fig 5D) in c‐Myc‐positive melanoma cells. Additionally, AMPK is a central energy sensor, which plays critical roles in regulating metabolism and growth (Mihaylova & Shaw, 2011; Hardie et al, 2012). We knocked down Pdpk1 (which encodes PDK1) and Prkab2 in mM1 and mM2 cells. Knockdown of Pdpk1 revealed a minor but significant effect on survival in mM2 melanoma cells. In contrast, knockdown of Prkab2 induced apoptosis to a high percentage in both cell lines indicating that the AMPK pathway is functionally important for the survival of c‐Myc‐driven melanoma cells (Fig 5E). To further uncover a mechanistic function of c‐Myc in melanoma, we focused more specifically on the AMPK signaling pathway.
Figure 5. c‐Myc expression in Tyr::Nras Q61K INK4a −/− melanoma cells alters gene expression profiles of metabolic signaling pathways.
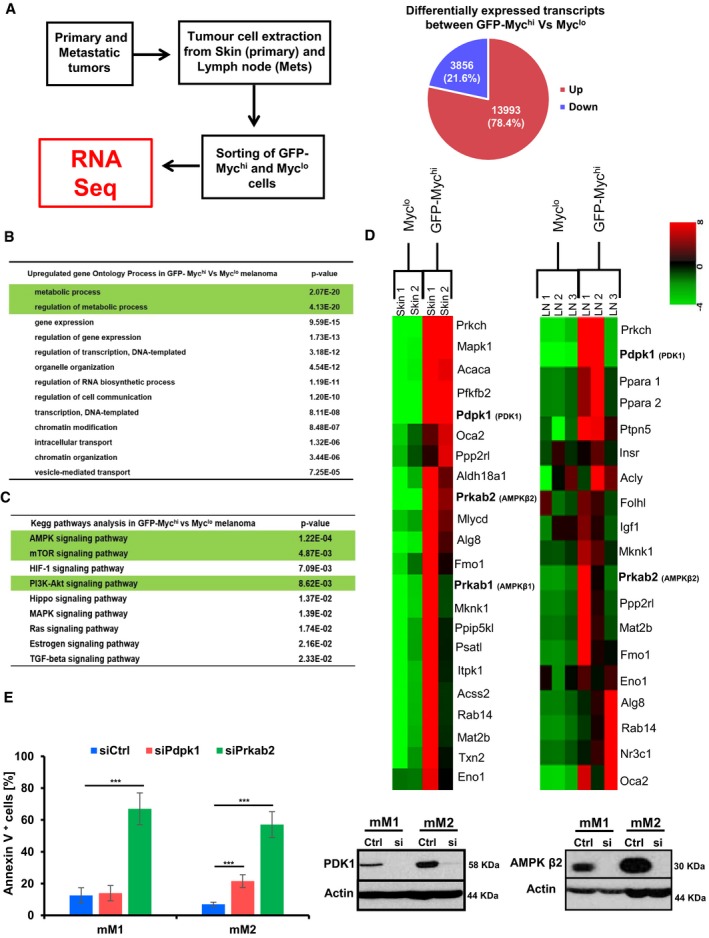
- Schematic depiction of the experimental design for RNA‐seq analysis on isolated melanoma cells derived from Tyr::Nras Q61K INK4a −/− c‐myc G/G mice. Sorted GFP‐c‐Mychi and GFP‐c‐Myclo cells were gated on CD45−CD31−DAPI− cells, and RNA was isolated from GFP‐c‐Mychi melanoma cells (two samples were derived from skin and one metastatic lymph node), and the GFP‐c‐Myclo counterpart populations were used for RNA‐seq (left panel). Right panel, pie chart indicates absolute and relative numbers of differentially expressed transcripts (upregulated transcripts in red and downregulated in blue) between GFP‐c‐Mychi and GFP‐c‐Myclo cells.
- Gene ontology analysis on upregulated genes comparing GFP‐c‐Mychi and GFP‐c‐Myclo cells.
- KEGG pathway analysis on upregulated genes comparing GFP‐c‐Mychi and GFP‐c‐Myclo cells.
- Heatmap of RNA expression patterns comparing changes between GFP‐c‐Mychi and GFP‐c‐Myclo cells derived from skin (primary site) and LN (metastatic site) indicating major alterations of metabolic genes. Green indicates low and red high gene expression.
- Quantification of apoptotic cells by AnnexinV/7AAD staining performed on two mouse melanoma cell lines mM1 and mM2 upon siRNA‐mediated knockdown of Pdpk1 (red bars) or Prkab2 (green bars). Scrambled siRNA was used as control (siCtrl, blue bars). Data are presented as mean ± s.d. of n = 3 independent experiments. In each experiment, all samples were done in triplicates. Knockdown efficiencies of Pdpk1 and Prkab2 were controlled at the protein level by Western blot analysis (two right panels) 72 h post siRNA‐mediated knockdown assessing AMPKβ2 (siPrkab2) and PDK1 (siPdpk1) protein levels (*P < 0.05, **P < 0.03, ***P < 0.01; Student's t‐test).
AMPK is important for survival of murine c‐Myc‐positive Tyr::Nras Q61K INK4a −/−‐driven melanoma cells
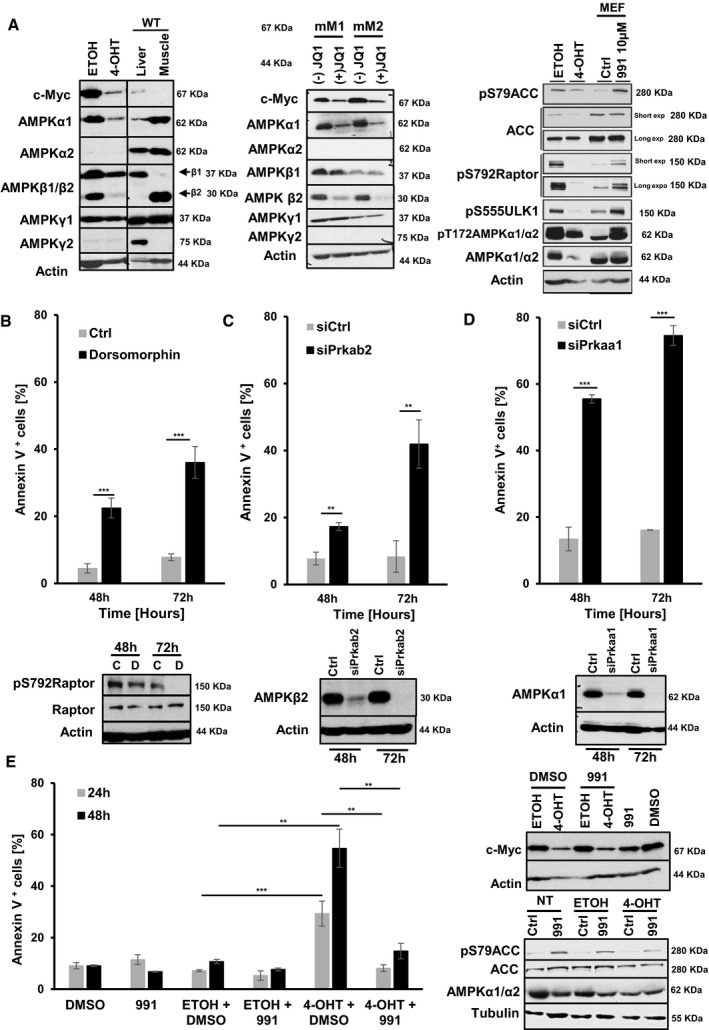
AMP‐activated protein kinase is a heterotrimer consisting of a catalytic subunit (α) and two regulatory subunits (β and γ). In mammalian cells, there are two genes encoding the AMPKα catalytic subunit (α1, α2), two β genes (β1, β2), and three γ subunits (γ1, γ2, γ3) (Hardie et al, 2012). As expression of some of these isoforms can be tissue specific (Bultot et al, 2016), we characterized the expression of the different AMPK isoforms in mM1 and mM2 cells with and without genetic inactivation or pharmacological inhibition of c‐Myc. Protein extracts from mouse liver and skeletal muscle tissues were used as positive controls to account for different cell type‐specific AMPK isoform expression. In mM1 and mM2 cells, AMPKα1, β1/β2, and γ1 are the predominantly expressed isoforms. Cre‐ERT‐mediated inactivation or pharmacological inhibition of c‐Myc in mM2 and mM1 cells resulted in a pronounced reduction in AMPKα1 and AMPKβ2, while β1 and γ1 were unaffected (Fig 6A, left panels). To investigate whether reduced expression of AMPKα1 and β2 had affected downstream targets of AMPK, we monitored phosphorylation of various AMPK substrates in c‐Myc sufficient versus c‐Myc‐depleted mM2 cells. mM2 c‐Myc‐depleted cells showed a robust reduction in phosphorylation of all tested AMPK substrates compared to control indicating that depletion of c‐Myc protein results in reduced cellular AMPK activity (Fig 6A, right panel). Whether inhibition of AMPK is sufficient to cause cell death of c‐Myc‐positive melanoma cells, mM1 and mM2 cells were treated with either vehicle or the small molecule AMPK inhibitor dorsomorphin for 48 or 72 h, respectively. Dorsomorphin treatment resulted in AMPK inhibition as indicated by reduced pRaptor phosphorylation and correlated with increased numbers of apoptotic cells (Figs 6B and EV4A). Results for mM1 and mM2 cells were comparable. Although dorsomorphin is frequently used as an AMPK inhibitor, the same compound inhibits additional signaling pathways such as BMP or ALK (Vogt et al, 2011). To confirm that dorsomorphin‐induced cell death of c‐Myc‐positive melanoma cells is indeed mediated through AMPK inhibition, we knocked down Pkrab2 and Prkaa1, which encode for the AMPKβ2 and α1 subunit in mM1, mM2, and B16F10 cells. Knockdown of Pkrab2 as well as of Prkaa1 resulted in increased cell death of c‐Myc‐positive melanoma cells (Figs 6C and D, and EV4B–D) confirming that AMPK is essential for survival of c‐Myc‐positive melanoma cells.
Figure 6. c‐Myc ensures survival of Tyr::Nras Q61K INK4a −/− melanoma cells via AMPK pathway.
-
AProtein expression profiling of the different AMPK isoforms in mM2 mouse melanoma cells in steady state and upon c‐Myc inactivation assessed by Western blot analysis 48 h after indicated treatments. Protein extracts from mouse liver and skeletal muscle tissues were used as positive controls for different AMPK isoforms (left and middle panel). Right panel shows phosphorylation status of known AMPK targets in the mM2 mouse melanoma cell line in steady state and upon c‐Myc inactivation.
-
BQuantification of apoptotic cells using AnnexinV/7AAD staining of mM2 melanoma cells 48 or 72 h after treatment with either the AMPK inhibitor dorsomorphin (black bars) or vehicle control (light gray bars). Data are presented as mean ± s.d. of one representative out of two independent experiments. In each experiment, all samples were done in triplicates. Dorsomorphin inhibition efficiency on the AMPK pathway was monitored by Western blot analysis assessing phosphorylation of Raptor (pS792Raptor).
-
C, DQuantification of apoptotic cells using AnnexinV/7AAD staining of mM2 melanoma cells 48 or 72 h post siRNA‐mediated knockdown of AMPKβ2 or AMPKα1 (black bars) versus control siRNA (light gray bars). Data are presented as mean ± s.d. of one representative out of three independent experiments. In each experiment, all samples were done in triplicates. Knockdown efficiency of AMPKβ2 or AMPKα1 was confirmed by Western blot analysis at 48 and 72 h post‐treatment.
-
EQuantification of apoptotic cells by AnnexinV/7AAD staining of mM2 melanoma cells 24 and 48 h post Cre‐ERT‐mediated inactivation of c‐Myc in presence or absence of the AMPK activator 991. Ethanol (ETOH) and DMSO were used as vehicle controls. Data are presented as mean ± s.d. of one representative out of two independent experiments. In each experiment, all samples were done in triplicates. Knockdown efficiency of c‐Myc was confirmed by Western blot analysis 48 h after treatment.
Figure EV4. siRNA‐mediated downregulation of AMPK in mM1 and B16F10 melanoma cells induces cell death.
-
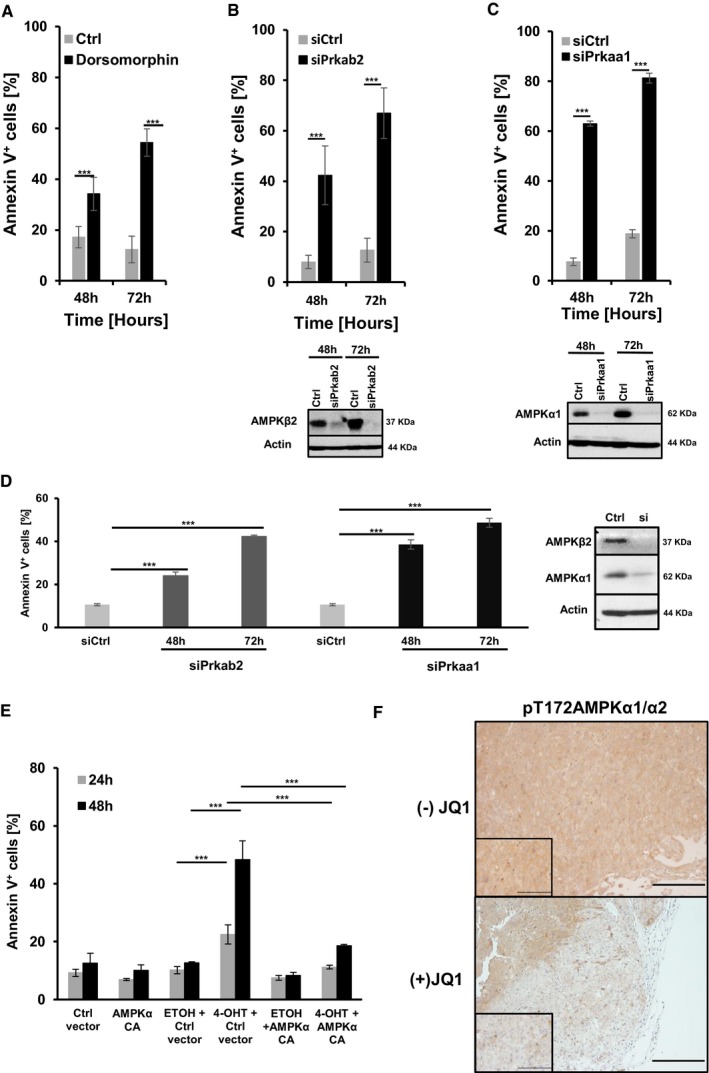
AQuantification of apoptotic cells using AnnexinV/7AAD staining of mM1 melanoma cells 48 or 72 h after treatment with either dorsomorphin (black bars) or vehicle control (light gray bars). Data are presented as mean ± s.d. of one representative out of two independent experiments. In each experiment, all samples were done in triplicates.
-
B, CQuantification of apoptotic cells using AnnexinV/7AAD staining of mM1 melanoma cells 48 or 72 h post siRNA‐mediated knockdown of AMPKβ2 (B) or AMPKα1 (black bars, C) versus control siRNA (light gray bars). Data are presented as mean ± s.d. of one representative out of three independent experiments. In each experiment, all samples were done in triplicates. Knockdown efficiency of AMPKβ2 or AMPKα1 was confirmed by Western blot analysis at 48 and 72 h post‐treatment.
-
DQuantification of apoptotic cells using AnnexinV/7AAD staining of B16F10 melanoma cells 48 or 72 h post siRNA‐mediated knockdown of AMPKβ2 (Prkab2, dark gray bars) or AMPKα1 (Prkaa1, black bars) versus control siRNA (light gray bars). Data are presented as mean ± s.d. of one representative out of two independent experiments. In each experiment, all samples were done in triplicates. Knockdown efficiency of AMPKβ2 or AMPKα1 was confirmed by Western blot analysis 48 h post‐treatment.
-
EQuantification of apoptotic cells by AnnexinV/7AAD staining of mM2 melanoma cells 24 and 48 h post Cre‐ERT‐mediated inactivation of c‐Myc in the presence or absence of a constitutive active form of AMPKα (AMPKα CA). Ethanol (ETOH) and DMSO were used as vehicle controls. Data are presented as mean ± s.d. of one representative out of two independent experiments. In each experiment, all samples were done in triplicates.
-
Fp‐AMPK immunostaining was performed on representative sections from s.c. transplanted tumors excised either 5 or 9 days post initial JQ treatment [(−)JQ or (+)JQ at 50 mg/kg at day 7 post‐transplantation]. Scale bars on images represent 200 μm.
We then investigated whether AMPK activation would be sufficient to counteract at least partially the apoptotic phenotype in c‐Myc‐mutant melanoma cells. mM2 cells were treated with either vehicle or 4‐OHT to activate Cre‐ERT in the presence of DMSO or the highly specific allosteric AMPK activator, 991 (Xiao et al, 2013). The ability of 991 to activate AMPK was verified by analyzing phosphorylation of bona fide AMPK substrates by Western blot analysis in MEFs and mM2 cells (Fig 6A and E right panel). As expected, lowering c‐Myc levels genetically resulted in pronounced cell death of mM2 cells. In contrast, genetic depletion of c‐Myc in the presence of 991 or the expression of a constitutive active form of AMPKα1 (Crute et al, 1998) significantly prevented the induction of apoptosis in mM2 c‐Myc‐depleted cells (Figs 6E and EV4E). We further confirmed in vivo that (+)JQ1‐treated melanoma bearing animals compared to (−)JQ1 treated animals revealed reduced p‐AMPK staining in tumor sections (Fig EV4F). These results suggest that activation of the AMPK pathway downstream of c‐Myc is important for survival of c‐Myc‐positive melanoma cells.
AMPK suppresses ROS in c‐Myc‐positive melanoma cells
Unraveling mechanisms of cell death in c‐Myc‐depleted melanoma cells will elucidate how AMPK downstream of c‐Myc ensures survival of tumor cells. Suppression of oxidative stress has been previously linked to the pro‐tumorigenic properties of AMPK (Liu et al, 2012; Saito et al, 2015). We thus investigated whether c‐Myc‐depleted mM2 cells undergo apoptosis due to increased oxidative stress. We found that melanoma cells with reduced c‐Myc significantly upregulated ROS (Fig 7A), which correlated with increased apoptosis (Fig 3B). To test whether increase in ROS is causative for induction of cell death, we treated c‐Myc‐depleted melanoma cells with the antioxidant/ROS scavenging agent α‐tocopherol. α‐tocopherol prevented ROS accumulation and rescued to a large extent c‐Myc‐depleted melanoma cells from cell death (Fig 7B). Since 991‐driven AMPK activation significantly prevents apoptosis in c‐Myc‐depleted melanoma cells, we assessed whether this is mediated via suppression of oxidative stress. Activation of 991‐mediated AMPK in c‐Myc‐depleted cells suppressed accumulation of ROS 48 h post‐treatment (Fig 7C), which correlated with pronounced survival compared to vehicle‐treated cells (Fig 6E). Therefore, depletion of c‐Myc and subsequent downregulation of AMPK signaling compromise survival partially by inducing oxidative stress‐mediated cell death. It appears that AMPK functions to counterbalance for deregulated c‐Myc‐induced biosynthesis, and if so, the need for AMPK could be alleviated by attenuating c‐Myc‐induced biosynthesis. Thus, mM1 and mM2 cells were treated with the AMPK inhibitor dorsomorphin in presence or absence of a RNA Pol III inhibitor, which slows down c‐Myc‐induced t‐RNA and ribosome biogenesis. Dorsomorphin‐induced apoptosis was significantly reduced in both mM1 and mM2 cells treated with the Pol III inhibitor (Fig 7D) supporting the hypothesis that AMPK provides a negative feedback loop for Myc‐induced biosynthesis. Moreover, we monitored cellular energy status by measuring adenine nucleotide levels (ATP, ADP, and AMP) in control and Myc‐depleted mM2 cells using ultra‐high performance liquid chromatography mass spectrometry (Pluskal et al, 2010; Fig EV5). Genetic c‐Myc depletion caused a robust and significant decrease in ATP and ADP levels, while AMP levels were not significantly altered, indicating that c‐Myc is an important driving force for ATP production. Consistent with the results of c‐Myc depletion, knockdown of AMPKα1/2 resulted also in significantly decreased ATP and ADP levels (Fig EV5). The reduction in ATP and ADP levels in AMPK knockdown cells was less pronounced compared to c‐Myc‐depleted cells, which is consistent with the possibility that c‐Myc exerts its important function in ATP biosynthesis not exclusively through AMPK.
Figure 7. AMPK suppresses ROS in c‐Myc‐positive Tyr::NRAS Q61K INK4a −/− melanoma cells.
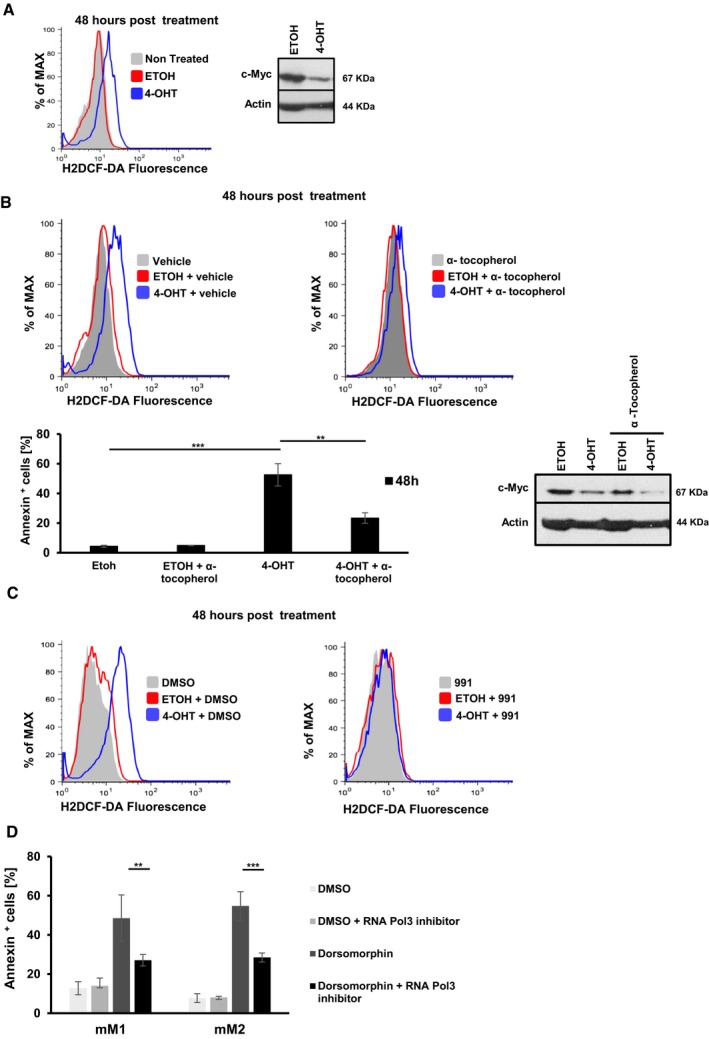
- Representative flow cytometric histograms showing ROS production measured by the H2DCF‐DA probe in mM2 cells 48 h post c‐Myc inactivation (blue line, 4‐OHT). Ethanol (red line, ETOH) was used as vehicle control. Gray filled histograms represent untreated cells (n = 3). Deletion of c‐Myc was assessed by Western blot analysis.
- Representative flow cytometric histograms (top panels) showing ROS production measured by the H2DCF‐DA probe in mM2 cells 48 h post c‐Myc inactivation (blue line, 4‐OHT) in the absence (vehicle; left panel) or presence (right panel) of the antioxidant vitamin E (α‐tocopherol, 100 μM). Ethanol (red line, ETOH) was used as vehicle control. Gray filled histograms represent vehicle alone or α‐tocopherol alone treated cells. Bar diagram represents quantification of apoptotic cells by AnnexinV/7AAD staining of mM2 melanoma cells 48 h post‐inactivation of c‐Myc in the presence or absence of the antioxidant vitamin E (α‐tocopherol, 100 μM). Ethanol (ETOH) or 4‐OH‐tamoxifen (4‐OHT) was used as vehicle control (left bottom panel). Deletion efficiency of c‐Myc was controlled by Western blot analysis (right bottom panel). **P < 0.03, ***P < 0.01, Student's t‐test.
- Representative flow cytometric histograms showing ROS production measured by the H2DCF‐DA probe in mM2 cells 48 h post c‐Myc inactivation in the presence or absence of the AMPK activator 991. Ethanol (ETOH) and DMSO were used as vehicle controls. Two independent experiments were performed.
- Bar graph depicts quantification of apoptotic cells using AnnexinV/7AAD staining of mM1 and mM2 melanoma cells 48 h post‐treatment: DMSO (white bar), DMSO + RNA Pol III inhibitor (light gray bar, 50 μM), dorsomorphin (dark gray bar, 10 μM), and RNA Pol III inhibitor + dorsomorphin (black bar, 50 μM and 10 μM, respectively).
Figure EV5. c‐Myc is a driving force for ATP production.
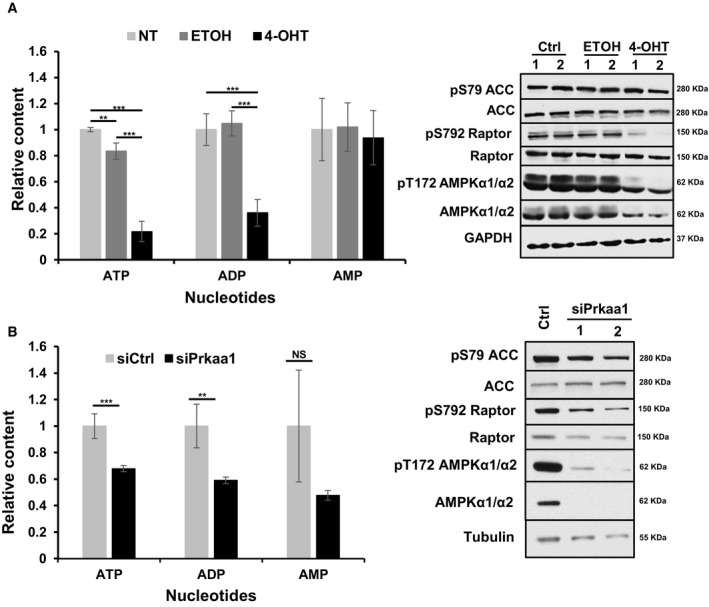
- Bar graph (left panel) depicts adenine nucleotide (ATP, ADP, and AMP) levels in mM2 cells either left untreated (Ctrl), treated with ethanol (ETOH) or genetic depletion of c‐Myc (4‐OHT) 48 h post‐treatment, and normalized to total amino acid content. Right panel shows phosphorylation status of known AMPK targets in the mM2 mouse melanoma cell line in steady state and upon c‐Myc inactivation 48 h post indicated treatments (untreated, Ctrl; vehicle, ETOH; c‐Myc inactivation, 4‐OHT).
- Bar graph (left panel) depicts ATP, ADP, and AMP nucleotide measurements in mM2 cells using siRNA‐mediated knockdown of AMPKα1 (siPrkaa1, black bars) versus control siRNA (siCtrl, light gray bars) 48 h post‐treatment and normalized to either protein content or total amino acid content. Right panel shows phosphorylation status of known AMPK targets in the mM2 mouse melanoma cell line in steady state and upon c‐Myc inactivation 48 h post indicated treatments (control siRNA, siCtrl; AMPKα1 depletion, siPrkaa with two (1,2) independent siRNAs).
Elevated C‐MYC expression correlates with reduced median survival of melanoma patients
Our data indicate that elevated c‐Myc protein expression is preferentially confined to metastatic sites in our mouse melanoma model. To investigate whether this is also the case in human melanoma, we tested C‐MYC protein expression in 15 patient‐derived human melanoma cell lines (Caballero et al, 2010; Nikolaev et al, 2011). They were either derived from primary tumors (5 cell lines) or from metastatic sites (10 cell lines). Three out of five melanoma cell lines from the primary tumor site showed low but detectable protein C‐MYC expression (LAU‐T126, LAU‐T921A, and LAU‐Me36), whereas in the two remaining cell lines (LAU‐Me300 and LAU‐Me 300A) C‐MYC expression was below detection limit. In contrast, 7 (LAU‐Me 252, LAU‐Me275, LAU‐T618A, LAU‐T1194, LAU‐T12, LAU‐T38713, and LAU‐T33) out of 10 melanoma cell lines derived from metastatic melanoma patient samples showed high C‐MYC expression levels (Fig 8A). There was no correlation between C‐MYC expression levels and NRAS or BRAF‐mutated patient samples, as C‐MYC expression was detected in either patient samples. To investigate the MYC‐AMPK‐ROS connection in human melanoma samples, we first analyzed the protein composition of the AMPK subunits in tumor cell lines of primary (LAU‐T921A) and metastatic (LAU‐Me 252) origin with low C‐MYC expression and two of metastatic origin (LAU‐Me275, LAU‐T333A) with high C‐MYC expression. All AMPK subunits were expressed though at different levels in the cell lines investigated, with the exception of AMPKα2 in LAU‐T333, which was not detected (Fig 8B). To test whether AMPK signaling in these four cell lines is important for survival, we knocked down PRKAA1/2 (AMPKα1/2). Interestingly, knockdown of AMPKα1/2 induced apoptosis and ROS production significantly in LAU‐T921A and LAU‐Me252 cells with high C‐MYC levels, while survival and ROS production was not significantly changed in LAU‐T921A‐ and LAU‐Me 252‐expressing low levels of C‐MYC (Fig 8C and D).
Figure 8. Elevated C‐MYC expression in human metastatic cell lines.
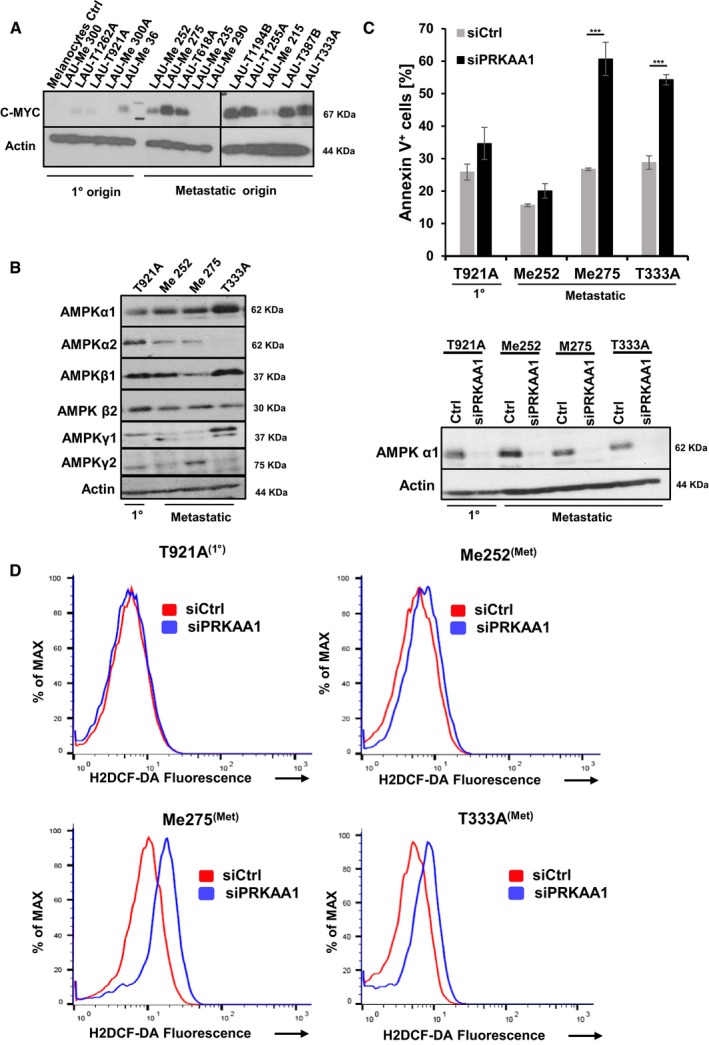
- Protein expression of C‐MYC in 15 human melanoma cell lines (5 primary = 1° skin tumors and 15 from metastatic origin) was assessed by Western blot analysis. Protein extracts from human melanocytes were included as negative control.
- Protein expression profiling of human AMPK isoforms in melanoma cell lines (one primary and three metastatic) was performed by Western blot analysis.
- Quantification of apoptotic cells using AnnexinV/7AAD staining of human melanoma lines 48 h post siRNA‐mediated knockdown of AMPKα1 (black bars) or control siRNA (light gray bars). Data are presented as mean ± s.d. of one representative out of two independent experiments. In each experiment, all samples were done in triplicates (***P < 0.01; Student's t‐test). Knockdown efficiency of AMPKα1 was confirmed by Western blot analysis 48 h post‐treatment.
- Representative flow cytometric histograms showing ROS production measured by the H2DCF‐DA probe in human melanoma cell lines (one primary and three metastatic) 48 h post siRNA‐mediated knockdown of AMPKα1 (solid blue line) or control siRNA (solid red line). Three independent experiments with comparable results were performed.
Source data are available online for this figure.
Next, we performed immunohistochemical analysis for C‐MYC and p‐AMPK on paraffin sections of unpaired patient‐derived tissue samples (eight patients—four primary tumors stage III‐IV and four metastatic tumors). No C‐MYC or p‐AMPK expression was detected in the four primary tumors, whereas all samples from metastatic sites (axillary region or liver) stained positive for C‐MYC and p‐AMPK (Fig 9A). We further analyzed paired tumor samples from 10 patients by immunostaining for C‐MYC and p‐AMPK to obtain a better understanding of C‐MYC and p‐AMPK expression during melanoma progression. In five cases (patients 2 and 7–10), C‐MYC expression was enhanced in metastatic compared to primary tumors, whereas in four patient samples (3–6) C‐MYC immunostaining was comparable between primary tumors and metastasis (Fig 9B). Furthermore, five out of six patients (5, 6, 8–10) with low C‐MYC expression in the primary tumor were also low for p‐AMPK expression. Moderate to high p‐AMPK staining was found in 5 out of 10 metastatic patient samples (2, 4, 6, 7, and 10) three of which correlated with high C‐MYC expression (patients 4, 7, and 10) indicating that high p‐AMPK‐expressing patients represent a subgroup of the high C‐MYC‐expressing population. Interestingly, patients whose primary tumor samples were weakly to moderately positive (below 50%) for C‐MYC had a longer time interval until occurrence of metastasis compared to patients in which the primary tumor sample had already high (over 50%) to very high (all cells) C‐MYC levels (Fig 9B).
Figure 9. High C‐MYC expression in melanoma patients correlates with reduced median survival.
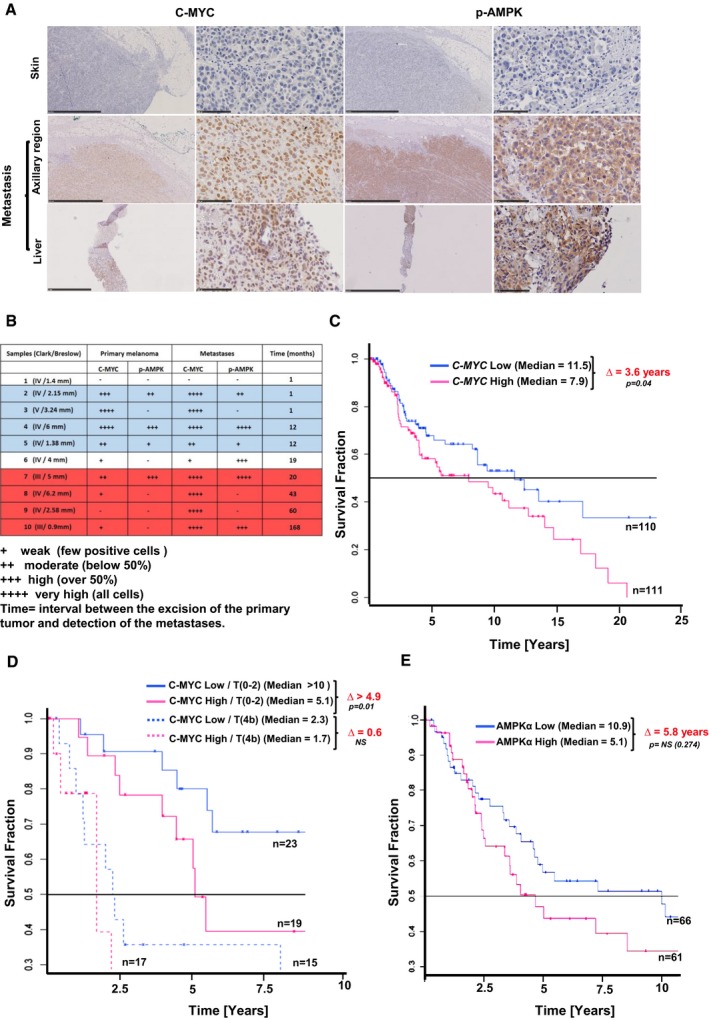
- C‐MYC (set of two left panels) as well as p‐AMPK (set of two right panels) immunostaining was performed on sections from primary (skin; top row) and metastatic (axillary region, middle row; liver, bottom row) of melanoma patient biopsies. A 5× gross morphology panel set and a 40× high magnification are depicted. Scale bars represent 2.5 μm (5×) and 100 μm (40×).
- Table shows semi‐quantitative evaluation of C‐MYC and p‐AMPK expression in primary and metastatic melanomas of 10 paired biopsies (skin, Clark/Breslow stages III and IV) and the time interval between the examined samples. Grading is indicated in the footnote.
- Kaplan–Meier survival graph plots C‐MYC RNA expression levels of 221 melanoma patients derived from TCGA database, divided into two groups C‐MYC lo (blue line) versus C‐MYC hi (pink line), and correlated with overall survival. Solid black line indicates 50% median survival. p‐value was calculated using log‐rank statistical test.
- Kaplan–Meier survival graph depicts 74 metastasis‐free melanoma patients from the TCGA database divided into four groups according to tumor (T) stage at diagnosis combined with C‐MYC protein expression levels (low/T(0‐2), solid blue line; high/T(0‐2), solid pink line; low/T(4b), stippled blue line; high/T(4b), stippled pink line). Solid line black indicates 50% median survival. P‐values were calculated using log‐rank statistical test.
- Kaplan–Meier survival graph plots AMPKα protein expression levels of 127 melanoma patients derived from TCGA database, divided into two groups AMPKαlo (blue line) versus AMPKαhi (pink line), and correlated with overall survival. Solid black line indicates 50% median survival. P‐value was calculated using log‐rank statistical test.
To test whether C‐MYC expression levels might correlate with poor prognosis, we analyzed TCGA database case sets and correlated survival of melanoma patients based on C‐MYC RNA expression of 352 patients, which were classified into high‐ and low‐expressing cohorts. The high expression cohort corresponds to the 33% (n = 110) of patients expressing highest C‐MYC RNA levels, whereas the low cohort includes the 33% (n = 111) of patients with the lowest expression. The Kaplan–Meier plot demonstrates that the patient cohort with high C‐MYC RNA expression levels has a significant reduction in median survival time (MST) of 3.6 years compared to patients with low C‐MYC expression (Fig 9C). The difference is even more significant if analysis of melanoma patients is based on C‐MYC protein expression correlated with tumor T stage at diagnosis. The analysis was performed on a cohort of 197 patients for which C‐MYC protein expression levels and corresponding tumor pathology information were available. Melanoma patients were divided into four groups: C‐MYClo/T0‐2; C‐MYChi/T0‐2; C‐MYClo/T4b; and C‐MYChi/T4b. Differential C‐MYC protein expression did not correlate with MST in T4b patients. In contrast, high C‐MYC protein expression in T0‐2 patients correlated significantly with reduced MST. The difference in reduced MST between the C‐MYC high and low patient cohorts was > 4.9 years (Fig 9D). These data support the hypothesis that elevated C‐MYC expression at early‐stage melanoma correlates well with reduced patient MST. Whether AMPK expression levels might correlate with poor prognosis, TCGA database case sets were analyzed and correlated with survival of melanoma patients based on AMPKα protein expression of 192 patients. They were classified into the 33rd percentile of patients with highest and lowest expression. Although not significant, patients that survive beyond 3 years of diagnosis show a clear trend with reduced MST of 5.8 years between AMPKα high and low patient cohorts (Fig 9E).
Discussion
c‐Myc is one of the best‐studied oncogenes promoting tumorigenesis in many tissues (Kress et al, 2015; Dejure & Eilers, 2017; Kalkat et al, 2017). It is frequently over expressed in cancer, correlates with tumor aggressiveness and poor clinical outcome (Nesbit et al, 1999; Beroukhim et al, 2010). Although gene‐targeting experiments for c‐Myc have revealed an essential role during melanocyte development (Pshenichnaya et al, 2012), its function in cutaneous malignant melanoma is not well known. Here, we have used a tyrosinase Nras Q61K‐driven INK4a‐mutant melanoma mouse model (Ackermann et al, 2005) to demonstrate that c‐Myc is essential during initiation, progression, and maintenance of disease, in part through activating AMPK signaling to suppress oxidative stress.
Ablation of c‐Myc during tumor initiation never led to melanoma formation, but instead, similar to wild‐type mice with melanocyte‐specific c‐Myc inactivation, exhibited a hair graying phenotype. The hair graying phenotype is the consequence of reduced numbers of melanoblasts, which still developed into functional melanocytes (Pshenichnaya et al, 2012). Interestingly and in agreement with this study, residual melanocytes were also detected in our c‐Myc‐mutant melanoma mouse model suggesting that the inability to develop melanoma is not simply a consequence of lack of melanocytes. Why remaining melanocytes do not develop into melanoma is currently unknown. However, it is possible that c‐Myc is essential for proliferation and thereby for the expansion of tumor‐initiating cells. The fact that none of the c‐Myc‐mutant melanoma mice developed disease strongly suggests that there is no functional redundancy with the other Myc family members.
Our studies using c‐Myc rep mice to monitor c‐Myc protein expression during melanoma progression show that only a minor fraction of melanoma cells are c‐Myc positive at the primary tumor site. Nonetheless, protein expression levels and frequency of c‐Myc‐positive cells are increased at metastatic sites. A similar trend was observed in analysis of patient‐derived cell lines or tumor samples with low or no C‐MYC expression in melanoma from the primary tumor site and high expression at the site of metastasis. These findings are in agreement with previous reports showing that elevated C‐MYC expression is preferentially observed in metastatic human melanoma patient samples correlating with and caused by copy number gains in C‐MYC at 8q24 (Kraehn et al, 2001; Gerami et al, 2011; Pouryazdanparast et al, 2012a,b).
Moreover, melanoma patients with copy number gains at 8q24 often reveal aggressive clinical progression (Pouryazdanparast et al, 2012b). Our TCGA analysis of C‐MYC expression in melanoma patients is in line with these reports and further extends our current knowledge. C‐MYC protein expression, in particular at early tumor stage (T0‐2), seems to be a significant predictor of reduced MST. Thus, assessing early lesions of melanoma patients for C‐MYC expression would be important and could bear prognostic value.
We do not know whether elevated c‐Myc expression at metastatic sites in our mouse melanoma model is also caused by gene amplification. Nevertheless, our transplantation experiments of c‐Mychi versus c‐Myclo melanoma cells demonstrated that c‐Myc‐positive melanoma cells are more aggressive and have a higher tumor initiation potential compared to c‐Myc‐negative melanoma cells. Whether melanoma is hierarchically organized in phenotypically distinct subpopulations of tumorigenic versus non‐tumorigenic is controversially discussed (Quintana et al, 2008, 2010; Schatton et al, 2008; Boiko et al, 2010; Civenni et al, 2011).
c‐Myc expression in murine melanoma causes a constitutive growth program upregulating associated gene expression signatures including RNA biosynthesis, RNA processing, transcription, and metabolism being in agreement with the role of Myc reported in other cancers (Eilers & Eisenman, 2008; Dang et al, 2009). All cellular processes, including metabolism, have to adapt to manage increased energy consumption and production of macromolecules in order to cope with proliferative stress to ensure survival of tumor cells. In this context, we focused on AMPK, as it is a central energy and redox sensor. AMPK is activated by metabolic stresses, which lower the cellular energy status by decreasing catabolic generation of ATP or accelerating ATP consumption. Upon activation, it functions to restore cellular energy homeostasis by switching off anabolic pathways and other ATP‐consuming processes while switching on ATP‐producing catabolic pathways (Hardie et al, 2012). The role of AMPK in cancer is complex and context dependent. Historically, AMPK was first associated with tumor suppressive functions based on the discovery that the tumor suppressor serine–threonine kinase liver kinase B1 is a direct activator of AMPK (Woods et al, 2003; Shaw et al, 2004). The ability of AMPK to activate the tuberous sclerosis complex, a negative regulator of mTORC1 and frequently activated in cancer through upstream activators such as PI3K and AKT, further suggested that AMPK plays a tumor suppressive role (Lizcano et al, 2004; Inoki et al, 2006). Genetic loss of studies showing that inactivation of AMPK accelerates tumor growth in an experimental model of lymphomagenesis is also in agreement with a tumor suppressive function of AMPK (Faubert et al, 2013). Although AMPK has been associated with tumor suppressive functions, there is accumulating evidence that activation of AMPK can act pro‐tumorigenic in a context‐dependent manner (Hardie, 2015). AMPK has been shown to be important in oncogene‐induced tumorigenesis as in HrasV12 ± PTEN‐induced astrocytic tumor cell proliferation (Rios et al, 2013) and kinase suppressor of Ras 2‐induced anoikis resistance of MEFs and several cancer cell lines (Fernandez et al, 2012). Interestingly, AMPK‐related kinase 5 (ARK5) was identified in a synthetic lethal RNAi screen for kinases that are selectively required to support tumor cells when Myc is overexpressed (Liu et al, 2012). Depletion of ARK5 prolonged survival in Myc‐driven hepatocellular carcinoma mouse models. Inhibition of AMPK signaling in Myc‐expressing cells resulted in cellular ATP collapse and caused increased levels of reactive oxygen species causing apoptosis (Liu et al, 2012). A similar role has been suggested for AMPK regulating NADPH homeostasis to promote tumor cell survival under circumstances of energy stress (Jeon et al, 2012). In a murine myeloid leukemia model, AMPK protected leukemia‐initiating cells from metabolic stress via suppression of ROS (Saito et al, 2015). Our results are in line with these reports showing that survival of c‐Mychi Nras Q61K‐driven INK4a‐mutant melanoma cells activates and is dependent on AMPK signaling to maintain ATP homeostasis and to suppress oxidative stress. Interestingly, specific AMPK subunits/isoforms (AMPKα1 and AMPKβ2) are amplified in various human tumors and coincide with activation and/or amplifications of various oncogenes including KRAS, BRAF, AKT, and C‐MYC across several cancer types such as breast, bladder cancer, and melanoma (Monteverde et al, 2015). These reports combined with our results support a pro‐tumorigenic role of AMPK signaling. Therefore, it is likely that its role is multifaceted and context dependent.
In conclusion, our results reveal an important AMPK‐dependent oncogenic mechanism by which c‐Myc‐positive melanomas ensure survival coping with tumor gene‐induced proliferative stress including suppression of oxidative stress. Moreover, we show that C‐MYC protein expression at an early stage of human melanoma has prognostic value for melanoma patients.
Materials and Methods
Mice
Tyr::Nras Q61K INK4a −/− mice were previously described (Ackermann et al, 2005) and crossed to c‐Myc lox/lox (Trumpp et al, 2001) and c‐Myc G/G (Huang et al, 2008) to generate Tyr::Nras Q61K INK4a −/− c‐Myc lox/lox and c‐Myc G/G Tyr::Nras Q61K INK4a −/− (c‐Myc rep ), respectively. Tyr::Nras Q61K INK4a −/− c‐Myc lox/lox were crossed to a melanocyte‐specific Cre line—Tyr::Cre (Delmas et al, 2003) to generate Tyr::Nras Q61K INK4a −/− c‐Myc ∆/∆. Rag2γc −/− (B6.Rag2tm1FwaII2gtmWjl) and NSG (NOD.Cg‐Prkdc scid Il2rγtm1Wjl/SzJ) were purchased from TACONIC and the Jackson Laboratories (United States).
Cell lines
Human melanoma cell lines have been described (Caballero et al, 2010; Nikolaev et al, 2011) and were cultured in RPMI1640 media supplemented with 10% FCS and 50 μg/ml gentamycin (RPMI10). Primary mouse melanoma cell lines (mM1, mM2, mM3) were cultured in RPMI10 supplemented with 5 μg/ml insulin (Sigma), 100 ng/ml α‐MSH (Sigma), 25 ng/ml FGF (Invitrogen), 200 ng/ml TPA (Sigma), 30 ng/ml endothelin3 (Sigma), and 5 μM dexamethasone (AppliChem). GFP‐IRES‐Cre‐ERT stable cell lines (mM1 and mM2) were generated transducing a GFP‐IRES‐Cre‐ERT construct. GFP+ cells were FACS sorted and expanded.
Single cell preparation of primary, metastatic, and s.c. melanomas
Tumors were minced into small pieces and digested using dispase (4 mg/ml, Gibco) and collagenase (1 mg/ml, Gibco) for 2 h at 37°C. Cell clumps were removed using a quick spin. Supernatant containing the single cell suspension was collected and filtered (40 μm cell strainer). Washing steps were repeated 3×. Two additional washes with 1× HBSS (without Mg2+ and Ca++) were performed prior to FACS staining or s.c. injections.
Immunohistochemistry
Mouse organs and primary patient samples (obtained from the Department of Pathology of CHUV, Lausanne) were fixed with 4% paraformaldehyde (4°C) and embedded in paraffin; 3‐μm sections were stained with H&E using standard methods. Anti‐c‐Myc (Y69, Abcam) staining was performed according to manufacturer's instructions.
Flow cytometry
Single cell suspensions of c‐Myc rep mice (5 × 10⁵–1 × 10⁶ cells) were resuspended in staining media (SM; 1× HBSS, 2% FCS), stained with α‐CD31 and α‐CD45 using standard flow cytometric staining procedures, and analyzed on a Dako CyAn Flow Cytometer for GFP expression; dead cells were excluded using DAPI (CD31−CD45−DAPI−). Data were processed using FlowJo® software. For subsequent RNA‐seq and s.c. transplantation assays, cells were sorted using a BC MoFlo AstriosEQ cell sorter. Purity of GFP+ and GFP− live cell populations (CD31−CD45−DAPI−) was >90%.
s.c. transplantation in vivo
In vivo transplantation assays were performed using sorted primary cell populations from c‐Myc rep mice (1,000 cells per recipient NSG mouse of either GFPlo or GFPhi (CD31−CD45−DAPI−) fraction) or using the mM1 or mM3 cell lines transplanting 1 × 10⁵ cells s.c. into Rag2γc −/− mice. Cells were injected into the flank of recipient mice in 100 μl of Matrigel™. Once tumor volumes reached 50–100 mm3 in the cell line transplantation assays, c‐Myc expression was inhibited using (−), (+)JQ1 at 50 mg/kg/day injecting mice i.p.
RNA‐seq
Total RNA was prepared from GFPhi or GFPlo FACS‐sorted cells and collected in triplicates using RNAqueous‐Micro kit (Ambion). RNA‐seq was performed by the Genomic Technologies Facility platform (University of Lausanne, Switzerland). An RNA amplification step was done using Ovation® RNA Amplification System V2 (Nugen). The Ovation® Ultralow Library System V2 (Nugen) was used for library preparation. Library sequencing was done using an Illumina HiSeq 2500 sequencer. RNA‐seq mapping and analysis are described in the Appendix Supplementary Methods.
Antibodies and Western blotting
Western analysis was performed under standard methods. All antibodies used in this study are listed in the Appendix Table S1.
Cell proliferation and apoptosis detection
Cell proliferation was analyzed using the alamarBlue® cell viability reagent (Invitrogen) according to manufacturer's instructions. Melanoma cells were plated (2,500 cells/well). Cells were treated 24 h post‐seeding with different compounds and harvested at different time points as indicated. Each condition was done in triplicates. Total apoptotic cells were assessed by AnnexinV‐Cy5/7AAD staining using the AnnexinV‐Cy5 Apoptosis Detection Kit (BD Biosciences) according to manufacturer's instructions. Samples were analyzed on a Dako CyAn Flow Cytometer and data processed using FlowJo® software.
siRNA
siRNA transfections were performed using Lipofectamine RNAiMAX (Invitrogen) according to manufacturers manual. Different siRNAs were purchased as smartPools (FlexiTube GeneSolution, GS17869) from Qiagen. Allstar negative control (Qiagen, SI03650318) was used as negative control.
In vitro assays
ROS staining
ROS analysis was detected using H2DCFDA (Sigma) staining. Twenty‐five thousand cells were stained with H2DCFDA at a final concentration of 50 μM. Cells were incubated for 45–60 min under standard culture conditions (37°C, 5% CO2), and then, H2DCFDA fluorescence was analyzed on a Dako CyAn Flow Cytometer. Data were processed using FlowJo® software. Each condition was analyzed in triplicates in three independent experiments.
c‐Myc inhibition
c‐Myc depletion in c‐Myc lox/lox Cre‐ERT‐expressing cells was induced treating cells with 4‐hydroxy‐tamoxifen (4‐OHT) (Sigma) at a final concentration of 1 μM in ethanol (ETOH). ETOH was used as vehicle control. c‐Myc expression was downregulated treating cells with the BRD4 inhibitor (+)JQ1 (Selleckchem) at a final concentration of 1 μM. The (−)JQ1 (Sigma, 1 μM) inactive enantiomer was used as control.
AMPK pathway modulation
AMP‐activated protein kinase pathway signaling was inhibited treating the cells with dorsomorphin (Sigma, 10 μM). AMPK pathway activation was induced treating cells with 991 (5‐{[6‐chloro‐5‐(1‐methylindol‐5‐yl)‐1H‐benzimidazol‐2‐yl]oxy}‐2‐methyl‐benzoic acid (Bultot et al, 2016); compound at a final concentration of 10 μM.
Antioxidant treatment
α‐tocopherol (Sigma; 100 μM) was used as antioxidant treatment to counteract ROS‐induced apoptosis. Cells were pretreated with α‐tocopherol for 24 h and subsequently maintained continuously in the media for the whole experiment.
Kaplan–Meier and statistical analysis
Protein and RNA‐seq expression levels from melanoma patients were downloaded from the TCGA website. Kaplan–Meier survival curves were created with survfit function from the survival R package and statistical comparisons with the function comp from the survMisc R package. For comparison of pooled data between two groups, unpaired t‐tests were used to determine significance (*P < 0.05, **P < 0.03, ***P < 0.01).
Adenine nucleotide measurements
Sample preparation for adenine nucleotide analysis was based on Gheldof et al (2017), see Appendix Supplementary Methods.
Ethics statement
All animal work was conducted according to Swiss national guidelines. All mice were kept in the animal facility under EPFL animal care regulations. This study has been reviewed and approved by the cantonal veterinary office.
Author contributions
AK, MA, CC, JS‐D, MPG, and SC performed experiments and analyzed data. ML performed statistical and data base analysis. LL analyzed pathological slides from human melanoma patients. UK, AT, SM, KS, and FB analyzed data and provided conceptual and experimental guidance throughout the study and helped writing the manuscript. FR conceived the study, analyzed data, and wrote the manuscript.
Conflict of interest
C. Collodet, M.P. Giner, S. Christen, S. Moco, and K. Sakamoto are employees of the Nestlé Institute of Health Sciences SA (Switzerland). The remaining authors declare that they have no conflict of interest.
Supporting information
Appendix
Expanded View Figures PDF
Source Data for Expanded View
Review Process File
Source Data for Figure 5
Source Data for Figure 6
Source Data for Figure 7
Source Data for Figure 8
Acknowledgements
This work was in part supported by the Swiss National Science Foundation and the Swiss Cancer League to F.R. We would like to acknowledge Christelle Dubey, Laure Bardouillet, Pasqualina Magliano, and Marianne Nkosi for technical assistance, Lionel Larue for providing the Tyr::Cre. We would like to thank Aleksandra Radenovic, Jose Artacho, the histology team, and Sintia Winkler for technical assistance with microscopy, histology, and flow cytometry. We would like to thank Gisele Ferrand for guidance and advice concerning animal experiments as well as the DNA array facility of the University of Lausanne for RNA sequencing and technical analysis.
The EMBO Journal (2018) 37: e97673
References
- Ackermann J, Frutschi M, Kaloulis K, McKee T, Trumpp A, Beermann F (2005) Metastasizing melanoma formation caused by expression of activated N‐RasQ61K on an INK4a‐deficient background. Can Res 65: 4005–4011 [DOI] [PubMed] [Google Scholar]
- Berger MF, Hodis E, Heffernan TP, Deribe YL, Lawrence MS, Protopopov A, Ivanova E, Watson IR, Nickerson E, Ghosh P, Zhang H, Zeid R, Ren X, Cibulskis K, Sivachenko AY, Wagle N, Sucker A, Sougnez C, Onofrio R, Ambrogio L et al (2012) Melanoma genome sequencing reveals frequent PREX2 mutations. Nature 485: 502–506 [DOI] [PMC free article] [PubMed] [Google Scholar]
- Beroukhim R, Mermel CH, Porter D, Wei G, Raychaudhuri S, Donovan J, Barretina J, Boehm JS, Dobson J, Urashima M, Mc Henry KT, Pinchback RM, Ligon AH, Cho YJ, Haery L, Greulich H, Reich M, Winckler W, Lawrence MS, Weir BA et al (2010) The landscape of somatic copy‐number alteration across human cancers. Nature 463: 899–905 [DOI] [PMC free article] [PubMed] [Google Scholar]
- Boiko AD, Razorenova OV, van de Rijn M, Swetter SM, Johnson DL, Ly DP, Butler PD, Yang GP, Joshua B, Kaplan MJ, Longaker MT, Weissman IL (2010) Human melanoma‐initiating cells express neural crest nerve growth factor receptor CD271. Nature 466: 133–137 [DOI] [PMC free article] [PubMed] [Google Scholar]
- Bultot L, Jensen TE, Lai YC, Madsen AL, Collodet C, Kviklyte S, Deak M, Yavari A, Foretz M, Ghaffari S, Bellahcene M, Ashrafian H, Rider MH, Richter EA, Sakamoto K (2016) Benzimidazole derivative small‐molecule 991 enhances AMPK activity and glucose uptake induced by AICAR or contraction in skeletal muscle. Am J Physiol Endocrinol Metab 311: E706–E719 [DOI] [PMC free article] [PubMed] [Google Scholar]
- Caballero OL, Zhao Q, Rimoldi D, Stevenson BJ, Svobodova S, Devalle S, Rohrig UF, Pagotto A, Michielin O, Speiser D, Wolchok JD, Liu C, Pejovic T, Odunsi K, Brasseur F, Van den Eynde BJ, Old LJ, Lu X, Cebon J, Strausberg RL et al (2010) Frequent MAGE mutations in human melanoma. PLoS One 5: e12773 [DOI] [PMC free article] [PubMed] [Google Scholar]
- Chin L (2003) The genetics of malignant melanoma: lessons from mouse and man. Nat Rev Cancer 3: 559–570 [DOI] [PubMed] [Google Scholar]
- Chin L, Garraway LA, Fisher DE (2006) Malignant melanoma: genetics and therapeutics in the genomic era. Genes Dev 20: 2149–2182 [DOI] [PubMed] [Google Scholar]
- Civenni G, Walter A, Kobert N, Mihic‐Probst D, Zipser M, Belloni B, Seifert B, Moch H, Dummer R, van den Broek M, Sommer L (2011) Human CD271‐positive melanoma stem cells associated with metastasis establish tumor heterogeneity and long‐term growth. Can Res 71: 3098–3109 [DOI] [PubMed] [Google Scholar]
- Crute BE, Seefeld K, Gamble J, Kemp BE, Witters LA (1998) Functional domains of the alpha1 catalytic subunit of the AMP‐activated protein kinase. J Biol Chem 273: 35347–35354 [DOI] [PubMed] [Google Scholar]
- Curtin JA, Fridlyand J, Kageshita T, Patel HN, Busam KJ, Kutzner H, Cho KH, Aiba S, Brocker EB, LeBoit PE, Pinkel D, Bastian BC (2005) Distinct sets of genetic alterations in melanoma. N Engl J Med 353: 2135–2147 [DOI] [PubMed] [Google Scholar]
- Dang CV, Le A, Gao P (2009) MYC‐induced cancer cell energy metabolism and therapeutic opportunities. Clin Cancer Res 15: 6479–6483 [DOI] [PMC free article] [PubMed] [Google Scholar]
- Dejure FR, Eilers M (2017) MYC and tumor metabolism: chicken and egg. EMBO J 36: 3409–3420 [DOI] [PMC free article] [PubMed] [Google Scholar]
- Delmas V, Martinozzi S, Bourgeois Y, Holzenberger M, Larue L (2003) Cre‐mediated recombination in the skin melanocyte lineage. Genesis 36: 73–80 [DOI] [PubMed] [Google Scholar]
- Delmore JE, Issa GC, Lemieux ME, Rahl PB, Shi J, Jacobs HM, Kastritis E, Gilpatrick T, Paranal RM, Qi J, Chesi M, Schinzel AC, McKeown MR, Heffernan TP, Vakoc CR, Bergsagel PL, Ghobrial IM, Richardson PG, Young RA, Hahn WC et al (2011) BET bromodomain inhibition as a therapeutic strategy to target c‐Myc. Cell 146: 904–917 [DOI] [PMC free article] [PubMed] [Google Scholar]
- Eilers M, Eisenman RN (2008) Myc's broad reach. Genes Dev 22: 2755–2766 [DOI] [PMC free article] [PubMed] [Google Scholar]
- Faubert B, Boily G, Izreig S, Griss T, Samborska B, Dong Z, Dupuy F, Chambers C, Fuerth BJ, Viollet B, Mamer OA, Avizonis D, DeBerardinis RJ, Siegel PM, Jones RG (2013) AMPK is a negative regulator of the Warburg effect and suppresses tumor growth in vivo . Cell Metab 17: 113–124 [DOI] [PMC free article] [PubMed] [Google Scholar]
- Fernandez MR, Henry MD, Lewis RE (2012) Kinase suppressor of Ras 2 (KSR2) regulates tumor cell transformation via AMPK. Mol Cell Biol 32: 3718–3731 [DOI] [PMC free article] [PubMed] [Google Scholar]
- Gerami P, Jewell SS, Pouryazdanparast P, Wayne JD, Haghighat Z, Busam KJ, Rademaker A, Morrison L (2011) Copy number gains in 11q13 and 8q24 [corrected] are highly linked to prognosis in cutaneous malignant melanoma. J Mol Diagn 13: 352–358 [DOI] [PMC free article] [PubMed] [Google Scholar]
- Gray‐Schopfer V, Wellbrock C, Marais R (2007) Melanoma biology and new targeted therapy. Nature 445: 851–857 [DOI] [PubMed] [Google Scholar]
- Hardie DG, Ross FA, Hawley SA (2012) AMPK: a nutrient and energy sensor that maintains energy homeostasis. Nat Rev Mol Cell Biol 13: 251–262 [DOI] [PMC free article] [PubMed] [Google Scholar]
- Hardie DG (2015) Molecular pathways: is AMPK a friend or a foe in cancer? Clin Cancer Res 21: 3836–3840 [DOI] [PMC free article] [PubMed] [Google Scholar]
- Huang CY, Bredemeyer AL, Walker LM, Bassing CH, Sleckman BP (2008) Dynamic regulation of c‐Myc proto‐oncogene expression during lymphocyte development revealed by a GFP‐c‐Myc knock‐in mouse. Eur J Immunol 38: 342–349 [DOI] [PubMed] [Google Scholar]
- Inoki K, Ouyang H, Zhu T, Lindvall C, Wang Y, Zhang X, Yang Q, Bennett C, Harada Y, Stankunas K, Wang CY, He X, MacDougald OA, You M, Williams BO, Guan KL (2006) TSC2 integrates Wnt and energy signals via a coordinated phosphorylation by AMPK and GSK3 to regulate cell growth. Cell 126: 955–968 [DOI] [PubMed] [Google Scholar]
- Jeon SM, Chandel NS, Hay N (2012) AMPK regulates NADPH homeostasis to promote tumour cell survival during energy stress. Nature 485: 661–665 [DOI] [PMC free article] [PubMed] [Google Scholar]
- Kalkat M, De Melo J, Hickman KA, Lourenco C, Redel C, Resetca D, Tamachi A, Tu WB, Penn LZ (2017) MYC deregulation in primary human cancers. Genes 8: E151 [DOI] [PMC free article] [PubMed] [Google Scholar]
- Kraehn GM, Utikal J, Udart M, Greulich KM, Bezold G, Kaskel P, Leiter U, Peter RU (2001) Extra c‐myc oncogene copies in high risk cutaneous malignant melanoma and melanoma metastases. Br J Cancer 84: 72–79 [DOI] [PMC free article] [PubMed] [Google Scholar]
- Kress TR, Sabo A, Amati B (2015) MYC: connecting selective transcriptional control to global RNA production. Nat Rev Cancer 15: 593–607 [DOI] [PubMed] [Google Scholar]
- Laurenti E, Wilson A, Trumpp A (2009) Myc's other life: stem cells and beyond. Curr Opin Cell Biol 21: 844–854 [DOI] [PubMed] [Google Scholar]
- Liu L, Ulbrich J, Muller J, Wustefeld T, Aeberhard L, Kress TR, Muthalagu N, Rycak L, Rudalska R, Moll R, Kempa S, Zender L, Eilers M, Murphy DJ (2012) Deregulated MYC expression induces dependence upon AMPK‐related kinase 5. Nature 483: 608–612 [DOI] [PubMed] [Google Scholar]
- Lizcano JM, Goransson O, Toth R, Deak M, Morrice NA, Boudeau J, Hawley SA, Udd L, Makela TP, Hardie DG, Alessi DR (2004) LKB1 is a master kinase that activates 13 kinases of the AMPK subfamily, including MARK/PAR‐1. EMBO J 23: 833–843 [DOI] [PMC free article] [PubMed] [Google Scholar]
- Loven J, Hoke HA, Lin CY, Lau A, Orlando DA, Vakoc CR, Bradner JE, Lee TI, Young RA (2013) Selective inhibition of tumor oncogenes by disruption of super‐enhancers. Cell 153: 320–334 [DOI] [PMC free article] [PubMed] [Google Scholar]
- Maldonado JL, Fridlyand J, Patel H, Jain AN, Busam K, Kageshita T, Ono T, Albertson DG, Pinkel D, Bastian BC (2003) Determinants of BRAF mutations in primary melanomas. J Natl Cancer Inst 95: 1878–1890 [DOI] [PubMed] [Google Scholar]
- Mihaylova MM, Shaw RJ (2011) The AMPK signalling pathway coordinates cell growth, autophagy and metabolism. Nat Cell Biol 13: 1016–1023 [DOI] [PMC free article] [PubMed] [Google Scholar]
- Monteverde T, Muthalagu N, Port J, Murphy DJ (2015) Evidence of cancer‐promoting roles for AMPK and related kinases. FEBS J 282: 4658–4671 [DOI] [PubMed] [Google Scholar]
- Nesbit CE, Tersak JM, Prochownik EV (1999) MYC oncogenes and human neoplastic disease. Oncogene 18: 3004–3016 [DOI] [PubMed] [Google Scholar]
- Nikolaev SI, Rimoldi D, Iseli C, Valsesia A, Robyr D, Gehrig C, Harshman K, Guipponi M, Bukach O, Zoete V, Michielin O, Muehlethaler K, Speiser D, Beckmann JS, Xenarios I, Halazonetis TD, Jongeneel CV, Stevenson BJ, Antonarakis SE (2011) Exome sequencing identifies recurrent somatic MAP2K1 and MAP2K2 mutations in melanoma. Nat Genet 44: 133–139 [DOI] [PubMed] [Google Scholar]
- Pearce LR, Komander D, Alessi DR (2010) The nuts and bolts of AGC protein kinases. Nat Rev Mol Cell Biol 11: 9–22 [DOI] [PubMed] [Google Scholar]
- Pluskal T, Nakamura T, Villar‐Briones A, Yanagida M (2010) Metabolic profiling of the fission yeast S. pombe: quantification of compounds under different temperatures and genetic perturbation. Mol BioSyst 6: 182–198 [DOI] [PubMed] [Google Scholar]
- Pouryazdanparast P, Brenner A, Haghighat Z, Guitart J, Rademaker A, Gerami P (2012a) The role of 8q24 copy number gains and c‐MYC expression in amelanotic cutaneous melanoma. Mod Pathol 25: 1221–1226 [DOI] [PubMed] [Google Scholar]
- Pouryazdanparast P, Cowen DP, Beilfuss BA, Haghighat Z, Guitart J, Rademaker A, Gerami P (2012b) Distinctive clinical and histologic features in cutaneous melanoma with copy number gains in 8q24. Am J Surg Pathol 36: 253–264 [DOI] [PubMed] [Google Scholar]
- Pshenichnaya I, Schouwey K, Armaro M, Larue L, Knoepfler PS, Eisenman RN, Trumpp A, Delmas V, Beermann F (2012) Constitutive gray hair in mice induced by melanocyte‐specific deletion of c‐Myc. Pigment Cell Melanoma Res 25: 312–325 [DOI] [PMC free article] [PubMed] [Google Scholar]
- Purdue MP, Freeman LE, Anderson WF, Tucker MA (2008) Recent trends in incidence of cutaneous melanoma among US Caucasian young adults. J Invest Dermatol 128: 2905–2908 [DOI] [PMC free article] [PubMed] [Google Scholar]
- Quintana E, Shackleton M, Sabel MS, Fullen DR, Johnson TM, Morrison SJ (2008) Efficient tumour formation by single human melanoma cells. Nature 456: 593–598 [DOI] [PMC free article] [PubMed] [Google Scholar]
- Quintana E, Shackleton M, Foster HR, Fullen DR, Sabel MS, Johnson TM, Morrison SJ (2010) Phenotypic heterogeneity among tumorigenic melanoma cells from patients that is reversible and not hierarchically organized. Cancer Cell 18: 510–523 [DOI] [PMC free article] [PubMed] [Google Scholar]
- Rios M, Foretz M, Viollet B, Prieto A, Fraga M, Costoya JA, Senaris R (2013) AMPK activation by oncogenesis is required to maintain cancer cell proliferation in astrocytic tumors. Can Res 73: 2628–2638 [DOI] [PubMed] [Google Scholar]
- Saito Y, Chapple RH, Lin A, Kitano A, Nakada D (2015) AMPK protects leukemia‐initiating cells in myeloid leukemias from metabolic stress in the bone marrow. Cell Stem Cell 17: 585–596 [DOI] [PMC free article] [PubMed] [Google Scholar]
- Schatton T, Murphy GF, Frank NY, Yamaura K, Waaga‐Gasser AM, Gasser M, Zhan Q, Jordan S, Duncan LM, Weishaupt C, Fuhlbrigge RC, Kupper TS, Sayegh MH, Frank MH (2008) Identification of cells initiating human melanomas. Nature 451: 345–349 [DOI] [PMC free article] [PubMed] [Google Scholar]
- Scortegagna M, Ruller C, Feng Y, Lazova R, Kluger H, Li JL, De SK, Rickert R, Pellecchia M, Bosenberg M, Ronai ZA (2014) Genetic inactivation or pharmacological inhibition of Pdk1 delays development and inhibits metastasis of Braf(V600E):Pten(−/−) melanoma. Oncogene 33: 4330–4339 [DOI] [PMC free article] [PubMed] [Google Scholar]
- Shaw RJ, Kosmatka M, Bardeesy N, Hurley RL, Witters LA, DePinho RA, Cantley LC (2004) The tumor suppressor LKB1 kinase directly activates AMP‐activated kinase and regulates apoptosis in response to energy stress. Proc Natl Acad Sci USA 101: 3329–3335 [DOI] [PMC free article] [PubMed] [Google Scholar]
- Siegel R, Naishadham D, Jemal A (2013) Cancer statistics, 2013. CA Cancer J Clin 63: 11–30 [DOI] [PubMed] [Google Scholar]
- Trumpp A, Refaeli Y, Oskarsson T, Gasser S, Murphy M, Martin GR, Bishop JM (2001) c‐Myc regulates mammalian body size by controlling cell number but not cell size. Nature 414: 768–773 [DOI] [PubMed] [Google Scholar]
- Vogt J, Traynor R, Sapkota GP (2011) The specificities of small molecule inhibitors of the TGFss and BMP pathways. Cell Signal 23: 1831–1842 [DOI] [PubMed] [Google Scholar]
- Woods A, Johnstone SR, Dickerson K, Leiper FC, Fryer LG, Neumann D, Schlattner U, Wallimann T, Carlson M, Carling D (2003) LKB1 is the upstream kinase in the AMP‐activated protein kinase cascade. Curr Biol 13: 2004–2008 [DOI] [PubMed] [Google Scholar]
- Xia J, Jia P, Hutchinson KE, Dahlman KB, Johnson D, Sosman J, Pao W, Zhao Z (2014) A meta‐analysis of somatic mutations from next generation sequencing of 241 melanomas: a road map for the study of genes with potential clinical relevance. Mol Cancer Ther 13: 1918–1928 [DOI] [PMC free article] [PubMed] [Google Scholar]
- Xiao B, Sanders MJ, Carmena D, Bright NJ, Haire LF, Underwood E, Patel BR, Heath RB, Walker PA, Hallen S, Giordanetto F, Martin SR, Carling D, Gamblin SJ (2013) Structural basis of AMPK regulation by small molecule activators. Nat Commun 4: 3017 [DOI] [PMC free article] [PubMed] [Google Scholar]
- Zhuang D, Mannava S, Grachtchouk V, Tang WH, Patil S, Wawrzyniak JA, Berman AE, Giordano TJ, Prochownik EV, Soengas MS, Nikiforov MA (2008) C‐MYC overexpression is required for continuous suppression of oncogene‐induced senescence in melanoma cells. Oncogene 27: 6623–6634 [DOI] [PMC free article] [PubMed] [Google Scholar]
Associated Data
This section collects any data citations, data availability statements, or supplementary materials included in this article.
Supplementary Materials
Appendix
Expanded View Figures PDF
Source Data for Expanded View
Review Process File
Source Data for Figure 5
Source Data for Figure 6
Source Data for Figure 7
Source Data for Figure 8