Abstract
This Letter proposes a wireless acoustic sensor for monitoring heartbeat and respiration rate based on phonocardiogram (PCG). The developed sensor comprises a processor, a transceiver which operates at industrial, scientific and medical band and the frequency of 2.54 GHz as well as two capacitor microphones which one for recording the heartbeat and another one for respiration rate. To evaluate the precision of the presented sensor in estimating heartbeat and respiration rate, the sensor is tested on the different volunteers and the obtained results are compared with a gold standard as a reference. The results reveal that root-mean-square error are determined <2.27 beats/min and 0.92 breaths/min for the heartbeat and respiration rate in turn. While the standard deviation of the error is obtained <1.26 and 0.63 for heartbeat and respiration rate, respectively. Also, the sensor estimate sounds of to obtained PCG signal with sensitivity and specificity 98.1% and 98.3% in turn that make 3% improvement than previous works. The results prove that the sensor can be appropriate candidate for recognising abnormal condition in the cardiorespiratory system.
Keywords: acoustic transducers, bioelectric phenomena, pneumodynamics, phonocardiography
Keywords: cardiorespiratory system monitoring, developed acoustic sensor, wireless acoustic sensor, heartbeat monitoring, respiration rate monitoring, phonocardiogram, PCG, capacitor microphones, frequency 2.54 GHz
1. Introduction
Death toll of cardiovascular diseases is rapidly increasing because of the growing elderly population and a sedentary lifestyle [1]. Recently, ample number of health monitoring systems have emerged over the past decade to decline the death toll and also detecting medical problems in patients. The systems are mostly used at the site of a medical emergency to measure human body's vital sign such as heartbeat, respiration rate, body temperature and pulse rate [2]. One of the essential drawbacks of the medical emergency is wasting time and cost for patients that attend to the places of medical emergency especially in long trip [3]. On the other hand, patients are encountered with deficits of basic requirements when a lot of them will increasingly refer to the medical and health-related services at the site to accomplish their routine clinical checkups [3]. Also, the apparatuses used in medical emergency (e.g. electrocardiogram (ECG) setting) are very high cost and bulky components for utilising at home. Currently, the telemedicine has emerged to overcome the drawbacks [4]. The telemedicine can propose a kind of location-based services to the patients by wearable systems at home during daily life [5].
ECG [6], seismocardiogram (SCG) [2] and phonocardiogram (PCG) [7] are three most common systems for measuring heartbeat that recently wearable sensors have significantly penetrated into the area. The ECG is a famous method to estimate the heartbeat using at least three electrodes. However, the electrodes make a lot of trouble for the patients when recording the heartbeat. Additionally, ECG associate with artefacts related to heart muscle [8]. For instance, an ECG device cannot distinguish the difference between the electrical activity of skeletal muscles and heart muscles [8]. Another system for estimating heartbeat is SCG. The SCG system can measure vibrations caused in the chest and abdomen using a micro-electromechanical systems accelerometer on the sternum while the patients lie supine [9]. The SCG was proposed in 1961, and was first applied in clinical studies 30 years later by [10]. Today, the advent of technology has opened new perspectives for clinical use of the SCG [11]. However, SCG measures heartbeat beside human body movements. PCG is another system that can be used to monitor the acoustic signals generated the movement of the valves and blood flow in the heart vessels besides contraction and relaxation of the myocardium [12].
Four sounds of , , and can be extracted of a PCG signal. The first heart sound () is formed from closing the tricuspid and mitral valve that mitral valve produces sound of much louder than tricuspid valve due to higher pressures in the left side of the heart. According to this, the mitral valve sound is considered as the main component of [13]. The second heart sound () results of the closure of the aortic and pulmonic valves. The closure of the aortic valve produces sound that is normally much louder than the closure of the pulmonic valve due to higher pressures in the left side of the heart. Thus, the aortic valve sound is the main component of [14]. The third heart sound () takes place just after when the mitral valve opens permitting the passive filling of the left ventricle. The sound is made by the large amount of blood striking to a very compliant left ventricular. The can be a normal state in children, pregnant females and well-trained athletes. However, if the left ventricle is not excessively compliant, will not be loud enough to record, as it occurs in most adults [15]. The fourth heart sound () happen just before when the atria contract to force blood into the left ventricle. The occurs in late diastole that requires a non-compliant left ventricle and it almost always abnormal [15].
In this Letter, a sensor to estimate heartbeat and respiration rate based on acoustic sensors is presented. The developed sensor consists of two capacitor microphones, a processor as well as a transceiver. In comparison to another PCG system [12, 16, 17], the proposed system can estimate heartbeat with more accuracy. So, the root-mean-square error (RMSE) of the proposed system than a gold standard (reference) in [18, 19] is obtained 2.27 for heartbeat and 0.92 for respiration rate. Also, the system measures respiration rate without needing to a belt around the abdomen as [20] and adding any other sensor as [21]. Beside that, sounds of to in five tests using the system are estimated with sensitivity of 98.1% and specificity 98.3% that results an improvement of 3% than works that reported in [13, 16]. Moreover, the system has a hardware with features such as low profile, low-weight compared with other methods which have cumbersome hardware [12, 22, 23].
2. Methodologies
The proposed system records the sounds and murmurs produced from the contracting heart including its valves and associated great vessel by a miniature acoustic sensor (Mic. #1) in the tip of small of tubular instrument that is connected to a stethoscope. The stethoscope obtains the information by listening to heart sound and four sounds including , , and are extracted of the measurements by a proposed technique. Also, the system measures respiration rate by another capacitor microphone (Mic. #2) which is situated near the mouth (Fig. 1).
Fig. 1.
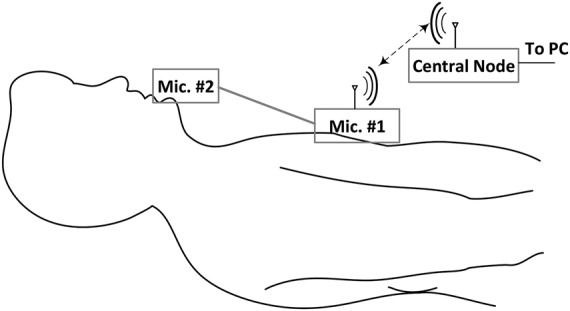
Schematic of measurement setup to estimation heartbeat and respiration rate
2.1. Components of the developed system
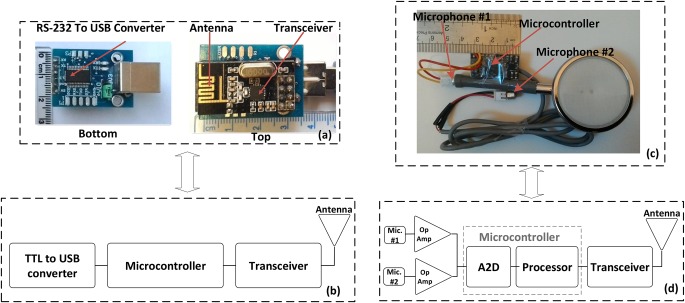
The measurement system for estimating the heartbeat and respiration rate consists of a wireless acoustic sensor for recording the instantaneous sound of the heart and a central node to transmit the measured data to personal computer (PC) for displaying the data as shown in Fig. 1. The wireless acoustic sensor, as a typical wireless sensor [24, 25], consists of two capacitor microphones, an amplifier, a transceiver (NRF-24) and a processor (AVR 32-bit microcontrollers) as shown in Fig. 2c. The microphones, amplifier, transceiver and processor are mounted on a small printed circuit board (PCB) and was supplied with lithium polymer battery of 3.3 V. Also, the central node comprises of a transceiver, a processor and a USB to TTL convertor (Fig. 2a) that were fixed on another PCB and were supplied with voltage on the USB port. The central node is the main controller for connecting to a computer and also communicates directly to the wireless acoustic sensor (i.e. the sensor node). The computer was used to store data with sampling rate of 50 Hz.
Fig. 2.
Developed central node and the developed sensor
a Photograph of the developed central node
b Schematic of components
c Photograph of the developed sensor
d Schematic of components
One of the essential drawbacks of the capacitor microphone is small variations of the signal amplitude in responding to heart sound. So, a digital to converter do not able to detect variation of them. Thus, increasing the gain of the signals finds an essential meaning. To that end, two amplifiers (LM 386) are used with negative feedback and also gain of close loop 100 to increase the amplitude of the signals. Then, the signals are digitised using analogue-to-digital converter (A2D) of AVR microcontroller (Atmega 32). The A2D is a 10-bit A2D that its sample rate is set at 1 kHz. The digitised signals are transmitted to the central node by the transceiver (NRF-24) which has more reliable than other transceivers reported in [22, 23]. The employed transceiver benefits from Gaussian frequency-shift keying modulation [26] and has features such as low-power consumption, high bit rate, high reliability of data transmission and low cost as well as it transmits the data at industrial, scientific and medical band at the frequency of 2.4 GHz. Furthermore, the transceiver was equipped to a built-in meander planar inverted-F antenna to utilise for personal wireless communication devices (Fig. 2a). It should be noted that it is out power and bit rate are set at 0 dBm and 1.8 Mbps, respectively. However, in [22, 23], the data is transmitted by frequency modulation transmitter which has less reliable because of increasing error and noise when transmitting the data. Accordingly, the reliability of the system mentioned in [22, 23] is less than the presented system in transmitting data.
2.2. Proposed technique for separating of PCG signal
After recording the measured data, two steps are performed to separate the sounds of , , and in PCG signal. The first step is defined with preprocessing (Fig. 3). First, the measured signals are passed on a high pass Butterworth filter with cutoff frequency of 400 Hz to remove high-frequency noise of the signals
| (1) |
Fig. 3.
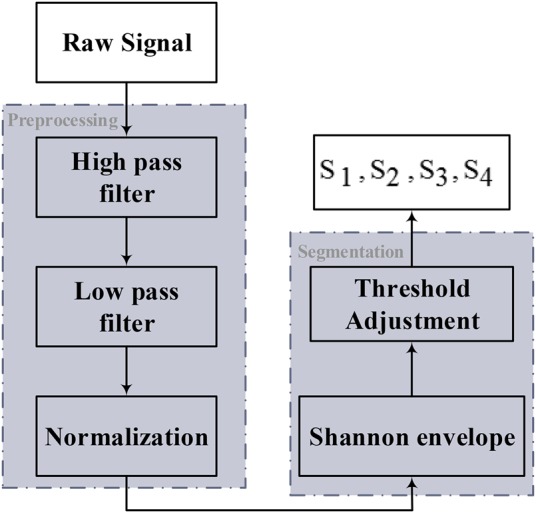
Block diagram of proposed method for separation of , , and
After that, background (baseline) of the signals is removed after passing from a low-pass Butterworth filter with cutoff frequency 20 Hz
| (2) |
Ultimately, the signals are normalised to complete the preprocessing step.
Events’ amplitude accounts an essential specification for enabling the detection of any component of PCG signal that can help to separate some sound from each other. However, the amplitude of the signal made of envelope gives a simpler and more realisable demonstration than the amplitude of original heart sound signals. Accordingly, Shannon envelope can be a very effective procedure in the second step and is defined as
| (3) |
where x(i) is PCG signal. The mean duration of heart sound in Shannon envelop is about 100 and 50 ms for S1–S2 and S3–S4 sounds, respectively [16]. Evaluations demonstrate that a window length with a ratio of these durations will be efficient for detecting the corresponding sounds [13]. and sounds involve features such as impulsive and strong components as well as the most common among the heart sound events. Thus, they should be detected prior to any other event of a public PCG signal using the mentioned specifications and also the average window length of 100 ms. and sounds are other components of a PCG signal that occur occasionally. They have features such as low-frequency content, low energy and shorter duration. For detecting and , an overall procedure similar to the previous method for and based on the mentioned features and also their duration is considered. The and sounds appear close to and , respectively, and also the threshold value of the window width in the time domain is selected on 50 ms. Thus, the sounds of and are extracted. After detecting to any other sound might be classified as a murmur. The murmurs are average duration of heart sound between 150 and 200 ms.
3. Results and discussions
3.1. Accuracy investigation of the developed system
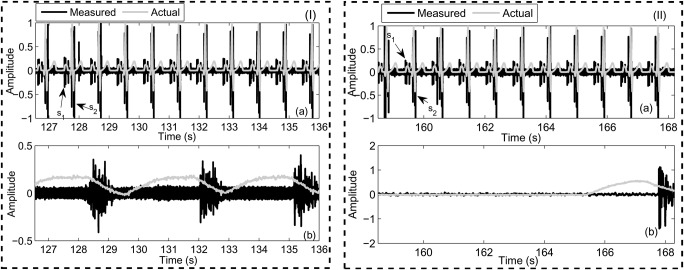
To investigate the accuracy of the developed system, the wireless acoustic sensor is placed on the chest of the volunteer as illustrated in Fig. 1. Beside the sensor, ECG signal was captured from a device in [18] as a gold standard to compare with the heartbeat of the developed system. The ECG apparatus is a one-lead ECG that records data of normal ECG and also can be connected to the PC throughout the USB port for precise evaluation of the measurement data. Also, a belt around the abdomen [19] is used as a gold standard in estimating respiration rate for evaluating the accuracy of the presented system. Two scenarios were performed for the evaluation that in the first scenario, the volunteer is asked to lie down and rest about 540 s while the presented system record the heartbeat and respiration rate. The obtained results show the volunteer's heartbeat was determined 76 beats/min while reparation rate is 20 breaths/min (Fig. 4(I)). In another scenario, the volunteer is wanted to perform the test about 540 s when he holds his breath. The obtained results revealed that respiration rate obtained 5 breaths/min while heartbeat was obtained 68 beats/min (Fig. 4(II)). As the results reveal that the proposed system can measure heart beat and respiration rate. Also, the results showed that heartbeat decreases when the volunteer holds his breath than the first scenario (rest test). The tests were performed on ten other volunteers and similar results were obtained.
Fig. 4.
Snapshot of the obtained results of the developed sensor for two tests including (I) rest and (II) holding breath
a Heartbeat
b Respiration rate
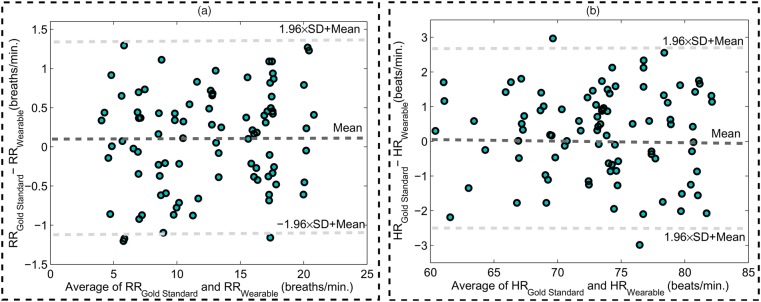
In order to assess the results obtained of the presented system, Bland–Altman analysis [27, 28] is considered. Fig. 5(a) illustrates a Bland–Altman plot of the respiration rate measurements obtained from two scenarios (rest and holding breath) for the 90 pairs of measurements including the presented system and gold standard system. This plot is obtained by the difference and average of the respiration rate measurements from the acquired results. As the results reveal, the mean error is 0.1 breaths/min with 95% limits of agreement −1.13 to 1.33 breaths/min. Also, Bland–Altman plot of the heartbeat measurements from the rest and holding breath tests for the 90 pairs of measurements has shown in Fig. 5(b). In this case, the mean error is 0.24 beats/min with 95% limits of agreement −2.23 to 2.71 beats/min. Considering to the plots, RMSE and STD of the results were obtained 1.26 and 0.63 breaths/min for respiration rate measurement and also 2.27 and 0.93 beats/min for heartbeat measurement, respectively. Accordingly, a very good agreement was obtained between the proposed system and the ECG apparatus in [18] and respiration rate system in [19].
Fig. 5.
Bland–Altman plots. The graphs show the agreement of 90 pairs of measurements. Mean error is shown with slashed dark grey and 95% limits are shown with slashed light grey lines
a Respiration rate
b Heartbeat measurements
3.2. Problem recognition of cardiorespiratory system using the developed system
When the cardiac system is in a complete health state, the major sounds of the PCG signal involve and . Spectral analyses reveal that the frequency components of these sounds have the values in the range 20–200 Hz. However, if the cardiac system contains some diseases such as ejection murmurs, mitral stenosis, then the frequency components of heart sounds will be changed. Generally, the spectrum of cardiac sounds consists of frequencies in the range of 15–700 Hz with considering to the disease [29].
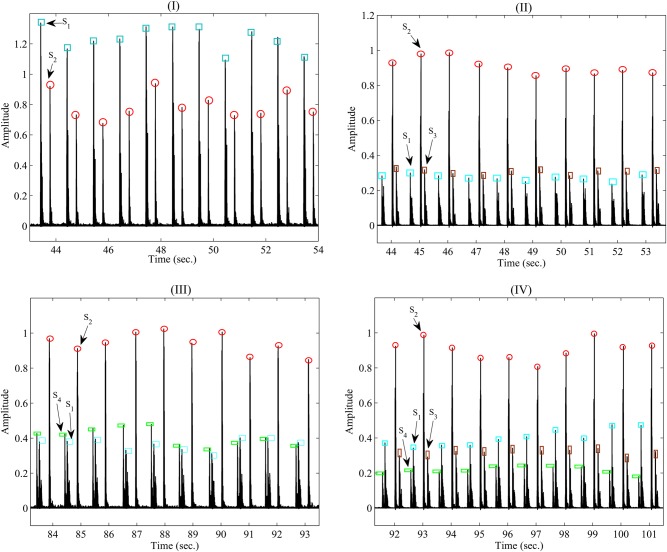
To diagnose a healthy cardiac system, five volunteers are selected to measure their PCG signals. The volunteers consist of one healthy person and four patients. Fig. 6(I) shows the Shannon envelope of PCG signal obtained from the healthy volunteer (test #1) in (3). The parameters of and are extracted using the proposed technique in Section 2.2. The average window length of the sounds ( and ) is 100 ms. As it can be seen, a normal first and second heart sound occurs at 60 beats/min that is repeated in a specific order and are auscultated at the mitral valve area. The first heart sound is produced by the closing of the mitral and tricuspid valve leaflets. While the second heart sound is produced by the closing of the aortic and pulmonic valve leaflets. Additionally, there is no and that prove an abnormal state. Thus, the results show that the volunteer is in good state. In another test, the measured data of a patient (test #2) have been shown in Fig. 6(II) that was acquired using from the bell of the developed stethoscope pressed lightly on the skin of the chest. The results show that three sounds of PCG signal include , and in spite of previous test. The parameter is separate from the parameters of the and based on its features such as low-frequency sound, window length about 50 ms as well as emerging after . The third heart sound is caused by a sudden deceleration of blood flow into the left ventricle from the left atrium. The results also indicate that in the presence of the third heart sound, the first heart sound decreases in intensity while the second heart sound increases in intensity. Although in young people and athletes it is a normal phenomenon, it indicates the presence of congestive heart failure in older individuals. The results obtained of the test are related to older individual with mild mitral insufficiency and it implies an abnormal condition for the person. Fig. 6(III) shows the outcome result of Shannon envelope for another patient (test #3) in another test that obtained utilising the bell of the developed sensor pressed lightly on the skin of the chest. As it can be seen, the fourth heart sound () occurs beside two sounds of and . The fourth heart sound involve significant features such as a low-frequency sound, window width 50 ms and also occurring in late diastole just prior to the first heart sound. Considering to the specifications, the is separated of other sounds of the PCG signal. As the results reveal, intensify of the first heart sound declines while the intensify for the second heart sound increases. The fourth heart sound is made by an increase in stiffness of the left ventricle due to scar tissue formation. This may reveal a manifestation of coronary heart disease. However, the acquired results of the test show that the patient suffers from mild pulmonary insufficiency and imply on abnormal conditions. In the fourth test, the results obtained from one of the other patients (test #4) have shown in Fig. 6(IV). As the measurements indicate both sound of and were appeared beside the others sounds ( and ). Both the third and fourth heart sounds are low frequency and also is lower than , the sounds can be separated of other sounds in PCG signal using technique explained in Section 2.2. The patient suffered from the mild pulmonary and mitral insufficiency. Last test (test #5) shows an example of an innocent murmur beside a normal and in Fig. 7. It was heard with placing bell of the developed stethoscope in the pulmonic area. So, its intensity increased with inspiration. As the results indicate, the murmur is heard in early systole, is of short duration about more than 150 ms and has a frequency range of 120–250 Hz. The short duration and mid-range frequency characterise an innocent murmur and is used to separate the murmur from sounds to . The results are related to a type of murmur with hyperthyroidism. By treating it appropriately, the systolic murmur disappears.
Fig. 6.
Snapshot Shannon envelope of the obtained PCG signal of the developed sensor for four tests, including
a Healthy person in test#1
b Patient with mild mitral insufficiency in test #2
c Patient with mild pulmonary insufficiency in test #3
d Patient with mild mitral and pulmonary insufficiency in test #4
Fig. 7.
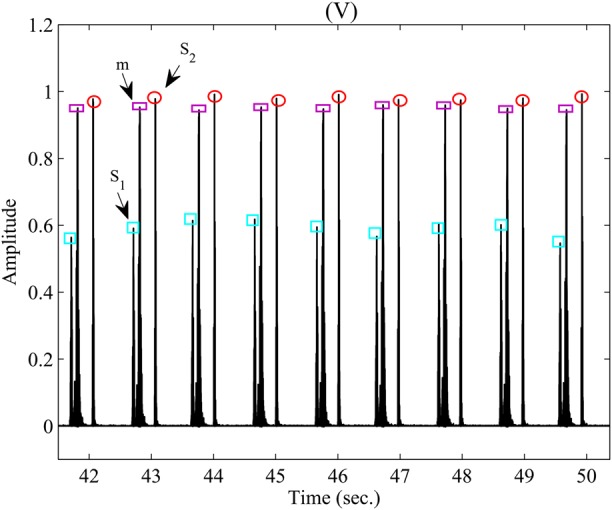
Snapshot Shannon envelope of the obtained PCG signal of the developed sensor for test #5
In order to obtain sensitivity and specificity of the sensor in the five tests, (4) and (5) were defined as follows:
| (4) |
| (5) |
where TP is the number of true sounds which are detected, and FN is the number of missed true sounds. Also, FP is whole other sounds which detected while do not belong to TP group. The obtained results of estimated sound of to utilising the developed sensor for duration 30 s illustrated in Table 1. As it can be obtained from Table 1, the system approximates sounds of to with sensitivity 98.7, 98.1, 98.2, 97 and 98.6% for test #1–#5, respectively. While the specificity for test #1–#5 obtained 98.7, 98.1, 99.1, 98.4 and 97.3% in turn. According to the results, the proposed system can totally detect sound of to with sensitivity and specificity 98.1 and 98.3%, respectively. In comparison to reported works in [13, 16], which were only estimated and , sensitivity of the presented system 3% improved. Additionally, they obtain the PCG data using a commercial sensor. Finally, the results prove the proposed system is a device with high potential for monitoring heartbeat and respiration rate as well as it can be appropriate candidates for identifying abnormal state in the cardiorespiratory system for in-home applications.
Table 1.
Sensitivity and specificity of the developed sensor
| Test | FN | FP | , % | , % | ||||
|---|---|---|---|---|---|---|---|---|
| 1 | 38 | 38 | 0 | 0 | 1 | 1 | 98.7 | 98.7 |
| 2 | 35 | 35 | 32 | 0 | 2 | 2 | 98.1 | 98.1 |
| 3 | 37 | 37 | 0 | 33 | 2 | 1 | 98.2 | 99.1 |
| 4 | 33 | 33 | 31 | 29 | 4 | 2 | 97 | 98.4 |
| 5 | 36 | 36 | 0 | 0 | 1 | 2 | 98.6 | 97.3 |
| total | 179 | 179 | 63 | 62 | 10 | 8 | 98.1 | 98.3 |
4. Conclusions
This Letter presented an extensive description of designing, developing and implementing a miniature acoustic sensor for measuring heartbeat and respiration rate. The prototype, which it has features including compact, small and very light weight, was developed using regular PCB. The system is tested in two scenarios and compared with a gold standard system to calculate accuracy in estimating the respiration rate and heartbeat. The obtained results show the system successfully senses and collects heartbeat and respiration rate with RMSE <2.27 and 0.93 and also STD <1.26, 0.63, respectively. By benefiting of a proposed technique, the sounds of to were separated from together and sensitivity and specificity of the system were determined 98.1 and 98.3% in turn. Accordingly, this system can be easily used as a device for diagnosis of abnormal state for healthcare applications.
5. Funding and declaration of interests
None declared.
6 References
- 1.Patel M., Wang J.: ‘Applications, challenges, and prospective in emerging body area networking technologies’, IEEE Wirel. Commun. Mag., 2010, 17, (1), pp. 80–88 (doi: 10.1109/MWC.2010.5416354) [Google Scholar]
- 2.Pantelopoulos A., Bourbakis N.G.: ‘A survey on wearable sensor-based systems for health monitoring and prognosis’, IEEE Trans. Syst. Man Cybern. Part C (Appl. Rev.), 2010, 40, (1), pp. 1–12 (doi: 10.1109/TSMCC.2009.2032660) [Google Scholar]
- 3.Li K.F.: ‘Smart home technology for telemedicine and emergency management’, J. Ambient Intell. Human. Comput., 2013, 4, (5), pp. 535–546 (doi: 10.1007/s12652-012-0129-8) [DOI] [PMC free article] [PubMed] [Google Scholar]
- 4.Amadi-Obi A., Gilligan P., Owens N., et al. : ‘Telemedicine in pre-hospital care: a review of telemedicine applications in the pre-hospital environment’, Int. J. Emergency Med., 2014, 7, (1), p. 1 (doi: 10.1186/s12245-014-0029-0) [DOI] [PMC free article] [PubMed] [Google Scholar]
- 5.Abbasi-Kesbi R., Nikfarjam A., Memarzadeh-Tehran H.: ‘A patient-centric sensory system for in-home rehabilitation’, IEEE Sens. J., 2017, 17, (2), pp. 524–533 (doi: 10.1109/JSEN.2016.2631464) [Google Scholar]
- 6.Gonzales L., Walker K., Keller K., et al. : ‘Textile sensor system for electrocardiogram monitoring’. Virtual Conf. Applications of Commercial Sensors (VCACS), 2015, pp. 1–4 [Google Scholar]
- 7.Valipour A., Abbasi-Kesbi R.: ‘A heartbeat and respiration rate sensor based on phonocardiogram for healthcare applications’. 25th Iranian Conf. Electrical Engineering (ICEE), Tehran, Iran, May 2017, pp. 45–48 [Google Scholar]
- 8.Cfková R.: ‘Advantages and disadvantages of ECG diagnosis in left ventricular hypertrophy’, Vnitrni lekarstvi, 2002, 48, (1), pp. 103–108 [PubMed] [Google Scholar]
- 9.Haescher M., Matthies D.J., Trimpop J., et al. : ‘A study on measuring heart-and respiration-rate via wrist-worn accelerometer-based seismocardiography (SCG) in comparison to commonly applied technologies’. Proc. 2nd Int. Workshop on Sensor-Based Activity Recognition and Interaction, 2015, p. 2 [Google Scholar]
- 10.Salerno D.M., Zanetti J.: ‘Seismocardiography for monitoring changes in left ventricular function during ischemia’, Chest, 1991, 100, (4), pp. 991–993 (doi: 10.1378/chest.100.4.991) [DOI] [PubMed] [Google Scholar]
- 11.Inan O.T., Migeotte P.F., Park K.S., et al. : ‘Ballistocardiography and seismocardiography: a review of recent advances’, IEEE J. Biomed. Health Inform., 2015, 19, (4), pp. 1414–1427 (doi: 10.1109/JBHI.2014.2361732) [DOI] [PubMed] [Google Scholar]
- 12.Springer D.B., Brennan T., Hitzeroth J., et al. : ‘Robust heart rate estimation from noisy phonocardiograms’. Computing in Cardiology Conf. (CinC), 2014, pp. 613–616 [Google Scholar]
- 13.Kumar D., Carvalho P., Antunes M., et al. : ‘Detection of S1 and S2 heart sounds by high frequency signatures’. 28th Annual Int. Conf. IEEE Engineering in Medicine and Biology Society, EMBS'06, 2006, pp. 1410–1416 [DOI] [PubMed] [Google Scholar]
- 14.Brusco M., Nazeran H.: ‘Digital phonocardiography: a PDA-based approach’. 26th Annual Int. Conf. IEEE Engineering in Medicine and Biology Society, IEMBS'04, 2004, vol. 1, pp. 2299–2302 [DOI] [PubMed] [Google Scholar]
- 15.Abbas A.K., Bassam R.: ‘Phonocardiography signal processing’, Synth. Lect. Biomed. Eng., 2009, 4, (1), pp. 1–194 (doi: 10.2200/S00187ED1V01Y200904BME031) [Google Scholar]
- 16.Chakir F., Jilbab A., Nacir C., et al. : ‘Detection and identification algorithm of the S1 and S2 heart sounds’. 2016 Int. Conf. Electrical and Information Technologies (ICEIT), 2016, vol. 11, pp. 418–420 [Google Scholar]
- 17.Cosoli G., Casacanditella L., Tomasini E.P., et al. : ‘Heart rate assessment by means of a novel approach applied to signals of different nature’, J. Phys. Conf. Ser., 2017, 778, (1), p. 012001 (doi: 10.1088/1742-6596/778/1/012001) [Google Scholar]
- 18. ‘Products: M-80’, Beurer Germany, Hallandale Beach, Florida. Available at https://www.beurer.com .
- 19. ‘Respiration monitor belt’, Vernier Software & Technology, Beaverton, Florida. Available at https://www.beurer.com .
- 20.Bifulco P., Gargiulo G.D., d'Angelo G., et al. : ‘Monitoring of respiration, seismocardiogram and heart sounds by a PVDF piezo film sensor’, Measurement, 2014, 11, pp. 786–789 [Google Scholar]
- 21.Boyle J., Bidargaddi N., Sarela A., et al. : ‘Automatic detection of respiration rate from ambulatory single-lead ECG’, IEEE Trans. Inf. Technol. Biomed., 2009, 13, (6), pp. 890–896 (doi: 10.1109/TITB.2009.2031239) [DOI] [PubMed] [Google Scholar]
- 22.Pawar C.K., Chaskar U.M.: ‘FM based electronic digital stethoscope using DSP’. Int. Conf. Control, Instrumentation, Communication and Computational Technologies (ICCICCT), 2014, pp. 538–542 [Google Scholar]
- 23.Arathy R., Gowriprabhal V., Vysakh V.: ‘PC based heart sound monitoring system’, Int. J. Comput. Appl. Found. Comput. Sci., 2013, 83, (16), pp. 217–238 [Google Scholar]
- 24.Abbasi-Kesbi R., Nikfarjam A.: ‘A mini wearable wireless sensor for rehabilitation applications’. 2015 3rd RSI Int. Conf. Robotics and Mechatronics (ICROM), 2015, pp. 618–622 [Google Scholar]
- 25.Abbasi-Kesbi R., Nikfarjam A.: ‘Denoising MEMS accelerometer sensors based on L2-norm total variation algorithm’, Electron. Lett., 2017, 53, (5), pp. 322–324 (doi: 10.1049/el.2016.3811) [Google Scholar]
- 26.nRF24L01 Product Specification V2.0: ‘Nordic semiconductor’
- 27.Atkinson G., Nevill A.M.: ‘Statistical methods for assessing measurement error (reliability) in variables relevant to sports medicine’, Sports Med., 1998, 26, (4), pp. 217–238 (doi: 10.2165/00007256-199826040-00002) [DOI] [PubMed] [Google Scholar]
- 28.Abbasi-Kesbi R., Memarzadeh-Tehran H., Deen M.J.: ‘A technique to estimate the human reaction time based on visual perception’, Healthcare Technol. Lett., 2017, 4, (2), pp. 73–77 (doi: 10.1049/htl.2016.0106) [DOI] [PMC free article] [PubMed] [Google Scholar]
- 29.Naseri H., Homaeinezhad M.R.: ‘Detection and boundary identification of phonocardiogram sounds using an expert frequency-energy based metrice’, Ann. Biomed. Eng., 2013, 41, (2), pp. 279–292 (doi: 10.1007/s10439-012-0645-x) [DOI] [PubMed] [Google Scholar]


