Abstract
Molecular imaging probes such as PET-tracers have the potential to improve the accuracy of tumor characterization by directly visualizing the biochemical situation. Thus, molecular changes can be detected early before morphological manifestation. The A3 adenosine receptor (A3AR) is described to be highly expressed in colon cancer cell lines and human colorectal cancer (CRC), suggesting this receptor as a tumor marker. The aim of this preclinical study was the evaluation of [18F]FE@SUPPY as a PET-tracer for CRC using in vitro imaging and in vivo PET imaging. First, affinity and selectivity of FE@SUPPY and its metabolites were determined, proving the favorable binding profile of FE@SUPPY. The human adenocarcinoma cell line HT-29 was characterized regarding its hA3AR expression and was subsequently chosen as tumor graft. Promising results regarding the potential of [18F]FE@SUPPY as a PET-tracer for CRC imaging were obtained by autoradiography as ≥2.3-fold higher accumulation of [18F]FE@SUPPY was found in CRC tissue compared to adjacent healthy colon tissue from the same patient. Nevertheless, first in vivo studies using HT-29 xenografts showed insufficient tumor uptake due to (1) poor conservation of target expression in xenografts and (2) unfavorable pharmacokinetics of [18F]FE@SUPPY in mice. We therefore conclude that HT-29 xenografts are not adequate to visualize hA3ARs using [18F]FE@SUPPY.
1. Introduction
Colorectal cancer (CRC) is the fourth leading cause of cancer-related deaths in men and women worldwide [1]. The primary diagnosis is usually made by colonoscopy and biopsy, which often does not reflect the full extent of the disease due to tumor heterogeneity and disregard of potential metastases. Positron Emission Tomography (PET) provides a noninvasive imaging technique, which is valuable for tumor staging and clinical decision making and to estimate the patient's prognosis [2]. Besides the routinely used PET-tracer [18F]FDG, the availability of specific tumor tracers would enhance the characterization of colorectal tumors and help in CRC staging and with the choice of treatment.
An essential characteristic of most solid tumors is hypoxia, which inevitably leads to accumulation of adenosine within the tumor microenvironment as a result of the breakdown of adenine nucleotides, which has been recognized in the 1990s [3, 4]. Since then, many efforts have been made to clarify the role of adenosine and its receptors in cancer [5–7]. The expression of the A3 adenosine receptor (A3AR), which is one of four subtypes of the adenosine receptor family, has been reported in several human tumor cell lines including leukemia (Jurkat T, HL-60), melanoma (A375), and astrocytoma (ADF) [8–12]. In particular, there is a rising interest in the involvement of A3ARs in CRC as A3AR protein expression has been reported for various colon cancer cell lines, including Caco-2, HCT-116, CCL-228, DLD-1, and HT-29 [13–15]. Merighi et al. have shown that caffeine leads to hypoxia-inducible factor-1 (HIF-1) protein accumulation and increased vascular endothelial growth factor (VEGF) expression through A3AR stimulation in HT-29 cells under hypoxic conditions [16]. According to Sakowicz-Burkiewicz et al., treatment with the A3AR agonist IB-MECA (1 μM) results in an A3AR-dependent growth promoting effect in HT-29 cells. In contrast, IB-MECA causes cell apoptosis in HCT-116 cells, similarly in an A3AR dependent manner [13].
High expression of A3AR mRNA and protein has been reported in colon and breast carcinoma compared to adjacent nonneoplastic tissue by Madi et al. Remarkably, even higher levels of A3AR mRNA have been found in lymph node metastases than in primary tumor tissue, suggesting A3AR-overexpression as a marker for tumor progression [17]. Additionally, Gessi et al. studied A3AR expression in colorectal cancer tissue samples of 73 patients and provided evidence that the A3AR has the potential to be used as a diagnostic marker for colon cancer. The authors have shown ≥2-fold increased A3AR protein expression in primary colon carcinomas compared to normal mucosa and describe a tendency towards higher A3AR expression in large adenomas compared to small adenomas. Therefore, the authors proposed a major role of the A3AR in cancer aggressiveness [18]. Moreover, radioligand binding experiments using the A3AR antagonist [3H]MRE 3008F20 and western blot analysis indicated that the A3AR is the most abundant of all four adenosine receptor subtypes in colorectal cancer tissues as well as in colon cancer cell lines (Caco-2, DLD-1 and HT-29). On the contrary, RT-PCR experiments showed relatively low levels of A3AR mRNA in the mentioned colon cancer cell lines compared to mRNA levels of the other adenosine receptor subtypes [15]. As mRNA levels do not necessarily correlate with protein levels [19] and protein transcription is a prerequisite for targeted receptor imaging approaches such as PET imaging, protein expression data is the most relevant for this study.
The A3AR antagonist [18F]FE@SUPPY has been presented as the first PET-tracer for hA3AR imaging in 2008 by Wadsak et al. [20, 21]. First preclinical PET imaging using CHO-K1-hA3AR xenografts has shown promising results leading to further evaluation of this PET-tracer in oncology [22]. Besides [18F]FE@SUPPY and [18F]FE@SUPPY:2, only a few other PET-ligands have been proposed for A3AR imaging, including carbon-11 labeled 1,2,4-triazolo[4,3-a]quinoxalin-1-one derivatives and bromine-76 labeled nucleoside ligands ([76Br]MRS3581 and [76Br]MRS5147) [23–25]. To our knowledge, no preclinical in vivo PET imaging has been reported for these A3AR PET-ligands so far. In our preclinical study, we aimed to evaluate [18F]FE@SUPPY as a PET-tracer for human cancer using in vitro imaging and in vivo PET imaging in a CRC tumor model.
2. Methods
2.1. General
2.1.1. Cell Culture
HT-29 cells and CHO-K1 cells were purchased from ATCC. HT-29 cells were cultured in RPMI 1640 medium supplemented with 10% fetal calf serum, 2 mM L-glutamine, and 10 μg/mL gentamicin sulfate. Human A3 adenosine receptor-expressing CHO-K1 cells (CHO-K1-hA3AR) were purchased from PerkinElmer (ValiScreen® GPCR cell line) and were grown using Ham's F12 supplemented with 10% FCS, 2 mM L-glutamine, penicillin (100 U/M), streptomycin (100 μg/mL), and 0.4 mg/mL G418. Parental CHO-K1 cells were cultured likewise, but without selection antibiotics. Cells were maintained under standard conditions in a humidified incubator (37°C, 5% CO2).
2.1.2. Animals
Six-week-old male BALB/c mice (BALB/cAnNRj, Division of Laboratory Animal Science and Genetics, Himberg, Austria) were kept under conventional housing conditions, with food and water supply ad libitum and a 12 h day/night cycle. Male, immunodeficient CB17-SCID mice (CB-17/Icr-Prkdcscid/Rj, Janvier Labs, France) of the same age were kept under specific pathogen-free conditions in individually ventilated cages. All animals were treated according to the European Union rules on animal care. The corresponding animal experiments were approved by the Austrian Ministry of Sciences (BMWFW-66.009/0031-WF/V/3b/2015, BMWFW-66.009/0029-WF/V/3b/2015).
2.1.3. Tumor Grafting
After 10 to 14 days upon arrival, CB17-SCID mice were injected subcutaneously with 2 × 10⁶ HT-29 cells into one flank and 2 × 10⁶ CHO-K1 cells in the opposite flank (n = 9). Body weight and tumor development were monitored every second day by caliper measurement. The respective tumor volume was calculated according to the following equation: tumor volume (mm3) = d2 × D/2 (where d is the shortest diameter and D the longest diameter). Animals were subjected to μPET imaging 10 days after inoculation, when tumors reached a volume of at least 300 mm3. Tumor volume never exceeded 1 cm3.
2.1.4. Human Tissues
Colorectal carcinoma tissue and adjacent healthy colon tissue were obtained directly after tumorectomy from two patients after full informed consent and quick-frozen in 2-methylbutane (−40°C). Tissue was sliced into 16 μm slices using a microcryotome (Thermo Scientific Microm HM 560) and stored at −80°C until usage. Depending on the sample size, 3 to 4 different regions were defined and analyzed by means of autoradiography and immunohistochemistry.
2.2. Characterization of Binding and Target Expression
2.2.1. Competitive Binding Assay
Competitive binding assays were performed using hA1AR, hA2AAR, or hA3AR expressing cell membranes (18.5 ng/μL, 16.7 ng/μL, or 1.7 ng/μL final protein concentration, resp.) and 1.7 nM [3H]DPCPX (KD = 1.7 nM), 50 nM [3H]CGS21680 (KD = 23 nM), or 0.4 nM [125I]AB-MECA (KD = 0.78 nM) as the respective radioligands (all purchased from PerkinElmer, Inc. Waltham, USA). The assay was performed according to the manufacturer's instructions in a final volume of 500 μL. Increasing concentrations of test compounds were added, whereby the concentration of dimethyl sulfoxide (DMSO) in final assay volume remained ≤10% (hA1AR and hA2AAR assay) and ≤1% in the hA3AR assay. Nonspecific binding was determined using 1 μM DPCPX (hA1R assay), 1 μM SCH-442,416 (hA2AR assay), or 10 μM I-AB-MECA (hA3AR assay). Filtration through GF/B filters (Whatman®, presoaked in 0.1% PEI or 0.5% BSA) was performed using a cell harvester (Brandel®), and receptor-bound radioactivity was determined via gamma counting (2480 Wizard2, PerkinElmer) or liquid scintillation counting (Hidex 300 SL). IC50 fitted binding curves were generated using the GraphPad Software 5.0, and Ki values were calculated using the Cheng-Prusoff equation.
2.2.2. Flow Cytometry
For the flow cytometric evaluation of hA3AR expression, single-cell suspensions of HT-29 cells (2 × 10⁵ per tube) were fixed and permeabilized using Cytofix/Cytoperm™ kit (BD Biosciences). Cells were incubated with mouse monoclonal anti-human A3AR (100 μL of 4 μg/mL in PBS + 2% FCS, Abnova H00000140-M01) or mouse IgG2b kappa isotype control (100 μL of 4 μg/mL in PBS + 2% FCS, eBioscience™ 14-4732-85) for 1 h at 4°C. Following a washing step, bound primary antibodies were detected with rabbit anti-mouse IgG FITC (100 μL of 40 μg/mL in PBS + 2% FCS, Dako F0261) for 30 min at 4°C in the dark. Samples were analyzed on a FACSCalibur™ flow cytometer (BD Bioscience), whereby 10,000 single cells were recorded.
2.2.3. Western Blot
Cell lysates were prepared from 75 cm2 cell culture flasks when cells reached 80% confluency using radioimmunoprecipitation assay (RIPA) buffer and protease inhibitor cocktail according to the manufacturer's instructions. Tissue lysates from HT-29 xenografts were prepared according to a standard protocol using RIPA buffer (according to sample size approx. 4 times of lysis buffer), protease inhibitor, and Ultra-Turrax® for homogenization. The protein concentration of cell lysates was determined using Pierce™ BCA Protein Assay Kit (Thermo Scientific), and 20 μg protein per well was loaded onto TGX™ precast gels (Bio-Rad). After gel electrophoresis (200 V, 30 min), proteins were transferred to nitrocellulose membranes (Amersham™ Protran™ Premium 0.2 μm NC, GE Healthcare Life Sciences) via semidry blotting (80 mA per gel). Membranes were incubated with rabbit polyclonal anti-A3AR (Santa Cruz Biotechnology, Inc. sc-13938) (1 : 750, 2 h, RT) and further incubated with goat anti-rabbit IgG HRP conjugate (1 : 5000, 1 h, RT). Detection was performed using the dedicated kit (SuperSignal West Pico Chemiluminescent Substrate detection kit, Thermo Scientific), and chemiluminescence imaging was conducted (Bio-Rad VersaDoc™ Imaging System).
2.3. In Vitro Imaging
2.3.1. Immunofluorescence Microscopy
HT-29 cells were seeded on chamber slides (3 × 10⁵/mL, 200 μL per well, 8 well slides) and incubated at 37°C until 50% confluency was reached. Cells were then fixed (4% paraformaldehyde in PBS, 15 min, 4°C), permeabilized (0.2% Triton X in PBS, 2 min, room temperature (RT)), and blocked (2% FCS in PBS, 30 min, RT). Mouse monoclonal anti-human A3AR (Abnova H00000140-M01) and mouse IgG2b kappa isotype control (eBioscience 14-4732-85) were used 1 : 50 in PBS + 2% FCS and incubated for 1 h at RT. Cells were washed three times with PBS and incubated with the secondary antibody (rabbit anti-mouse IgG FITC, Dako F0261) for 1 h at RT. After washing, cells were incubated with DAPI (1 : 5000) for 10 min at RT, and subsequently, slides were embedded with an aqueous mounting medium (Fluoromount™, Sigma F4680). Slides were recorded on an Axioplan II fluorescence microscope (Carl Zeiss Microscopy).
2.3.2. Autoradiography
Tissue slices were thawed and reconstituted in assay buffer (50 mM Tris-HCl pH 7.4, 100 mM NaCl, 1 mM EDTA, 1% BSA, 1 unit adenosine deaminase/100 mL) for 30 min at RT. Radiosynthesis of [18F]FE@SUPPY was performed as previously described and the product was physiologically formulated (EtOH/0.9% saline 10/90) [20]. Tissue slices were incubated with 50 kBq [18F]FE@SUPPY (40–200 GBq/μmol) in 100 μL assay buffer for 1 h at RT. Slices were thoroughly washed with ice-cold wash buffer (50 mM Tris-HCl pH 7.4), dried, and exposed to a phosphor screen overnight. The readout of the phosphor storage screen was performed on a Cyclone Phosphor Imager (Perkin Elmer), and data analysis was performed using OptiQuant® Software as previously described [26]. Statistical testing was performed using GraphPad Prism 5.0 Software. Differences among groups (colorectal cancer versus healthy colon) were analyzed using a two-tailed, unpaired Student's t-test with Welch's correction.
2.3.3. Immunohistochemistry
Vicinal cryosections of colorectal carcinoma and healthy colon tissue were stained to identify regions with hA3AR expression following a standard protocol. In brief, cryosections were fixed (96% ethanol, 10 min), permeabilized (0.2% Triton X-100 in PBS, 5 min), and blocked using Bloxall™ Blocking Solution and a dedicated avidin/biotin blocking kit (Invitrogen, Thermo Fisher Scientific). Additionally, sections were incubated with goat serum (1 : 10 in PBS) to reduce nonspecific binding. Rabbit polyclonal anti-A3AR (1 : 100, ab203298; Abcam) was used 1 : 100 in PBS + 0.1% BSA for 1 h in a humid, dark chamber. Purified rabbit IgG (Life technologies) was used as an isotype control likewise. Cryosections were washed 3 times for 5 min (PBS + 0.1% Tween-20) and incubated with biotinylated anti-rabbit IgG (1 : 200, PBS + 5% goat serum) for 30 min. After washing, further detection was performed with the Vectastain® ABC kit (Vector Laboratories) according to the manufacturer's instructions. DAB substrate kit (Abcam) was used as a chromogen to detect peroxidase, and haematoxylin was used for counterstaining of cell nuclei. Immunohistochemically stained slides were acquired on an automated TissueFAXS microscope system (TissueGnostics, Vienna, Austria) at a 5-fold and 20-fold magnification.
2.4. Tracer Stability in Mice
2.4.1. In Vitro Stability Tests
Stability of [18F]FE@SUPPY was tested against mouse liver microsomes, mouse S9 fraction, and mouse plasma (BD Sciences). Amount of intact tracer (%) was determined after 5, 10, 20, 40, 60, and 120 min using an Agilent series 1100/1200 HPLC system connected to a radioactivity detector (Raytest, Ramona Star) (n = 2 in triplicate). The assay was conducted as previously described for respective rat and human enzymes [27].
2.4.2. Ex Vivo Blood Stability
Radiosynthesis was performed as described elsewhere [20] and the product was processed as follows: ethanol was totally evaporated and the dry product was again physiologically formulated in 1.5–2 mL Tween-20/EtOH/0.9% saline 1/9/90 to obtain activity concentrations of approximately 1 GBq/mL. Healthy BALB/c mice were injected with 18 ± 2 MBq (molar activity = 70–200 GBq/μmol) retroorbitally and sacrificed after 5, 10, 20, 40, and 70 min (n = 3 for each time point). Blood samples were collected and immediately precipitated using acetonitrile/methanol (10 : 1) and centrifuged (12,000 rpm, 5 min, 4°C). The obtained supernatants were subjected to radio-HPLC as previously described [22].
2.5. Biodistribution
Ex vivo biodistribution of [18F]FE@SUPPY was assessed 70 min after tracer application in BALB/c mice. Radioactivity was determined using a gamma counter (2480 Wizard2, PerkinElmer), organs were wet-weighted, and percentage of injected dose per gram of organ was calculated (%ID/g).
2.6. In Vivo Imaging
Xenograft-bearing CB17-SCID mice were anesthetized using isoflurane (2.5%) mixed with oxygen (1.5 L/min) to avoid movement during the imaging. Blocking agents (2 mg/kg BW FE@SUPPY or MRS1523) or the respective vehicle control (Tween-20/EtOH/0.9% physiological saline 1/9/90) was administered retroorbitally 2 min prior to the radiotracer administration (n = 3 per group). Subsequently, the animals received another retroorbital injection of 17.42 ± 4.5 MBq [18F]FE@SUPPY into the venous plexus of the opposite eye. With a minor delay after the application of the radiotracer (2-3 min), mice were placed into the field of view of the scanner (μPET/CT Inveon, Siemens Medical Solution, Knoxville, USA), and dynamic imaging was performed for 60 min to follow tracer distribution. Vital parameters (respiration, body temperature) were continuously monitored using a dedicated monitoring unit (bioVet; m2m imaging, Cleveland, OH, USA) to ensure the depth of anesthesia and wellbeing of the animals. Retroorbital application volumes did not exceed 100 μL per application.
3. Results and Discussion
3.1. Characterization of Binding and Target Expression
Affinity and selectivity of FE@SUPPY and its potential metabolites upon cleavage by carboxylesterases, DFE@SUPPY, and FE@SUPPY:11 [28] were determined in competitive binding assays. FE@SUPPY has been first described by Li et al., who reported a Ki value of 4.22 ± 0.7 nM for human A3AR. However, this study only provided the selectivity ratio towards rat A1AR (rA1AR/hA3AR = 7400) [29]. Here, we confirmed the affinity of FE@SUPPY towards the human A3AR (Ki = 6.02 ± 0.4 nM, n = 3) and demonstrated its selective hA3AR binding compared to the other human adenosine receptors. Moreover, the respective theoretical metabolites show little affinity for the hA3AR, supporting the potential of FE@SUPPY as a ligand for human in vivo application (Table 1).
Table 1.
Affinity and selectivity data of FE@SUPPY and metabolites towards adenosine receptor subtypes (n = 3–5 in triplicate; amount of DMSO never exceeded 1% of total assay volume in hA3AR assay; DMSO was added up to 10% in hA1AR and hA2AAR assay;∗n = 2 in triplicate; exact Ki value could not be determined due to limited solubility).
| Compound | hA1AR | hA2AAR | hA3AR | hA1/hA3AR | hA2A/hA3AR |
|---|---|---|---|---|---|
| FE@SUPPY | 4.03 ± 1.0 µM | 1.72 ± 0.4 µM | 6.02 ± 0.4 nM | 669 | 285 |
| DFE@SUPPY | 5.46 ± 0.4 µM | 37.13 ± 16 µM | 2.58 ± 1.2 µM | 324 | 112 |
| FE@SUPPY:11 | ≥57 µM∗ | 5.86 ± 0.8 µM | 2.80 ± 1.4 µM | ≥20 | 2 |
The human colorectal adenocarcinoma cell line (HT-29) was characterized regarding its hA3AR protein expression using flow cytometry and western blot. Flow cytometric analysis resulted in mean fluorescence intensity (ΔMFI) of 53.6 ± 22 in three independent experiments (Figure 1). Additionally, A3AR protein expression in HT-29 cells was determined by western blot (Figure 8) (western blot results are discussed separately below). This is in line with previous studies, which reported A3AR expression for this cell line as well [13, 15]. Thus, HT-29 cells were subsequently chosen for tumor graft experiments.
Figure 1.
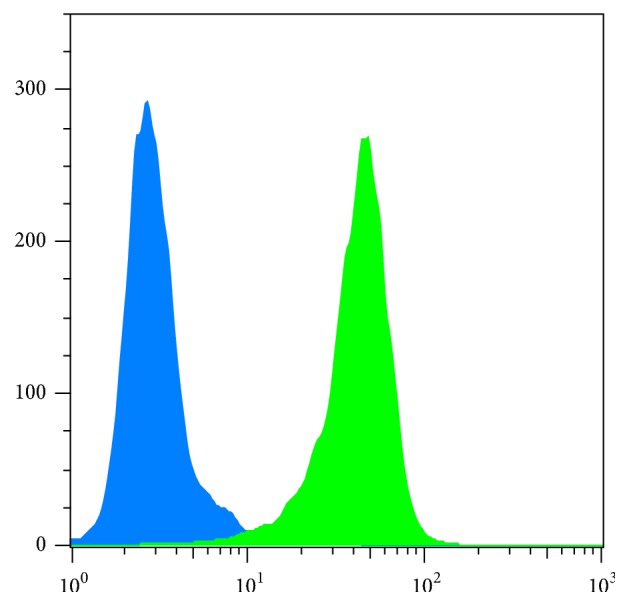
Flow cytometric analysis of HT-29 cells revealed expression of hA3AR protein (green). The isotype control did not show fluorescence signal (blue).
Figure 8.
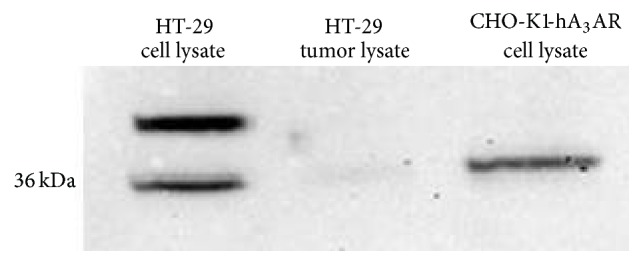
Western blot analysis of HT-29 cell lysate and tissue lysate derived from HT-29 xenograft tumors. CHO-K1-hA3AR cell lysate was loaded as a positive control. An additional bond of unknown identity was detected in HT-29 cell lysate.
3.2. In Vitro Imaging
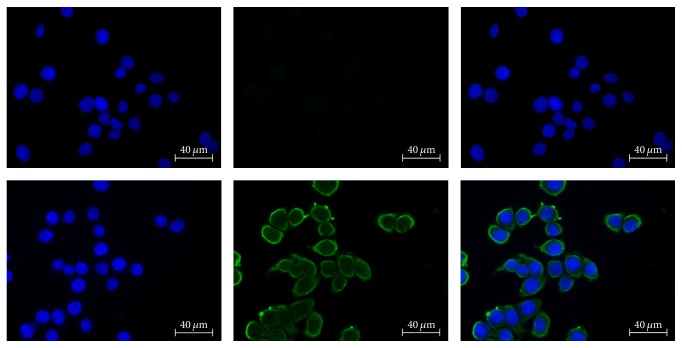
Fluorescence microscopy of HT-29 cells showed cell membrane-specific staining, pointing at the expression of hA3AR on the cell surface, which is typical for GPCRs (Figure 2).
Figure 2.
Immunofluorescent staining of HT-29 cells; left: DAPI, middle: FITC, right: merge. Upper row: mouse isotype control, lower row: anti-human A3AR staining.
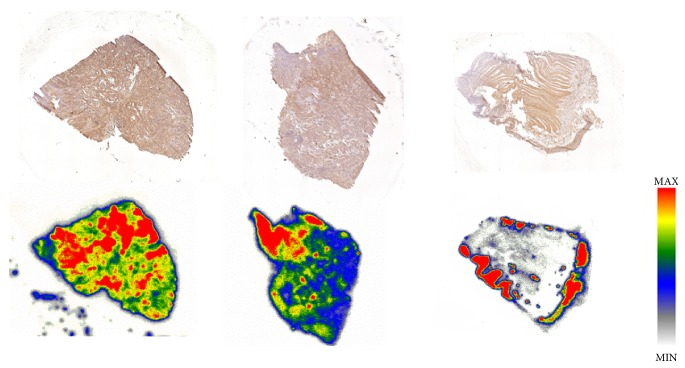
In all investigated regions of the two CRC patients, [18F]FE@SUPPY accumulation was higher in colorectal carcinoma tissue slices than in healthy colon tissue slices of the same individual (for detailed analysis see supplementary (available here)). In 5 of 7 regions, a ≥2.3-fold higher binding of [18F]FE@SUPPY was found (P < 0.05). This finding is in accordance with Gessi et al., who reported similar ratios by means of [3H]MRE 3008F20 binding [18]. Regions with high accumulation of [18F]FE@SUPPY corresponded to regions with high hA3AR expression identified by immunohistochemistry (Figure 3).
Figure 3.
Upper row: immunohistochemical staining of hA3AR. Lower row: autoradiographic analysis of the corresponding vicinal tissue slices using [18F]FE@SUPPY. Left and center: colon cancer tissue, right: healthy colon tissue.
3.3. Tracer Stability in Mice
[18F]FE@SUPPY exhibited high stability in mouse plasma, as 92.6 ± 0.7% of intact tracer could still be detected after 120 min of incubation at 37°C. In vitro stability tests against mouse liver homogenates (S9 fraction) and purified mouse liver microsomes showed 66.9 ± 6.7% and 31.4 ± 7.8% intact tracer after 120 min, respectively. Ex vivo blood stability analysis demonstrated more rapid degradation of [18F]FE@SUPPY in vivo than that observed in in vitro testing as only 2.2 ± 0.4% intact [18F]FE@SUPPY could be determined after 70 min (Figure 4). This data indicates higher metabolism in mice compared to rats described in previously conducted studies, where 25.8 ± 5.3% intact tracer was found in plasma after 60 min [22]. However, these data could also be mimicked by the fact that intact [18F]FE@SUPPY is rapidly cleared from blood hepatobiliary (into the bile fluid, compare Figures 5 and 7), and the equilibrium in blood is therefore shifted to the metabolites.
Figure 4.
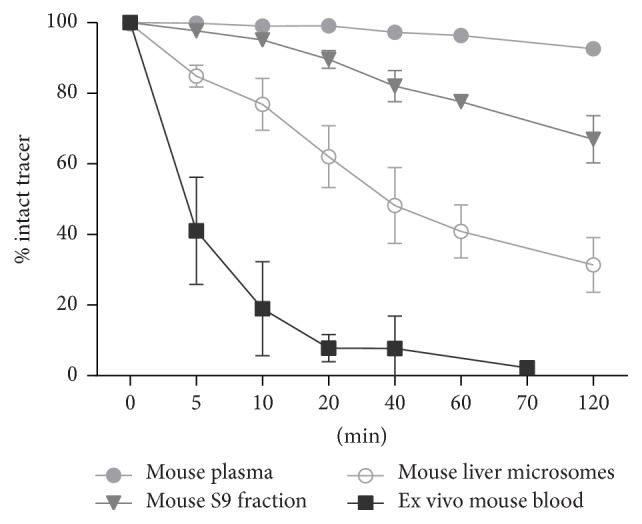
In vitro stability and ex vivo blood stability of [18F]FE@SUPPY.
Figure 5.
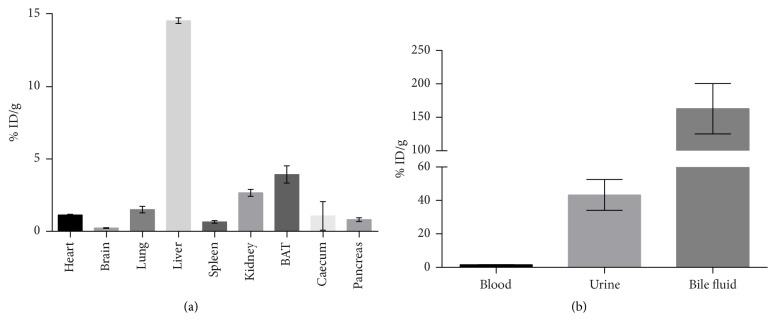
Biodistribution of [18F]FE@SUPPY in healthy BALB/c mice (n = 3). (a) shows biodistribution in organs. (b) shows accumulation in body liquids.
Figure 7.
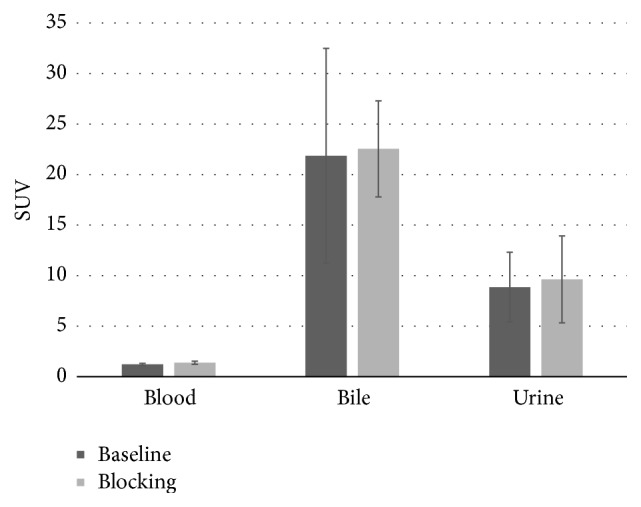
μPET-imaging was performed for 60 min. Activity concentration of [18F]FE@SUPPY in body liquids is expressed as standardized uptake value (SUV). Blocking experiments, shown in the figure, were performed using unlabeled FE@SUPPY. Blocking experiments using MRS1523 provided the same outcome and are not shown in the figure.
3.4. Biodistribution
Biodistribution was assessed 70 min after tracer application in healthy BALB/c mice and revealed a high accumulation of radioactivity in fat-rich regions (brown adipose tissue, BAT) likely due to the tracer's lipophilicity [30]. Regarding the emunctory organs, liver showed the highest accumulation (14.57 ± 0.20% ID/g), followed by the kidneys (2.67 ± 0.24% ID/g). The additional analysis of body liquids pointed at a mainly hepatobiliary excretion of [18F]FE@SUPPY, as the highest amount was found in bile fluid (162.78 ± 37.51% ID/g). The amount of radioactivity in the kidneys and urine (43.33 ± 9.23% ID/g) suggests the excretion of the hydrophilic radioactive metabolite, 2-[18F]fluoroethanol [31], which was already proposed by Haeusler et al. [28]. The circulating radioactivity in blood was low after 70 min (1.6 ± 0.1% ID/g). This finding is in accordance with the results obtained by the ex vivo blood analysis. Moreover, pronounced accumulation of [18F]FE@SUPPY was found in A3AR rich tissues such as the heart (1.13 ± 0.04% ID/g) and lung (1.50 ± 0.23% ID/g). A similar biodistribution pattern was observed for rats in a previously conducted study [20]. [18F]FE@SUPPY accumulation in the brain was low after 70 min (0.23 ± 0.03% ID/g) (Figure 5).
3.5. In Vivo Imaging
μPET imaging of the mouse xenograft model revealed high uptake of [18F]FE@SUPPY in the emunctory organs, which was again most pronounced in the liver (SUV = 6.68 ± 0.80). Low standardized uptake values were observed in tumor masses of both HT-29 and CHO-K1 xenograft tumors (SUV = 0.23 ± 0.06 and 0.25 ± 0.33), respectively. There was no difference between CHO-K1 xenografts, which served as a negative control (human A3AR negative), and HT-29 xenografts. Moreover, significant blocking could not be achieved (Figure 6). The affinity of FE@SUPPY for the mouse A3AR is uncertain but is expected to be lower than that for the human A3AR due to the known species differences. The lack of adequate rodent models, mainly due to the low affinity of most hA3AR ligands to the rodent A3AR, was already recognized by Yamano et al. who proposed a humanized mouse model [32]. Specific uptake was therefore not expected in mouse tissues. Interestingly, a significant influence of the blocking was observed in BAT (decrease in uptake) and lung (increase in uptake). However, the data is based on a set of three individuals in each group, and displacement was not performed in the same individuals. Since tumor uptake in the chosen model was insufficient and not blockable, this phenomenon was not investigated any further.
Figure 6.
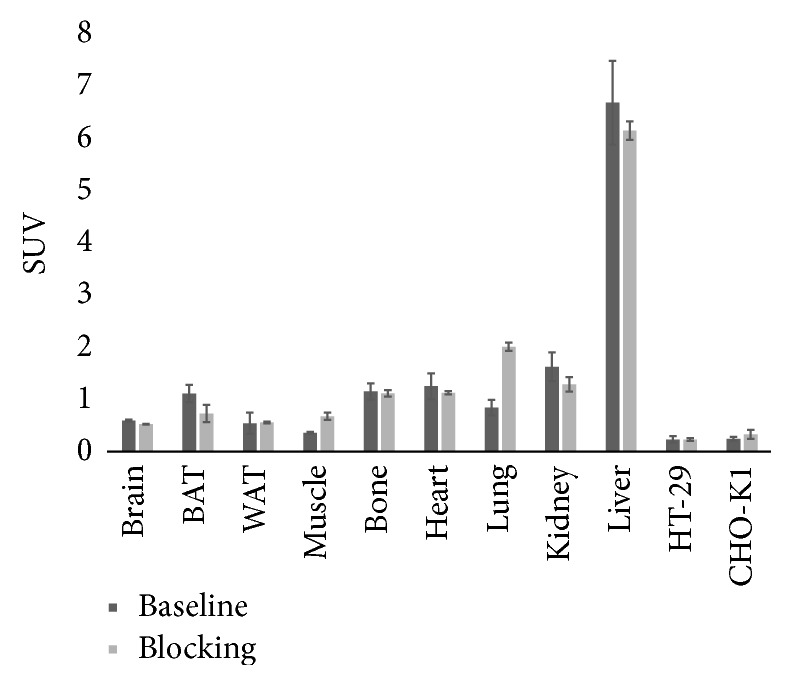
μPET-imaging was performed for 60 min. Activity concentration of [18F]FE@SUPPY in organs of interest is expressed as standardized uptake value (SUV). Blocking experiments, shown in the figure, were performed using unlabeled FE@SUPPY. Blocking experiments using MRS1523 provided the same outcome and are not shown in the figure.
For a detailed analysis of the pharmacokinetics, volumes of interest were also generated for mouse body liquids including blood, urine, and bile fluid (Figure 7). The radioactivity in blood was generally low (SUV = 1.21 ± 0.11) compared to the body liquids, urine (SUV = 8.86 ± 3.44), and bile fluid (21.85 ± 10.63), showing the highest accumulation of [18F]FE@SUPPY, which is in line with the biodistribution experiments. The mentioned standardized uptake values refer to baseline conditions.
Adenosine concentrations of ~0,5 μM have been proposed in HT-29 tumors grown as xenografts [4]. Even though adenosine displays only intermediate affinity for the A3AR (~1 μM at the rat A3AR [33]), the PET-tracer would have to compete with the endogenous ligand for A3AR occupancy. This may decrease accumulation of [18F]FE@SUPPY in the xenografts. However, more importantly, despite the fact that western blot analysis demonstrated hA3AR expression in HT-29 cells, hA3AR protein could not be detected in tissue lysates derived from HT-29 xenografts. This indicates that the human receptor is poorly conserved in mice upon tumor graft (Figure 8). To our knowledge, this phenomenon has not been described in literature so far but has tremendous impact on in vivo imaging. PET imaging is only feasible if an abundant amount of the target is available, as only nanomolar or even lower concentrations of PET-tracers are applied.
4. Conclusion
We found a favorable binding profile of [18F]FE@SUPPY displaying high affinity for the human A3AR besides low affinity for the other human adenosine receptor subtypes. Autoradiography showed ≥2.3-fold higher uptake in human CRC compared to adjacent healthy colon tissues. First in vivo studies using HT-29 xenografts showed insufficient tumor uptake. After initial high expression rates of the A3AR in the HT-29 cells, tumor masses, derived from HT-29 xenografts, revealed low target expression. The receptor was not conserved in the xenograft, which hampered the PET imaging strategy. An additional drawback of the used mouse model is the unfavorable pharmacokinetics of the PET-tracer [18F]FE@SUPPY in mice. It is questionable how accurate xenograft models in immunocompromised mice are to study the role of human A3ARs in cancer. Despite all efforts, in vivo visualization of the A3AR has not been successful to date and deeper understanding of A3AR function is still missing.
Acknowledgments
This work was supported by the Austrian Science Fund (FWF P26502-B24, M. Mitterhauser) and was performed with the support of the Molecular Imaging Cluster of the Medical University of Vienna, Austria. J. Fazekas-Singer was supported by Grant CCHD W1205-B09 awarded to Dr. E. Jensen-Jarolim. The authors want to thank Petra Fürlinger for her collaboration in the autoradiography experiments and Markus Zeilinger for his support in statistics.
Conflicts of Interest
The authors declare that they have no conflicts of interest.
Supplementary Materials
Table S1: binding values of FE@SUPPY are expressed as fmol/mm2 tissue.
References
- 1.Global Burden of Disease Cancer C. The global burden of cancer 2013. JAMA Oncology. 2015;1(4):505–527. doi: 10.1001/jamaoncol.2015.0735. [DOI] [PMC free article] [PubMed] [Google Scholar]
- 2.Fass L. Imaging and cancer: a review. Molecular Oncology. 2008;2(2):115–152. doi: 10.1016/j.molonc.2008.04.001. [DOI] [PMC free article] [PubMed] [Google Scholar]
- 3.Fredholm B. B., Ijzerman A. P., Jacobson K. A., Klotz K., Linden J. International Union of Pharmacology. XXV. Nomenclature and classification of adenosine receptors. Pharmacological Reviews. 2001;53(4):527–552. [PMC free article] [PubMed] [Google Scholar]
- 4.Blay J., White T. D., Hoskin D. W. The extracellular fluid of solid carcinomas contains immunosuppressive concentrations of adenosine. Cancer Research. 1997;57(13):2602–2605. [PubMed] [Google Scholar]
- 5.Merighi S., Mirandola P., Varani K., et al. A glance at adenosine receptors: Novel target for antitumor therapy. Pharmacology & Therapeutics. 2003;100(1):31–48. doi: 10.1016/S0163-7258(03)00084-6. [DOI] [PubMed] [Google Scholar]
- 6.Gessi S., Merighi S., Sacchetto V., Simioni C., Borea P. A. Adenosine receptors and cancer. Biochimica et Biophysica Acta (BBA) - Biomembranes. 2011;1808(5):1400–1412. doi: 10.1016/j.bbamem.2010.09.020. [DOI] [PubMed] [Google Scholar]
- 7.Borea P. A., Gessi S., Merighi S., Varani K. Adenosine as a multi-signalling guardian angel in human diseases: when, where and how does it exert its protective effects? Trends in Pharmacological Sciences. 2016;37(6):419–434. doi: 10.1016/j.tips.2016.02.006. [DOI] [PubMed] [Google Scholar]
- 8.Gessi S., Varani K., Merighi S., et al. Pharmacological and biochemical characterization of A 3 adenosine receptors in Jurkat T cells. British Journal of Pharmacology. 2001;134(1):116–126. doi: 10.1038/sj.bjp.0704254. [DOI] [PMC free article] [PubMed] [Google Scholar]
- 9.Merighi S., Mirandola P., Milani D., et al. Adenosine receptors as mediators of both cell proliferation and cell death of cultured human melanoma cells. Journal of Investigative Dermatology. 2002;119(4):923–933. doi: 10.1046/j.1523-1747.2002.00111.x. [DOI] [PubMed] [Google Scholar]
- 10.Merighi S., Benini A., Mirandola P., et al. A3 adenosine receptors modulate hypoxia-inducible factor-1α expression in human A375 melanoma cells. Neoplasia. 2005;7(10):894–903. doi: 10.1593/neo.05334. [DOI] [PMC free article] [PubMed] [Google Scholar]
- 11.Gessi S., Varani K., Merighi S., et al. A3 adenosine receptors in human neutrophils and promyelocytic HL60 cells: A pharmacological and biochemical study. Molecular Pharmacology. 2002;61(2):415–424. doi: 10.1124/mol.61.2.415. [DOI] [PubMed] [Google Scholar]
- 12.Trincavelli M. L., Tuscano D., Marroni M., et al. A3 adenosine receptors in human astrocytoma cells: Agonist-mediated desensitization, internalization, and down-regulation. Molecular Pharmacology. 2002;62(6):1373–1384. doi: 10.1124/mol.62.6.1373. [DOI] [PMC free article] [PubMed] [Google Scholar]
- 13.Sakowicz-Burkiewicz M., Kitowska A., Grden M., Maciejewska I., Szutowicz A., Pawelczyk T. Differential effect of adenosine receptors on growth of human colon cancer HCT 116 and HT-29 cell lines. Archives of Biochemistry and Biophysics. 2013;533(1-2):47–54. doi: 10.1016/j.abb.2013.02.007. [DOI] [PubMed] [Google Scholar]
- 14.Polycarpou E., Meira L. B., Carrington S., Tyrrell E., Modjtahedi H., Carew M. A. Resveratrol 3-O-d-glucuronide and resveratrol 4′-O-d-glucuronide inhibit colon cancer cell growth: evidence for a role of A3 adenosine receptors, cyclin D1 depletion, and G1 cell cycle arrest. Molecular Nutrition & Food Research. 2013;57(10):1708–1717. doi: 10.1002/mnfr.201200742. [DOI] [PubMed] [Google Scholar]
- 15.Gessi S., Merighi S., Varani K., et al. Adenosine receptors in colon carcinoma tissues and colon tumoral cell lines: focus on the A3 adenosine subtype. Journal of Cellular Physiology. 2007;211(3):826–836. doi: 10.1002/jcp.20994. [DOI] [PubMed] [Google Scholar]
- 16.Merighi S., Benini A., Mirandola P., et al. Caffeine inhibits adenosine-induced accumulation of hypoxia-inducible factor-1α, vascular endothelial growth factor, and interleukin-8 expression in hypoxic human colon cancer cells. Molecular Pharmacology. 2007;72(2):395–406. doi: 10.1124/mol.106.032920. [DOI] [PubMed] [Google Scholar]
- 17.Madi L., Ochaion A., Rath-Wolfson L., et al. The A3 adenosine receptor is highly expressed in tumor versus normal cells: Potential target for tumor growth inhibition. Clinical Cancer Research. 2004;10(13):4472–4479. doi: 10.1158/1078-0432.CCR-03-0651. [DOI] [PubMed] [Google Scholar]
- 18.Gessi S., Cattabriga E., Avitabile A., et al. Elevated expression of A3 adenosine receptors in human colorectal cancer is reflected in peripheral blood cells. Clinical Cancer Research. 2004;10(17):5895–5901. doi: 10.1158/1078-0432.CCR-1134-03. [DOI] [PubMed] [Google Scholar]
- 19.Koussounadis A., Langdon S. P., Um I. H., Harrison D. J., Smith V. A. Relationship between differentially expressed mRNA and mRNA-protein correlations in a xenograft model system. Scientific Reports. 2015;5 doi: 10.1038/srep10775.10775 [DOI] [PMC free article] [PubMed] [Google Scholar]
- 20.Wadsak W., Mien L.-K., Shanab K., et al. Preparation and first evaluation of [18F]FE@SUPPY: a new PET tracer for the adenosine A3 receptor. Nuclear Medicine and Biology. 2008;35(1):61–66. doi: 10.1016/j.nucmedbio.2007.09.004. [DOI] [PubMed] [Google Scholar]
- 21.Wadsak W., Mien L.-K., Shanab K., et al. Radiosynthesis of the adenosine A3 receptor ligand 5-(2-[ 18F]fluoroethyl) 2,4-diethyl-3-(ethylsulfanylcarbonyl)-6- phenylpyridine-5-carboxylate ([18F]FE@SUPPY) Radiochimica Acta. 2008;96(2):119–124. doi: 10.1524/ract.2008.1467. [DOI] [Google Scholar]
- 22.Haeusler D., Kuntner C., Nics L., et al. [18F]FE@SUPPY: a suitable PET tracer for the adenosine A3 receptor? An in vivo study in rodents. European Journal of Nuclear Medicine and Molecular Imaging. 2015;42(5):741–749. doi: 10.1007/s00259-014-2976-3. [DOI] [PMC free article] [PubMed] [Google Scholar]
- 23.Mitterhauser M., Haeusler D., Mien L., et al. Automatisation and First Evaluation of [18F]FE@SUPPY:2, an Alternative PET-Tracer for the Adenosine A3 Receptor: A Comparison with [18F]FE@SUPPY. The Open Nuclear Medicine Journal. 2009;1(1):15–23. doi: 10.2174/1876388X00901010015. [DOI] [Google Scholar]
- 24.Gao M., Gao A. C., Wang M., Zheng Q.-H. Simple synthesis of new carbon-11-labeled 1,2,4-triazolo[4,3-a]quinoxalin-1-one derivatives for PET imaging of A3 adenosine receptor. Applied Radiation and Isotopes. 2014;91:71–78. doi: 10.1016/j.apradiso.2014.05.005. [DOI] [PubMed] [Google Scholar]
- 25.Kiesewetter D. O., Lang L., Ma Y., et al. Synthesis and characterization of [76Br]-labeled high-affinity A3 adenosine receptor ligands for positron emission tomography. Nuclear Medicine and Biology. 2009;36(1):3–10. doi: 10.1016/j.nucmedbio.2008.10.003. [DOI] [PMC free article] [PubMed] [Google Scholar]
- 26.Philippe C., Haeusler D., Fuchshuber F., et al. Comparative autoradiographic in vitro investigation of melanin concentrating hormone receptor 1 ligands in the central nervous system. European Journal of Pharmacology. 2014;735(1):177–183. doi: 10.1016/j.ejphar.2014.04.020. [DOI] [PubMed] [Google Scholar]
- 27.Nics L., Vraka C., Hendl M., Haeusler D., Wagner K. H., Shanab K., et al. In-vitro stability of [18F]FE@SUPPPY and [18F]FE@SUPPY:2 against human liver-microsomes and human plasma. Nuklearmedizin. 2011;50 [Google Scholar]
- 28.Haeusler D., Nics L., Mien L.-K., et al. [18F]FE@SUPPY and [18F]FE@SUPPY:2 - metabolic considerations. Nuclear Medicine and Biology. 2010;37(4):421–426. doi: 10.1016/j.nucmedbio.2010.01.001. [DOI] [PubMed] [Google Scholar]
- 29.Li A.-H., Moro S., Forsyth N., Melman N., Ji X.-D., Jacobson K. A. Synthesis, CoMFA analysis, and receptor docking of 3,5-diacyl-2,4- dialkylpyridine derivatives as selective A3 adenosine receptor antagonists. Journal of Medicinal Chemistry. 1999;42(4):706–721. doi: 10.1021/jm980550w. [DOI] [PMC free article] [PubMed] [Google Scholar]
- 30.Vraka C., Nics L., Wagner K.-H., Hacker M., Wadsak W., Mitterhauser M. LogP, a yesterday's value? Nuclear Medicine and Biology. 2017;50:1–10. doi: 10.1016/j.nucmedbio.2017.03.003. [DOI] [PubMed] [Google Scholar]
- 31.Pan J., Pourghiasian M., Hundal N., et al. 2-[18F]Fluoroethanol and 3-[18F]fluoropropanol: Facile preparation, biodistribution in mice, and their application as nucleophiles in the synthesis of [18F]fluoroalkyl aryl ester and ether PET tracers. Nuclear Medicine and Biology. 2013;40(6):850–857. doi: 10.1016/j.nucmedbio.2013.04.009. [DOI] [PubMed] [Google Scholar]
- 32.Yamano K., Inoue M., Masaki S., Saki M., Ichimura M., Satoh M. Generation of adenosine A3 receptor functionally humanized mice for the evaluation of the human antagonists. Biochemical Pharmacology. 2006;71(3):294–306. doi: 10.1016/j.bcp.2005.10.028. [DOI] [PubMed] [Google Scholar]
- 33.Jacobson K. A., Kim H. O., Siddiqi S. M., Olah M. E., Stiles G. L., Von Lubitz D. K. J. E. A3-adenosine receptors: Design of selective ligands and therapeutic prospects. Drugs of the Future. 1995;20(7):689–699. doi: 10.1358/dof.1995.020.07.531583. [DOI] [PMC free article] [PubMed] [Google Scholar]
Associated Data
This section collects any data citations, data availability statements, or supplementary materials included in this article.
Supplementary Materials
Table S1: binding values of FE@SUPPY are expressed as fmol/mm2 tissue.


