Abstract
Vinyl chloride (VC), a common industrial organochlorine and environmental pollutant, has been shown to directly cause hepatic angiosarcoma and toxicant‐associated steatohepatitis at high exposure levels. However, the impact of lower concentrations of VC on the progression of underlying liver diseases (e.g., nonalcoholic fatty liver disease [NAFLD]) is unclear. Given the high prevalence of NAFLD in the United States (and worldwide) population, this is an important concern. Recent studies by our group with VC metabolites suggest a potential interaction between VC exposure and underlying liver disease to cause enhanced damage. Here, a novel mouse model determined the effects of VC inhalation at levels below the current Occupational Safety and Health Administration limit (<1 ppm) in the context of NAFLD to better mimic human exposure and identify potential mechanisms of VC‐induced liver injury. VC exposure caused no overt liver injury in mice fed a low‐fat diet. However, in mice fed a high‐fat diet (HFD), VC significantly increased liver damage, steatosis, and increased neutrophil infiltration. Moreover, VC further enhanced HFD‐induced oxidative and endoplasmic reticulum stress. Importantly, VC exposure dysregulated energy homeostasis and impaired mitochondrial function, even in mice fed a low‐fat diet. In toto, the results indicate that VC exposure causes metabolic stress that sensitizes the liver to steatohepatitis caused by HFD. Conclusion: The hypothesis that low‐level (below the Occupational Safety and Health Administration limit) chronic exposure to VC by inhalation enhances liver injury caused by an HFD is supported. Importantly, our data raise concerns about the potential for overlap between fatty diets (i.e., Western diet) and exposure to VC and the health implications of this co‐exposure for humans. It also emphasizes that current safety restrictions may be insufficient to account for other factors that can influence hepatotoxicity. (Hepatology Communications 2018;2:270‐284)
Abbreviations
- BMI
body mass index
- Chop
CCAT‐enhancer‐binding protein homologous protein
- ECM
extracellular matrix
- ER
endoplasmic reticulum
- FFA
free fatty acid
- G6Pase
glucose‐6‐phosphotase
- HFD
high‐fat diet
- ITT
insulin tolerance test
- LFD
low‐fat diet
- mRNA
messenger RNA
- NAFLD
nonalcoholic fatty liver disease
- NPC
nonparenchymal cell
- OGTT
oral glucose tolerance test
- ORO
Oil Red O
- OSHA
Occupational Safety and Health Administration
- PAI‐1
plasminogen activator inhibitor‐1
- PAS
periodic acid–Schiff
- Pck1
phosphoenolpyruvate carboxykinase 1
- Pgc1α
peroxisome proliferator‐activated receptor gamma coactivator 1‐α
- PTT
pyruvate tolerance test
- TASH
toxicant‐associated steatohepatitis
- TAT
thrombin‐antithrombin
- TUNEL
terminal deoxynucleotidyl transferase–mediated deoxyuridine triphosphate nick‐end labeling
- VC
vinyl chloride
Introduction
Vinyl chloride (VC) is an organochlorine toxicant and potent environmental/occupational pollutant. It is ranked fourth on the Centers for Disease Control and Protection's Agency for Toxic Substances and Disease Registry (ATSDR) Substance Priority List,1 with a global annual production estimated at 27 million tons and a global capacity of 40 million tons.2 VC monomer is used in industry to produce polyvinyl chloride for commercial manufacturing of plastic pipes and consumer products.3 VC is also present at many Environmental Protection Agency Superfund sites across the United States not only as a direct contaminant but also as a degradation product of other chlorinated chemicals.4 These compounds are broken down by soil microorganisms in landfill leachates, and VC is then released into the soil and groundwater.4 VC is also present in the air surrounding production facilities at concentrations ranging from trace amounts to over 40 ppm.1 Residential areas surrounding both manufacturing and Superfund sites are susceptible to VC migrating through soil into home foundations where it readily volatilizes to enter showers, basements, and living spaces in which these vapors recirculate and are inhaled.5, 6 Due to the high risk of low‐level human exposure in residential areas surrounding VC‐emitting sites, understanding the effects of this toxicant on human health is necessary; however, there are only few data (human or experimental) on the impact of chronic low‐level VC exposure.
VC can cause steatosis (fat accumulation), inflammation (steatohepatitis), fibrosis, necrosis, and hepatocellular carcinoma at high levels of exposure (>5 ppm).7 During the 1970s, a rare form of liver cancer, hepatic angiosarcoma, was found to be directly associated with extremely high occupational exposure to VC (>1,000 ppm).7, 8 More recently, Guardiola et al.9 and Cave et al.10 described a pathology unique to VC exposure, toxicant‐associated steatohepatitis (TASH), in chemical plant workers exposed to VC. This new pathology is distinct from malignancies previously associated with VC exposure. While TASH shares many similarities to nonalcoholic steatohepatitis, such as steatosis and inflammation or even fibrosis, it does not share the same risk factors (e.g., obesity). Indeed, several patients with TASH were well below the cut‐off point for obesity, e.g., body mass index (BMI) <30.11
It is well known that the risk for developing chronic liver injury is influenced by multiple factors, such as genetics, comorbidities, and/or lifestyle choices, such as diet.12 Obesity is a major problem in the United States, with over 68% of the population obese (BMI ≥30).11, 13 Nonalcoholic fatty liver disease (NAFLD) is the major hepatic manifestation of obesity and is the most prevalent form of liver disease worldwide.14 We previously reported that mice fed a high‐fat diet (HFD) are more susceptible to hepatic injury caused by the VC metabolite chloroethanol.15 Due to the complications associated with high‐level VC exposure, the Occupational Safety and Health Administration (OSHA) has decreased the acceptable level of occupational VC exposure to a current standard of 1 ppm for an 8‐hour work day (OSHA Vinyl Chloride Standard 29 CFR 1910.1017). However, although the effects of high‐level occupational VC exposure have been studied, the effects of low‐level occupational and environmental exposure and its interactions with other risk‐modifying factors, such as diet, have not been determined. Additionally, VC concentrations below the OSHA limit are relevant for environmental exposures in residential areas surrounding Superfund sites and VC manufacturing facilities, and little is known about chronic environmental exposures. Therefore, the goal of this study was to develop a new, more relevant mouse model to mimic low‐level VC inhalation co‐exposure with a HFD.
Materials and Methods
KEY CHEMICAL RESOURCES
VC obtained from Kin‐Tek (La Marque, TX) was recently validated by the Kentucky Institute for the Environment and Sustainable Development of the University of Louisville. The VC concentration in the inhalation chamber was measured by gas chromatography/mass spectrometry in full scan mode according to Environmental Protection Agency method TO‐15, using a quadrupole gas chromatograph (HP 6890) with an HP 5973 Mass Selective Detector. Grab air samples from the inhalation chamber were collected as air exited the chamber into pre‐evacuated 6‐L Silcosteel canisters.
ANIMALS AND PROCEDURES
Six‐week‐old male C57BL/6J mice from Jackson Laboratory (Bar Harbor, ME) were held in a pathogen‐free barrier facility accredited by the Association for Assessment and Accreditation of Laboratory Animal Care, and procedures were approved by the local Institutional Animal Care and Use Committee. Animals were housed in shoebox cages with corncob bedding and were allowed food and water ad libitum on a 12‐hour light/dark cycle.
Mice were exposed to VC (Kin‐Tek) at ∼0.85 ± 0.1 ppm or to room air in inhalation chambers for 6 hours per day, 5 days per week for 12 weeks, in bedding‐free cages.16 Mice were fed a low‐fat diet (LFD) or HFD (Envigo Teklad Diets, Madison, WI; see Supporting Materials for a detailed description).15 At sacrifice, fasted (4 hours) animals were anesthetized with ketamine/xylazine (100/15 mg/kg, intraperitoneally) and were exsanguinated through the vena cava. Citrated plasma was stored at –80°C for further analysis. Portions of liver tissue were snap frozen in liquid nitrogen, embedded in frozen specimen medium (Sakura Finetek, Torrance, CA), or fixed in 10% neutral‐buffered formalin.
METABOLIC PHENOTYPING
Oxygen consumption rates, carbon dioxide production rates, respiratory exchange ratios, food and water consumption, and activity (sum of ambulatory and fine movements) of animals were measured using a physiologic/metabolic cage system (TSE Phenomaster System, Bad Homberg, Germany) during the dark cycle. Mitochondria were isolated from livers as described,17 and oxygen consumption rates were measured with a Seahorse XF96 extracellular flux analyzer. Pyruvate tolerance test (PTT; 1 g/kg,), insulin tolerance test (ITT; 0.75 U/kg), and oral glucose tolerance test (OGTT; 2 g/kg,) were performed on fasted mice (see Supporting Materials for a detailed description).
BIOCHEMICAL ANALYSES, IMMUNOHISTOCHEMISTRY, AND ELECTRON MICROSCOPY
Plasma levels of alanine aminotransferase, aspartate aminotransferase, thrombin‐antithrombin (TAT), lactate, and β‐hydroxybutyrate were determined using standard kits (Thermo Fisher Scientific, Grand Island, NY; Abcam, Cambridge, MA; Cayman Chemical, Ann Arbor, MI). Formalin‐fixed paraffin‐embedded liver sections were stained with hematoxylin and eosin for general morphology. Neutrophil accumulation was assessed by chloroacetate esterase stain (Sigma, St. Louis MO). Apoptosis was detected by terminal deoxynucleotidyl transferase–mediated deoxyuridine triphosphate nick‐end labeling (TUNEL; EMD Millipore, Billerica, MA). TUNEL‐positive cells (hepatocytes and nonparenchymal cells [NPCs]) were counted using Metamorph Image Analysis Software (Molecular Devices, Sunnyvale, CA) and are expressed as positive cells per 1,000 hepatocytes. Neutral lipids and glycogen were visualized with Oil Red O (ORO) and periodic acid–Schiff (PAS) stains, respectively. Immunofluorescent detection of fibrin accumulation was performed as described.18 Image analysis was performed using Metamorph Image Analysis Software and is expressed as positive staining (4‐hydroxynonenal, malondialdehyde, F4/80, ORO, PAS) or relative fluorescence units (for fibrin) in the percentage of the microscope field. Plasma protein concentrations of cytokines were determined with Milliplex MAP Mouse Adipokine Magnetic Bead Panel (EMD Millipore) as per the manufacturer's instructions. Hepatic lipids were extracted as described,19 and lipid content was determined by commercially available kits (Thermo Fisher Scientific; Roche Diagnostics, Indianapolis, IN). The electron microscopy analysis was performed as described (see Supporting Materials for a detailed description).20
IMMUNOBLOTS
Liver samples were homogenized in buffer containing protease and phosphatase inhibitor cocktails (Sigma).18 Sodium dodecyl sulfate–polyacrylamide gel electrophoresis was followed by western blotting. Primary antibodies against caspase‐3, glyceraldehyde 3‐phospohate dehydrogenase (GAPDH) (Santa Cruz Biotechnology, Dallas, TX), cleaved caspase‐3 (Cell Signaling, Beverly, MA), and CCAT‐enhancer‐binding protein homologous protein (Chop), (Thermo Fisher Scientific) were used. Densitometric analysis was performed using UN‐SCAN‐IT gel software (Silk Scientific Inc., Orem, UT).
RNA ISOLATION AND REAL‐TIME REVERSE‐TRANSCRIPTION POLYMERASE CHAIN REACTION
RNA was extracted from fresh liver samples and reverse transcribed. Quantitative real‐time reverse‐transcription polymerase chain reaction was performed using a Quant Studio 3 real‐time polymerase chain reaction system (Thermo Fisher Scientific). Primers and probes were ordered as commercially available kits (Thermo Fisher Scientific). The comparative CT method was used to determine fold differences between the target genes and an endogenous reference (18S).
STATISTICAL ANALYSES
Power analysis was used to calculate the number of animals required for the experiments. Based on previous studies and preliminary data, we estimated that we needed a minimum of five animals per group to compare the primary endpoint (i.e., levels of organ injury) in HFD and VC‐exposed mice to get an 85% power for detecting a difference of at least 20% with P < 0.05 between experimental groups.
Results are reported as means ± SEM (n = 4‐12). Analysis of variance with Bonferroni's post‐hoc test (for parametric data) or Mann–Whitney Rank Sum test (for nonparametric data) were used for the determination of statistical significance among treatment groups, as appropriate. P < 0.05 was selected before the study as the level of significance.
Results
METABOLIC PHENOTYPE
To evaluate animal condition and metabolism in this model, body weight and food consumption were measured weekly (Fig. 1A). In the LFD group, mice exposed to VC did not gain more body weight than the controls. Although HFD feeding increased body weight over time, VC did not further enhance this effect. Body mass composition analysis after 12 weeks of exposure revealed no changes in lean or fat mass distribution with VC (Fig. 1B). Independent of diet or treatment, food consumption did not change across groups throughout the 12‐week study (Fig. 1A). In LFD‐fed mice, VC did not alter liver to body weight ratios at any of the time points measured. HFD significantly increased liver to body weight ratios at both the 8‐ and 12‐week time points; however, VC did not significantly enhance this effect (Fig. 1A).
Figure 1.
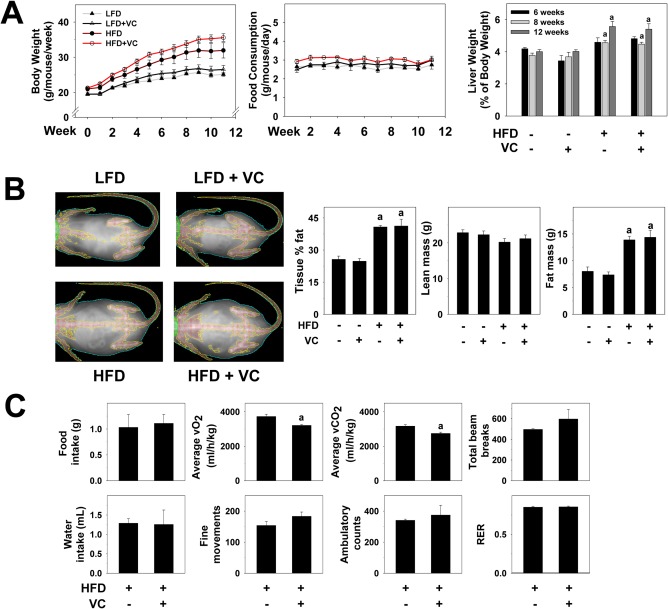
Metabolic phenotype. (A) Body weights were measured once per week and are depicted for the 12‐week exposure period. Food consumption was measured twice per week for the 12‐week exposure period. Liver weight to body weight ratios were calculated for each group for each time point. (B) DEXAscan analysis was performed for all treatment groups at the 12‐week time point. Representative pictures are shown. Body mass is graphed as body fat in percentage of total tissue, lean body mass, and fat mass in grams. (C) Representative parameters of metabolic function are depicted for mice exposed to HFD ± VC. a P < 0.05 compared to LFD or HFD control. Results are presented as mean ± SEM. Sample size per group A‐C, n = 10‐12. Abbreviations: RER, respiratory exchange ratio; vCO2, carbon dioxide production; vO2, oxygen consumption.
To determine how diet affected systemic metabolism, mice were placed in metabolic chambers in which food/water intake, oxygen consumption, carbon dioxide production, and physical activity of individual mice were measured. No differences were observed in food or water intake between HFD‐fed mice and HFD + VC mice during measurements in the metabolic chambers (Fig. 1C). Interestingly, VC decreased average oxygen consumption and carbon dioxide production values compared with mice fed an HFD only (Fig. 1C). However, the respiratory exchange ratio remained the same compared to HFD controls, suggesting an equal decrease in both oxygen consumption and carbon dioxide production (Fig. 1C). Importantly, while a decline of the respiratory exchange ratio may be caused by a decrease in physical activity, VC did not change physical activity levels (measured by fine movements, ambulatory counts, total beam breaks) of the animals (Fig. 1C).
VC ENHANCES NAFLD
Our group has shown enhanced liver injury with exposure to the VC metabolite chloroethanol and a HFD.15 Here, using a more physiologically relevant, novel inhalation model of sub‐OSHA standard VC exposure, we evaluated histologic and biochemical indices of liver damage (Fig. 2A). Normal histology was observed in LFD control animals. Importantly, in the LFD group, VC caused no overt pathologic changes. HFD feeding significantly increased steatosis (Fig. 2A) and oxidative stress (4‐hydroxynonenal and malondialdehyde; Fig. 2A,B), and VC significantly enhanced all these indices. Moreover, both alanine aminotransferase and aspartate aminotransferase plasma levels were normal with VC in the absence of an HFD. HFD feeding significantly increased transaminase levels, and VC significantly enhanced this effect (Fig. 2B, upper panel), suggesting enhanced liver injury.
Figure 2.
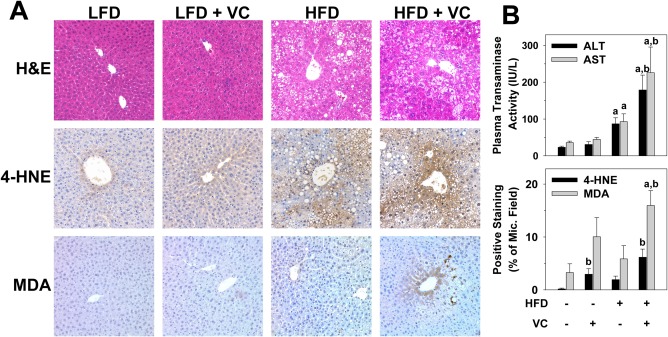
VC enhanced liver damage caused by the HFD. (A) Representative photomicrographs of H&E (general morphology, ×200), 4‐HNE (oxidative stress, ×200), and MDA (oxidative stress, ×200) are shown at 12 weeks. (B) Plasma transaminase (ALT/AST) levels were determined for the 12‐week time point; image analysis for 4‐HNE and MDA are graphed as positive staining as percentage of microscope field. a P < 0.05 compared to LFD control; b P < 0.05 compared to absence of VC. Results are presented as mean ± SEM. Sample size per group, n = 5‐7. Abbreviations: 4‐HNE, 4‐hydroxynonenal; ALT, alanine aminotransferase; AST, aspartate aminotransferase; H&E, hematoxylin and eosin; MDA, malondialdehyde; Mic., microscope.
VC INCREASES DIET‐INDUCED NEUTROPHIL INFILTRATION
To assess inflammation in this model, markers of both neutrophils (chloroacetate esterase) and macrophages (F4/80) were examined histologically for the 12‐week time point (Fig. 3A). VC exposure did not significantly alter the recruitment of either neutrophils or macrophages in the absence of an HFD. The HFD increased neutrophil accumulation, indicating hepatic inflammation and injury. Interestingly, while the combination of HFD + VC increased the number of neutrophils, it had no effect on macrophage recruitment (Fig. 3B). Plasma protein concentrations of the proinflammatory cytokine monocyte chemotactic protein‐1 was elevated with the HFD (LFD, 17 ± 5 pg/mL; HFD, 50 ± 13 pg/mL), but this effect was not significantly altered by HFD + VC (33 ± 10 pg/mL). Plasma protein levels of other proinflammatory cytokines, such as tumor necrosis factor alpha and interleukin‐6, were not changed compared to controls in any of the groups.
Figure 3.
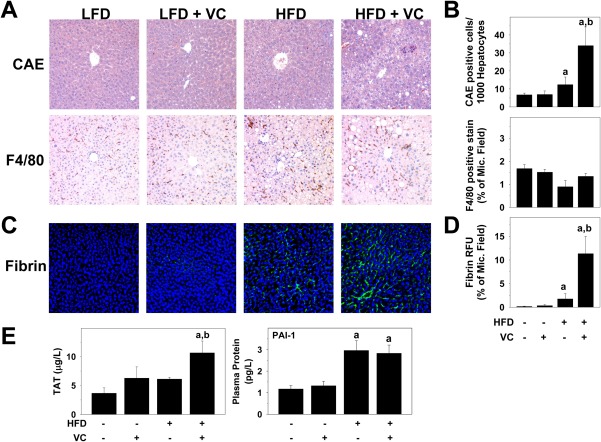
VC increased hepatic inflammatory cell infiltration. (A) Representative photomicrographs of CAE (neutrophils, ×200) and F4/80 (macrophages, ×200) stains are shown for the 12‐week time point. (B) CAE‐positive cells were counted and graphed as positive cells per 1,000 hepatocytes; image analysis for F4/80 is graphed as positive staining as percentage of microscope field. (C) Representative photomicrographs of fibrin (×200). (D) Image analysis for fibrin is graphed as relative fluorescence units as percent of microscope field. (E) Plasma TAT and protein concentrations of PAI‐1 are shown in μg/L and pg/L, respectively. a P < 0.05 compared to LFD control; b P < 0.05 compared to absence of VC. Results are presented as mean ± SEM. Sample size per group, n = 5‐7. Abbreviations: CAE, chloroacetate esterase; Mic., microscope; RFU, relative fluorescence unit.
Oxidative stress may be caused by intrinsic (e.g., electron leakage from mitochondria) as well as by extrinsic events.21 One potential extrinsic cause of oxidative stress is hemostasis‐induced hypoxia and subsequent reoxygenation.22 In this context, the effect of VC on fibrin accumulation was determined (Fig. 3C). VC alone caused no changes to fibrin deposition; however, it did enhance HFD‐induced fibrin accumulation (Fig. 3C,D). To determine whether enhanced fibrin deposition was a consequence of exaggerated thrombin generation or of an inhibition of fibrinolysis by plasminogen activator inhibitor‐1 (PAI‐1), plasma TAT and PAI‐1 levels were determined (Fig. 3E) as indices of thrombin activation and fibrinolysis inhibition, respectively. While VC had no effect on plasma TAT or PAI‐1 levels in the absence of an HFD, TAT levels were significantly increased in the HFD + VC group. Interestingly, VC did not further elevate the increase in plasma protein levels of PAI‐1 (Fig. 3E), indicating increased fibrin accumulation as a result of increased coagulation rather than inhibited fibrin degradation.
EFFECT OF VC ON APOPTOSIS
Apoptotic hepatocyte cell death is characteristic of NAFLD, and this effect has been well studied.23 Due to the increased liver injury observed with VC in the HFD animals, we assessed cell death pathways. Whole liver cleaved caspase‐3 protein levels were analyzed by western blot. While HFD slightly increased caspase‐3 cleavage, VC significantly enhanced this effect, indicating caspase‐3 activation (Fig. 4A). For histologic analysis of apoptosis, TUNEL staining was performed at the 12‐week time point. Representative photomicrographs of the TUNEL staining and cell counts of the TUNEL‐positive cells (hepatocytes and NPCs) in liver tissue are shown in Fig. 4B. In LFD‐fed mice, VC did not change the number of TUNEL‐positive cells. HFD had no major effect on the number of TUNEL‐positive hepatocytes or NPCs; however, in this group VC significantly increased TUNEL‐positive NPCs while having no effect on hepatocytes (Fig. 4C).
Figure 4.
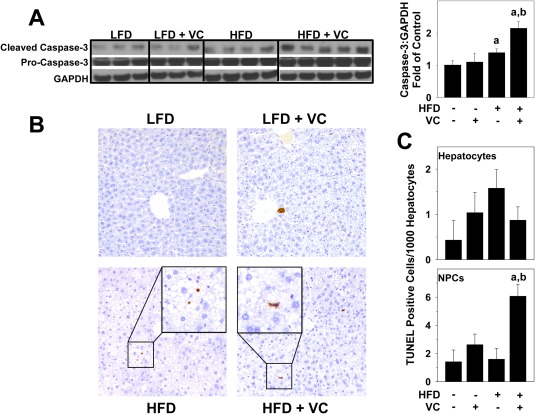
Effect of VC on apoptosis. (A) Representative western blots and densitometric analysis for whole liver caspase‐3 protein are shown. (B) TUNEL staining was performed as described in Materials and Methods for the 12‐week samples. Representative photomicrographs are shown (magnification ×200). (C) TUNEL‐positive hepatocytes and NPCs were quantified as described in Materials and Methods and are expressed as TUNEL‐positive cells per 1,000 hepatocytes. a P < 0.05 compared to LFD control; b P < 0.05 compared to absence of VC. Results are presented as mean ± SEM. Sample size per group, n = 5‐7. Abbreviation: GAPDH, glyceraldehyde 3‐phosphate dehydrogenase.
VC CAUSES ENDOPLASMIC RETICULUM STRESS
The endoplasmic reticulum (ER) plays a major role in managing intracellular protein homeostasis, and its stress activation can initiate inflammatory and apoptotic pathways. We therefore examined several markers of ER stress. ER expansion or dilation is a well‐known phenomenon that occurs during the unfolded protein response and leads to activation of the ER stress pathway. Electron microscopy photomicrographs show significant ER dilation with VC in both the LFD and HFD groups, morphologically indicating the activation of the unfolded protein response (Fig. 5A, indicated with arrows). As part of the ER membrane, the nuclear membrane was also dilated in these groups. Hepatic messenger RNA (mRNA) expression of several ER stress markers were analyzed for the HFD and HFD + VC groups. Sirtuin 1 (Sirt1) has recently been shown to be a negative regulator of ER stress.24 Indeed, here VC significantly decreased Sirt1 expression compared to the HFD controls. Additionally, activating transcription factor 4 (Atf4), Chop, and heat shock protein 90 (Hsp90) mRNA expression were examined as markers of ER stress activation (Fig. 5B). HFD + VC significantly increased expression of all these indices. Protein levels of CHOP were analyzed for all experimental groups (Fig. 5C). VC did not change relative CHOP levels in the LFD group. HFD increased CHOP protein levels, but VC did not significantly enhance this effect.
Figure 5.
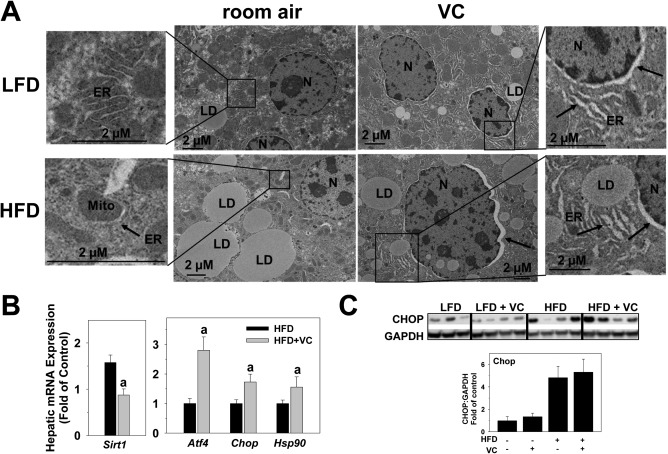
VC caused ER stress. (A) Representative electron microscope photomicrographs are shown. Arrows denote dilated ER, including the nuclear membrane as part of the ER membrane. (B) Representative western blot and densitometric analysis of CHOP are shown. (C) Hepatic mRNA expression of ER stress markers Sirt1, Atf4, Chop, and Hsp90 are shown for HFD and HFD + VC (12 weeks). a P < 0.05 compared to HFD control. Results are presented as mean ± SEM. Sample size per group A, n = 10; B,C, n = 5‐7. Abbreviations: GAPDH, glyceraldehyde 3‐phosphate dehydrogenase; LD, lipid droplet; Mito, mitochondria; N, nucleus.
VC ALTERS HEPATIC METABOLISM
A major hallmark of early liver disease is steatosis. Therefore, we performed a more in‐depth analysis of lipid accumulation by ORO staining of neutral lipids (Fig. 6A) and extraction of hepatic lipids, such as triglyceride, cholesterol, and free fatty acid (FFA) (Fig. 6B). VC caused no changes in lipid accumulation in the absence of a HFD; however, it significantly increased macrovesicular steatosis as represented by ORO staining and triglyceride levels (Fig. 6A,B). VC did not further enhance microvesicular steatosis as represented by cholesterol and FFA levels (Fig. 6B).
Figure 6.
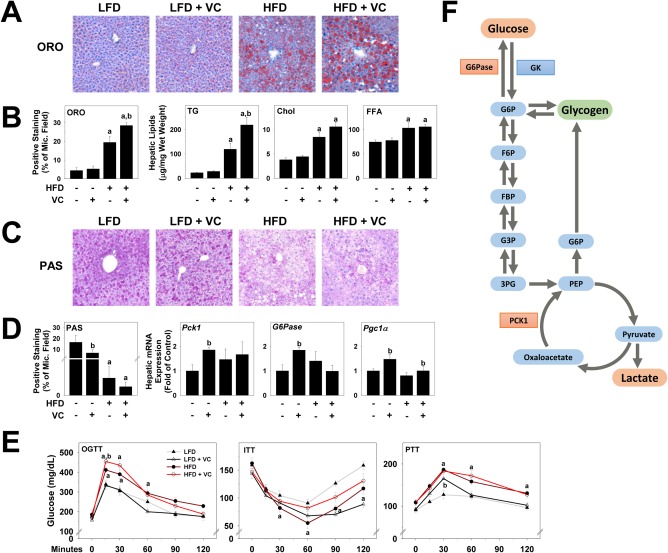
VC dysregulated hepatic metabolism. (A) Representative photomicrographs of ORO (neutral lipids, ×200) are shown. (B) Image analysis of ORO‐positive staining was performed, and results are shown as percentage of microscope field. Triglyceride, cholesterol, and FFA levels were measured in hepatic lipid extracts as described in Materials and Methods. (C) Representative photomicrographs for PAS staining are shown for the 12‐week time point (glycogen, ×200). (D) Image analysis of PAS‐positive staining was performed, and results are shown as percentage of microscope field. Hepatic mRNA expression of Pck1, G6Pase, and Pgc1α are shown as fold change compared to LFD control animals at the 6‐week time point. (E) OGTT, ITT, and PTT were performed at 6 weeks of exposure. (F) Changes in glucose metabolism are represented. Red denotes increased expression or abundance with VC, while green denotes decrease in product levels. a P < 0.05 compared to LFD control; b P < 0.05 compared to absence of VC. Results are presented as mean ± SEM. Sample size per group A, n = 5‐7; B,C, n = 10‐12; E, n = 5. Abbreviations: 3PG, 3‐phosphoglycerate; Chol, cholesterol; F6P, fructose‐6‐phosphate; FBP, fructose 1,3‐bisphosphate; G3P, glyceraldehyde 3‐phosphase; G6P, glucose‐6‐phosphate; ITT, insulin tolerance test; Mic., microscope; OGTT, oral glucose tolerance test; PEP, phosphoenolpyruvate; PTT, pyruvate tolerance test; TG, triglyceride.
Published data from this laboratory have shown that glucose metabolism is dysregulated by VC metabolite exposure.25 Therefore, hepatic glycogen deposition was visualized with PAS staining (Fig. 6C). LFD control animals showed normal glycogen levels. Interestingly, as shown previously with VC metabolites, VC proper decreased hepatic glycogen, even in the LFD group. Additionally, we analyzed hepatic mRNA expression of genes involved in glucose homeostasis, including phosphoenolpyruvate carboxykinase 1 (Pck1), glucose‐6‐phosphotase (G6Pase), and peroxisome proliferator‐activated receptor gamma coactivator 1‐alpha (Pgc1α). G6Pase catalyzes the reaction that allows glucose to be exported into circulation, while PCK1 is responsible for the first committed step of gluconeogenesis and is therefore crucial for glucose homeostasis (see Fig. 6F for a schematic). Here, VC significantly increased both Pck1 and G6Pase expression in the LFD group (Fig. 6D). A known positive regulator of gluconeogenesis is PGC1α. In line with the observations on Pck1 expression, VC also increased Pgc1α expression in the absence of HFD (Fig. 6D,F).
To assess systemic glucose metabolism, we performed an OGTT, ITT, and PTT at 6 and 11 weeks of exposure. While there were no differences with VC to the corresponding control groups at the 11‐week time point (not shown), differences were observed at the 6‐week time point (Fig. 6E). In the absence of HFD, VC caused no changes in oral glucose tolerance and insulin tolerance; however, it significantly increased glucose levels in the PTT, indicating an increase in gluconeogenesis. As expected, HFD significantly increased glucose intolerance, with elevated peak blood‐glucose concentrations at the 15‐minute time point. Importantly, VC significantly enhanced this effect, indicating a further decrease in glucose tolerance. Additionally, VC decreased insulin sensitivity in the HFD group; however, no differences were observed for HFD ± VC in the PTT (Fig. 6E).
VC IMPAIRS MITOCHONDRIAL RESPIRATION
Mitochondrial function is indicative not only of cellular function but also of altered mitochondrial respiration; moreover, oxidative capacity is a hallmark of several liver diseases. Previous work by our group demonstrated that VC metabolites directly damage mitochondrial membrane potential and decrease both oxygen consumption and maximum mitochondrial capacity in primary hepatocytes.25 We therefore examined the effects of VC inhalation on mitochondrial function in this model. Seahorse bioenergetic analysis was performed on isolated hepatic mitochondria from mice of all treatment groups at 6, 8, and 12 weeks of exposure. Similar results were observed for all time points (Fig. 7A). Importantly, independent of diet, VC significantly decreased all these indices, indicating that VC directly impairs hepatic mitochondrial electron transport chain function and respiratory capacity at all time points (6 weeks shown). Analogous to previous data by Tuner et al.,26 mitochondria isolated from HFD‐fed animals exhibited higher respiration at each time point over their LFD control counterparts. Importantly, VC still impaired respiration in this group. To further examine metabolic dysregulation, we measured plasma lactate levels (Fig. 7B). Lactate is a marker of a switch in cellular glycolytic flux to anaerobic glycolysis; consequently, when oxygen levels fall, lactate levels increase.27, 28 VC significantly increased lactate levels in the LFD group, and although HFD also increased lactate levels, this was not further enhanced by VC. Moreover, plasma β‐hydroxybutyrate concentrations were determined for all groups as an index for ketone body formation during β‐oxidation (Fig. 7C). At any time point of exposure, VC did not increase levels of β‐hydroxybutyrate either in the LFD or in the HFD group, indicating that the mitochondrial dysfunction observed in this model did not impact β‐oxidation of FFAs. Additionally, mitochondrial protein concentration and expression of mitochondrial genes were not affected by VC (Supporting Figs. 1 and 2).
Figure 7.
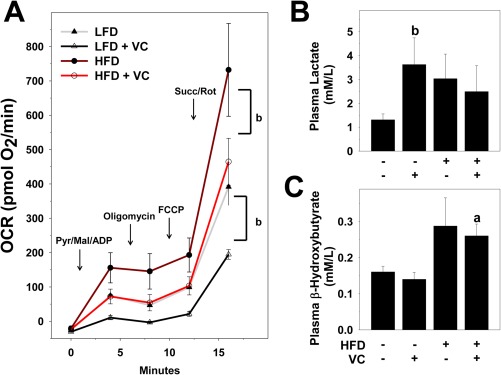
VC decreased mitochondrial respiration. (A) Seahorse analysis of isolated hepatic mitochondria at 6 weeks of exposure. (B) Lactate levels were determined from plasma samples at 12 weeks of exposure. (C) Plasma β‐hydroxybutyrate concentrations were determined as an index for ketone bodies for the 12‐week time point. a P < 0.05 compared to LFD control; b P < 0.05 compared to absence of VC. Results are presented as mean ± SEM. Sample size per group A, n = 5; B,C, n = 10‐12. Abbreviations: ADP, adenosine diphosphate; FCCP, carbonyl cyanide‐4‐(trifluoromethoxy)phenylhydrazone; Mal, malondialdehyde; Pyr, pyruvate; Rot, rotenone; Succ, succinate.
Discussion
As noted in the Introduction, VC exposure is known to cause malignant and nonmalignant liver disease. In 1975, OSHA set stricter regulatory and exposure guidelines for VC, which greatly reduced the risks of acute exposure to high concentrations of VC. A major paradigm shift in environmental research in the past has been to “exposure biology,” which focuses on the impact of moderate/low chronic exposures in contrast to high/occupational acute exposures. The risk for low‐dose chronic VC exposure remains a concern for workers and residential populations living in close proximity to industrial sites.10 Furthermore, because most experimental studies with VC have employed very high levels of exposure (>100 ppm) and focused mainly on carcinogenicity,29, 30 the potential impact of lower chronic exposure is not known. The major goal of the current study was to develop a mouse model of chronic low‐level exposure to fill the gaps in our understanding.
Exposure biology also recognizes underlying disorders that may modify risk are a critical consideration. The pandemic of obesity is arguably the most prevalent underlying disorder that impacts the U.S. population. More than two thirds of the American population is at risk for developing obesity‐associated NAFLD, which is the hepatic arm of metabolic syndrome. Several studies have identified potential interactions between environmental chemicals and experimental NAFLD.31, 32, 33, 34 Although the mechanisms are incompletely understood, it is likely that these environmental chemicals enhance pathologic responses (e.g., inflammation) and/or sensitize the hepatocytes to injury. The average American BMI has increased dramatically since the VC safety levels were originally set, and a second major goal of this work was to determine the impact of VC exposure on liver damage caused by a HFD. The data presented here demonstrate that sub‐OSHA levels of VC exposure are sufficient to enhance liver injury caused by a HFD; this raises concerns for the current OSHA regulations in place. These results are in line with previous epidemiologic studies with VC exposure and comorbidities. For example, Mastrangelo et al.35 showed that VC workers were at a greater risk for developing alcoholic liver disease.
We first examined the effects of VC exposure on overall hepatic inflammation and injury. VC exposure alone caused no overt toxicity or liver damage in LFD‐fed animals (Fig. 2). VC exposure did not affect body weight gain, food consumption, or indices of liver damage (liver weight, transaminases, and histology) in this dietary group. However, VC did cause ER dilation in the LFD group (Fig. 5; and see below). The combination of HFD and VC exposure significantly enhanced liver damage as determined by histologic assessment and transaminases. Although VC enhanced HFD‐induced neutrophil recruitment to the liver (Fig. 3), it did not impact macrophage recruitment or the changes in cytokine production caused by this diet (Fig. 3). This effect can be partially explained by the observed increase in NPC apoptosis (Fig. 4C); however, this effect could also be caused by biochemical changes. For example, it has been shown that lactate suppresses toll‐like receptor 4‐ and toll‐like receptor 9‐mediated inflammatory signaling.36 Here, VC and/or the HFD increased plasma lactate levels (Fig. 7), which could thereby dampen macrophage activation (Fig. 3). The increase in neutrophil infiltration could be a result of changes to the extracellular matrix (ECM), in particular fibrin accumulation (Fig. 2A). Specifically, fibrin ECM facilitates neutrophil chemotaxis and activation.37 However, neutrophils have also been shown to play a significant role in the breakdown of fibrin ECM, and neutrophil recruitment may be a result of an increased need for ECM degradation.38
Fibrin ECM accumulates through two pathways, deposition and impaired degradation.39 A major inhibitor of fibrin degradation is PAI‐1. Interestingly, we found that levels of PAI‐1 did not change, suggesting that fibrin accumulation is likely caused by an increase in coagulation. Indeed, plasma TAT levels were increased, indicating that de novo fibrin deposition by the coagulation cascade contributes to liver injury and oxidative stress under these conditions. Taken together, although inflammation and fibrin accumulation were increased, these changes appear secondary, and it is unlikely that an enhancement of inflammation caused by VC was predominantly responsible for the increase in liver damage observed under these conditions.
Cave et al.10 showed that occupational VC exposure increases plasma total cytokeratin 18 but not the caspase‐cleaved isoform; these results are indicative of an increase in frank necrosis in lieu of apoptosis in the liver.40 Similar results were observed here. Although the increase in hepatic caspase 3 activity caused by HFD was enhanced by VC exposure, the number of TUNEL‐positive hepatocytes did not change, suggesting that apoptosis does not play a major role in hepatocyte cell death. Such findings are not unique and have been observed under conditions where metabolic stressors sensitize the liver to injury, especially under conditions of adenosine triphosphate depletion (see below).41 In contrast, the number of TUNEL‐positive NPCs, such as Kupffer cells, increased, which at least, in part, explains the low number of macrophages in this group.
Although VC exposure alone caused no overt histologic damage to livers of LFD‐fed mice (Figs. 2, 3, 4), it did cause subtle metabolic changes, which may explain the sensitization of VC‐exposed livers to a HFD. Most notably, VC exposure significantly decreased mitochondrial respiration and maximum respiratory capacity in isolated mitochondria both in LFD‐ and HFD‐fed animals (Fig. 7). These data indicate that VC exposure directly damages complex I and II, leading to uncoupling of the electron transport chain. Metabolic stress caused by mitochondrial damage often increases energy demand and turnover by the cell. Indeed, VC exposure to LFD‐fed mice induced glycolysis and depleted hepatic glycogen reserves, despite inducing hepatic gluconeogenesis genes (e.g., Pgc1α and Pck1; Fig. 6).42 The increase in plasma lactate caused by VC exposure (Fig. 7) is also indicative of increased glycolytic flux, as lactate production is a direct result of the glycolytic pathway.43
The impact of VC exposure on the mitochondria seems relatively specific for components of the electron transport chain. For example, similar to published data of a cohort of VC‐exposed humans,9 mitochondria fatty acid β‐oxidation, another key mitochondrial source of cellular energy, was unaffected by VC exposure (Fig. 7C). In line with that, no general damage to mitochondrial DNA or protein was observed under these conditions. More importantly, the expression of mitochondrial “quality control genes,” which are key for maintaining overall mitochondrial homeostasis,44 were also unaffected. These results point toward a targeted attack of select mitochondrial functions by VC exposure rather than a general nonspecific damaging effect (Supporting Figs. 1 and 2). Taken together, these data suggest that although VC causes no overt hepatic injury in LFD‐fed mice, metabolic dysregulation sensitizes the liver to other stressors (e.g., HFD).
Because the pathologic responses (e.g., inflammation) caused by HFD were equivocally changed by VC exposure, we investigated the impact of VC exposure on the sensitivity of the liver. Specifically, we tested the hypotheses that VC impairs critical energy metabolism and thereby increases the susceptibility of the liver to injury. Oxidative and ER stress are often coupled events and part of a “vicious cycle” that is hypothesized to propagate fatty liver diseases.45, 46, 47 Here, VC enhanced the accumulation of oxidatively damaged proteins caused by the HFD (Fig. 2). This effect was concomitant with enhanced activation of ER stress as evidenced by a robust dilation of the ER and a mildly increased expression of ER stress markers caused by VC (Fig. 5). Previously, we demonstrated that VC metabolites damage mitochondria and increase electron leakage in cultured hepatocytes,15 an effect recapitulated here with VC exposure in vivo (Fig. 7). Mitochondrial damage may be both a cause and effect of oxidative/ER stress in hepatocytes and likely plays a key role in the mechanisms by which VC enhanced HFD‐induced liver injury (Fig. 8).48 This intense depression of mitochondrial activity and subsequent adenosine triphosphate depletion likely contributes to enhanced injury, increased reactive oxygen species production, and increased hepatocyte necrosis (see above).
Figure 8.
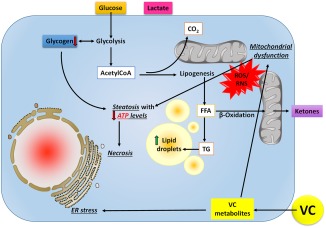
Working hypothesis. Upon exposure to VC, reactive intermediates form although biological activation processes and diet‐induced obesity decrease their elimination. Through carbonyl stress and the generation of reactive oxygen and nitrogen species, VC metabolites cause ER stress leading to mitochondrial damage, which impairs oxidative phosphorylation; the cell increases flux through glycolysis to compensate for this loss of ATP yield. The increased demand for glucose depletes glycogen stores. Acetyl‐CoA is shunted to lipid synthesis (causing steatosis) rather than β‐oxidation, even under conditions of ATP depletion, resulting in an increase in lactate production. The combined metabolic stress of VC exposure and ATP depletion likely causes liponecrosis associated with increased oxidative stress, ER stress, and inefficient mitochondrial respiration and energy production. Abbreviations: ATP, adenosine triphosphate; CoA, coenzyme A; RNS, reactive nitrogen species; ROS, reactive oxygen species; TG, triglyceride.
Taken together, these data show that VC exposure at levels currently considered safe (i.e., below OSHA limits) is sufficient to exacerbate experimental NAFLD. Although VC exposure alone is not hepatotoxic, it does cause the liver to be more susceptible to damage from a secondary insult by decreasing mitochondrial function, leading to ER stress. This study reinforces the need to mimic human exposure more accurately, taking into consideration multiple factors for studying disease and pathology. Further studies are needed to elucidate mechanisms by which VC damages the electron transport chain and enhances the ER stress response. Importantly, this study also raises concerns that current OSHA regulations on VC exposure may not be stringent enough and supports the need for further investigations into low‐level toxicant exposure and its effect on liver and the progression of NAFLD.
Author names in bold designate shared co‐first authorship.
Supporting information
Additional Supporting Information may be found at onlinelibrary.wiley.com/doi/10.1002/hep4.1151/full.
Supporting Information
Acknowledgment
This paper is dedicated to the memory of Dr. Steven R. Myers (1956‐2016), whose contributions to the field as a scientist, teacher, and colleague are immense. His early and enthusiastic support of this project was critical to its success. It is also dedicated to Clifton H. Gosser, whose technical expertise made this work possible.
Potential conflict of interest: Nothing to report.
Supported by awards from the National Institutes of Health (K01 DK096042, R03 DK107912 to J.B.; T32ES011564, R01AA021978 to G.A.; P42 ES023716 to J.B. and G.A.); two Institutional Development Awards from the National Institute of General Medical Sciences of the National Institutes of Health (grant numbers P20 GM10349, P20GM113226 to J.B. and G.A.); and the National Institute on Alcohol Abuse and Alcoholism of the National Institutes of Health (award number P50AA024337 to J.B. and G.A.).
The content is solely the responsibility of the authors and does not necessarily represent the official views of the National Institutes of Health.
REFERENCES
- 1. Agency for Toxic Substances and Disease Registry (ATSDR) . Toxicological profile for vinyl chloride. Atlanta, GA: U.S. Department of Health and Human Services, Public Health Service; 2006. [Google Scholar]
- 2. Sass JB, Castleman B, Wallinga D. Vinyl chloride: a case study of data suppression and misrepresentation. Environ Health Perspect 2005;113:809‐812. [DOI] [PMC free article] [PubMed] [Google Scholar]
- 3. International Agency for Research on Cancer . IARC Monographs on the Evaluation of Carcinogenic Risks to Humans. 1,3‐Butadiene, ethylene oxide and vinyl halides (vinyl fluoride, vinyl chloride and vinyl bromide). 2008;97:311‐426. [PMC free article] [PubMed] [Google Scholar]
- 4. Kielhorn J, Melber C, Wahnschaffe U, Aitio A, Mangelsdorf I. Vinyl chloride: still a cause for concern. Environ Health Perspect 2000;108:579‐588. [DOI] [PMC free article] [PubMed] [Google Scholar]
- 5. McKone TE, Knezovich JP. The transfer of trichloroethylene (TCE) from a shower to indoor air: experimental measurements and their implications. J Air Waste Manage Assoc 1991;41:282‐286. [DOI] [PubMed] [Google Scholar]
- 6. Pepelko WE, Foureman GL, Cogliano VJ. Toxicological review of vinyl chloride: in support of summary information on the Integrated Risk Information System (IRIS). Washington DC: U.S. Environmental Protection Agency; 2000. [Google Scholar]
- 7. Tamburro CH, Makk L, Popper H. Early hepatic histologic alterations among chemical (vinyl monomer) workers. Hepatology 1984;4:413‐418. [DOI] [PubMed] [Google Scholar]
- 8. Block JB. Angiosarcoma of the liver following vinyl chloride exposure. JAMA 1974;229:53‐54. [PubMed] [Google Scholar]
- 9. Guardiola JJ, Beier JI, Falkner KC, Wheeler B, McClain CJ, Cave M. Occupational exposures at a polyvinyl chloride production facility are associated with significant changes to the plasma metabolome. Toxicol Appl Pharmacol 2016;313:47‐56. [DOI] [PMC free article] [PubMed] [Google Scholar]
- 10. Cave M, Falkner KC, Ray M, Joshi‐Barve S, Brock G, Khan R, et al. Toxicant‐associated steatohepatitis in vinyl chloride workers. Hepatology 2010;51:474‐481. [DOI] [PMC free article] [PubMed] [Google Scholar]
- 11. Flegal KM, Carroll MD, Ogden CL, Curtin LR. Prevalence and trends in obesity among US adults, 1999‐2008. JAMA 2010;303:235‐241. [DOI] [PubMed] [Google Scholar]
- 12. Day CP, James OF. Steatohepatitis: a tale of two “hits”? Gastroenterology 1998;114:842‐845. [DOI] [PubMed] [Google Scholar]
- 13. Foulds CE, Trevino LS, York B, Walker CL. Endocrine‐disrupting chemicals and fatty liver disease. Nat Rev Endocrinol 2017;13:445‐457. [DOI] [PMC free article] [PubMed] [Google Scholar]
- 14. Loomba R, Sanyal AJ. The global NAFLD epidemic. Nat Rev Gastroenterol Hepatol 2013;10:686‐690. [DOI] [PubMed] [Google Scholar]
- 15. Anders LC, Yeo H, Kaelin BR, Lang AL, Bushau AM, Douglas AN, et al. Role of dietary fatty acids in liver injury caused by vinyl chloride metabolites in mice. Toxicol Appl Pharmacol 2016;311:34‐41. [DOI] [PMC free article] [PubMed] [Google Scholar]
- 16. Drew RT, Boorman GA, Haseman JK, McConnell EE, Busey WM, Moore JA. The effect of age and exposure duration on cancer induction by a known carcinogen in rats, mice, and hamsters. Toxicol Appl Pharmacol 1983;68:120‐130. [DOI] [PubMed] [Google Scholar]
- 17. Wieckowski MR, Giorgi C, Lebiedzinska M, Duszynski J, Pinton P. Isolation of mitochondria‐associated membranes and mitochondria from animal tissues and cells. Nat Protoc 2009;4:1582‐1590. [DOI] [PubMed] [Google Scholar]
- 18. Beier JI, Luyendyk JP, Guo L, von Montfort C, Staunton DE, Arteel GE. Fibrin accumulation plays a critical role in the sensitization to lipopolysaccharide‐induced liver injury caused by ethanol in mice. Hepatology 2009;49:1545‐1553. [DOI] [PMC free article] [PubMed] [Google Scholar]
- 19. Bligh EG, Dyer WJ. A rapid method of total lipid extraction and purification. Can J Biochem Physiol 1959;37:911‐917. [DOI] [PubMed] [Google Scholar]
- 20. Yang H, Ni HM, Guo F, Ding Y, Shi YH, Lahiri P, et al. Sequestosome 1/p62 protein is associated with autophagic removal of excess hepatic endoplasmic reticulum in mice. J Biol Chem 2016;291:18663‐18674. [DOI] [PMC free article] [PubMed] [Google Scholar]
- 21. Solaini G, Baracca A, Lenaz G, Sgarbi G. Hypoxia and mitochondrial oxidative metabolism. Biochim Biophys Acta 2010;1797:1171‐1177. [DOI] [PubMed] [Google Scholar]
- 22. Luyendyk JP, Shaw PJ, Green CD, Maddox JF, Ganey PE, Roth RA. Coagulation‐mediated hypoxia and neutrophil‐dependent hepatic injury in rats given lipopolysaccharide and ranitidine. J Pharmacol Exp Ther 2005;314:1023‐1031. [DOI] [PubMed] [Google Scholar]
- 23. Wieckowska A, Zein NN, Yerian LM, Lopez AR, McCullough AJ, Feldstein AE. In vivo assessment of liver cell apoptosis as a novel biomarker of disease severity in nonalcoholic fatty liver disease. Hepatology 2006;44:27‐33. [DOI] [PubMed] [Google Scholar]
- 24. Zheng X, Xu F, Liang H, Cao H, Cai M, Xu W, et al. SIRT1/HSF1/HSP pathway is essential for exenatide‐alleviated, lipid‐induced hepatic endoplasmic reticulum stress. Hepatology 2017;66:809‐824. [DOI] [PubMed] [Google Scholar]
- 25. Anders LC, Lang AL, Anwar‐Mohamed A, Douglas AN, Bushau AM, Falkner KC, et al. Vinyl chloride metabolites potentiate inflammatory liver injury caused by LPS in mice. Toxicol Sci 2016;151:312‐323. [DOI] [PMC free article] [PubMed] [Google Scholar]
- 26. Turner N, Bruce CR, Beale SM, Hoehn KL, So T, Rolph MS, et al. Excess lipid availability increases mitochondrial fatty acid oxidative capacity in muscle: evidence against a role for reduced fatty acid oxidation in lipid‐induced insulin resistance in rodents. Diabetes 2007;56:2085‐2092. [DOI] [PubMed] [Google Scholar]
- 27. eSlaa T, Teitell MA. Techniques to monitor glycolysis. Methods Enzymol 2014;542:91‐114. [DOI] [PMC free article] [PubMed] [Google Scholar]
- 28. Birnbaum LS. Applying research to public health questions: biologically relevant exposures. Environ Health Perspect 2010;118:A152. [DOI] [PMC free article] [PubMed] [Google Scholar]
- 29. Morinello EJ, Koc H, Ranasinghe A, Swenberg JA. Differential induction of N,3‐ethenoguanine in rat brain and liver after exposure to vinyl chloride. Cancer Res 2002;62:5183‐5188. [PubMed] [Google Scholar]
- 30. Maltoni C, Lefemine G, Ciliberti A, Cotti G, Carretti D. Carcinogenicity bioassays of vinyl chloride monomer: a model of risk assessment on an experimental basis. Environ Health Perspect 1981;41:3‐29. [DOI] [PMC free article] [PubMed] [Google Scholar]
- 31. Shan Q, Huang F, Wang J, Du Y. Effects of co‐exposure to 2,3,7,8‐tetrachlorodibenzo‐p‐dioxin and polychlorinated biphenyls on nonalcoholic fatty liver disease in mice. Environ Toxicol 2015;30:1364‐1374. [DOI] [PubMed] [Google Scholar]
- 32. Wei J, Sun X, Chen Y, Li Y, Song L, Zhou Z, et al. Perinatal exposure to bisphenol A exacerbates nonalcoholic steatohepatitis‐like phenotype in male rat offspring fed on a high‐fat diet. J Endocrinol 2014;222:313‐325. [DOI] [PubMed] [Google Scholar]
- 33. Tan X, Xie G, Sun X, Li Q, Zhong W, Qiao P, et al. High fat diet feeding exaggerates perfluorooctanoic acid‐induced liver injury in mice via modulating multiple metabolic pathways. PLoS One 2013;8:e61409. [DOI] [PMC free article] [PubMed] [Google Scholar]
- 34. Wahlang B, Falkner KC, Gregory B, Ansert D, Young D, Conklin DJ, et al. Polychlorinated biphenyl 153 is a diet‐dependent obesogen that worsens nonalcoholic fatty liver disease in male C57BL6/J mice. J Nutr Biochem 2013;24:1587‐1595. [DOI] [PMC free article] [PubMed] [Google Scholar]
- 35. Mastrangelo G, Fedeli U, Fadda E, Valentini F, Agnesi R, Magarotto G, et al. Increased risk of hepatocellular carcinoma and liver cirrhosis in vinyl chloride workers: synergistic effect of occupational exposure with alcohol intake. Environ Health Perspect 2004;112:1188‐1192. [DOI] [PMC free article] [PubMed] [Google Scholar]
- 36. Hoque R, Farooq A, Ghani A, Gorelick F, Mehal WZ. Lactate reduces liver and pancreatic injury in Toll‐like receptor‐ and inflammasome‐mediated inflammation via GPR81‐mediated suppression of innate immunity. Gastroenterology 2014;146:1763‐1774. [DOI] [PMC free article] [PubMed] [Google Scholar]
- 37. Loike JD, el Khoury J, Cao L, Richards CP, Rascoff H, Mandeville JT, et al. Fibrin regulates neutrophil migration in response to interleukin 8, leukotriene B4, tumor necrosis factor, and formyl‐methionyl‐leucyl‐phenylalanine. J Exp Med 1995;181:1763‐1772. [DOI] [PMC free article] [PubMed] [Google Scholar]
- 38. Adams SA, Kelly SL, Kirsch RE, Robson SC, Shephard EG. Role of neutrophil membrane proteases in fibrin degradation. Blood Coagul Fibrinolysis 1995;6:693‐702. [DOI] [PubMed] [Google Scholar]
- 39. Beier JI, Arteel GE. Alcoholic liver disease and the potential role of plasminogen activator inhibitor‐1 and fibrin metabolism. Exp Biol Med (Maywood) 2012;237:1‐9. [DOI] [PMC free article] [PubMed] [Google Scholar]
- 40. Cave M, Falkner KC, Henry L, Costello B, Gregory B, McClain CJ. Serum cytokeratin 18 and cytokine elevations suggest a high prevalence of occupational liver disease in highly exposed elastomer/polymer workers. J Occup Environ Med 2011;53:1128‐1133. [DOI] [PMC free article] [PubMed] [Google Scholar]
- 41. Jaeschke H, Gores GJ, Cederbaum AI, Hinson JA, Pessayre D, Lemasters JJ. Mechanisms of hepatotoxicity. Toxicol Sci 2002;65:166‐176. [DOI] [PubMed] [Google Scholar]
- 42. Fernandez‐Marcos PJ, Auwerx J. Regulation of PGC‐1alpha, a nodal regulator of mitochondrial biogenesis. Am J Clin Nutr 2011;93:884S‐8890S. [DOI] [PMC free article] [PubMed] [Google Scholar]
- 43. Rogatzki MJ, Ferguson BS, Goodwin ML, Gladden LB. Lactate is always the end product of glycolysis. Front Neurosci 2015;9:22. [DOI] [PMC free article] [PubMed] [Google Scholar]
- 44. Ni HM, Williams JA, Ding WX. Mitochondrial dynamics and mitochondrial quality control. Redox Biol 2015;4:6‐13. [DOI] [PMC free article] [PubMed] [Google Scholar]
- 45. Videla LA, Rodrigo R, Orellana M, Fernandez V, Tapia G, Quinones L, et al. Oxidative stress‐related parameters in the liver of non‐alcoholic fatty liver disease patients. Clin Sci (Lond) 2004;106:261‐268. [DOI] [PubMed] [Google Scholar]
- 46. Egnatchik RA, Leamy AK, Jacobson DA, Shiota M, Young JD. ER calcium release promotes mitochondrial dysfunction and hepatic cell lipotoxicity in response to palmitate overload. Mol Metab 2014;3:544‐553. [DOI] [PMC free article] [PubMed] [Google Scholar]
- 47. Puri P, Mirshahi F, Cheung O, Natarajan R, Maher JW, Kellum JM, et al. Activation and dysregulation of the unfolded protein response in nonalcoholic fatty liver disease. Gastroenterology 2008;134:568‐576. [DOI] [PubMed] [Google Scholar]
- 48. Satapati S, Kucejova B, Duarte JA, Fletcher JA, Reynolds L, Sunny NE, et al. Mitochondrial metabolism mediates oxidative stress and inflammation in fatty liver. J Clin Invest 2015;125:4447‐4462. Erratum in: J Clin Invest 2016;126:1605. [DOI] [PMC free article] [PubMed] [Google Scholar]
Associated Data
This section collects any data citations, data availability statements, or supplementary materials included in this article.
Supplementary Materials
Additional Supporting Information may be found at onlinelibrary.wiley.com/doi/10.1002/hep4.1151/full.
Supporting Information


