

Summary
Default differentiation of human pluripotent stem cells has been promoted as a model of cortical development. In this study, a developmental transcriptome analysis of default-differentiated hPSNs revealed a gene expression program resembling in vivo CGE/LGE subpallial domains and GABAergic signaling. A combination of bioinformatic, functional, and immunocytochemical analysis further revealed that hPSNs consist of both cortical glutamatergic and CGE-like GABAergic neurons. This study provides a comprehensive characterization of the heterogeneous group of neurons produced by default differentiation and insight into future directed differentiation strategies.
Keywords: human pluripotent stem cells, cortical neurons, subpallium, CGE, development, microarray, COUPTFII, CALB2
Highlights
-
•
Multiple time point transcriptome analysis of default hPSC differentiation
-
•
Resultant neurons resemble a pan-cortical population with multiple layer markers
-
•
CGE/LGE-specific transcripts are expressed to near exclusion of MGE markers
-
•
Immunocytochemistry reveals CGE markers in hPSN subpopulation
Default differentiation of human pluripotent stem cell-derived neurons (hPSNs) is thought to be a model of cortical differentiation. The authors performed transcriptome, time-course analysis of developing and mature hPSNs. In addition to cortical glutamatergic neurons, default differentiation led to significant CGE/LGE-specific GABAergic patterning. This work comprehensively characterizes the heterogeneity of neurons produced by default differentiation.
Introduction
Human pluripotent stem cells (hPSCs) and their CNS derivatives present a model system for the study of brain development (Shi et al., 2012) and the generation of cell populations to understand and treat disease (Takahashi et al., 2007). As the neocortex has undergone significant evolutionary expansion in primates (Hofman, 2014), much effort has focused on directing differentiation of cortical cell types to potentially uncover primate- or even human-specific mechanisms of development (Hill and Walsh, 2005, Rakic, 2009). In vivo, cortical specification involves the coordinated activation or repression of multiple morphogen pathways (Hébert and Fishell, 2008). Thus, various hPSC differentiation strategies have been used to target morphogens such as fibroblast growth factor (FGF) (Pasca et al., 2015), sonic hedgehog (SHH) (van de Leemput et al., 2014), and wingless (WNT) (Mariani et al., 2012), with all reporting similar cortical phenotypes being generated.
Despite the complexity of in vivo morphogen integration, multiple studies have reported the generation of cortical-like neurons from hPSCs without additional factors, using so-called “default” differentiation (Espuny-Camacho et al., 2013). Default differentiated hPSC-derived neurons (hPSNs) stain positive for both deep (CTIP2, TBR1) and superficial layer markers (BRN2, SATB2; Espuny-Camacho et al., 2013). However, hPSNs differentiated by default methods have been shown to produce a significant proportion of GABAergic neurons. Up to 50% of spontaneous post-synaptic currents are inhibitory (Larsen et al., 2016, Weick et al., 2013), consistent with their relatively early generation during development in both rodent (Ben-Ari et al., 1989) and human cortex (Zecevic et al., 2011). As GABAergic neurons are thought to be generated in subpallial domains (Wonders and Anderson, 2006), their presence in default patterned hPSNs suggests that a thorough characterization of this population is critically important to determine to what extent they recapitulate in vivo human cortical development. In addition, this knowledge will help inform future methods for directing particular subpopulations of neurons to more accurately model corticogenesis.
Here, we present a developmental transcriptome analysis during default differentiation to determine both the temporal maturation and regional specification profile of hPSNs. We used sophisticated bioinformatic tools to determine the regional and temporal patterning of hPSNs in relation to in vivo human samples across developmental time and brain region (Stein et al., 2014). This analysis confirmed previous findings showing default hPSNs resemble human early to mid gestational stages and express forebrain-derived neuronal markers. However, in addition to the robust expression of cortical glutamatergic markers, SFEB-derived hPSNs also show upregulation of multiple subpallial GABAergic neuron markers, including ASCL1, DLX1/2/5/6, and ISL1. In addition, we found robust expression of a set of genes that overlap with those of caudal and lateral ganglionic eminence (CGE/LGE) populations (e.g., COUPTFII, MEIS1/2, PBX1) but not medial (MGE)-derived neurons (GBX1/2, LHX6/8, NKX2-1). Immunocytochemical analyses revealed robust labeling of the DLX family members, COUPTFII, and CALB2. Together with functional analyses, our findings suggest that a large proportion of default-patterned hPSNs resemble CGE/LGE-like GABAergic neurons to the exclusion of MGE-like cells.
Results
Developmental Transcriptome Analysis of SFEB-Derived hPSNs
Figure 1A illustrates the experimental paradigm for transcript analysis during default patterning and neuronal maturation. The six time points were chosen based on previously defined morphological, biochemical, and physiological changes that indicate significant transitions from pluripotency to functional post-mitotic neurons (Johnson et al., 2007, LaVaute et al., 2009). For instance, cells at day 6 contain a heterogeneous population expressing both pluripotent genes as well as neural markers (Huang et al., 2016), while day 10 represents a population of neural progenitor cells that are >95% PAX6+ (LaVaute et al., 2009). Day 17 corresponds to a period when the majority of cells are still neural progenitors, but an initial, small proportion of βIII-Tubulin+ post-mitotic neurons (PMNs) can be observed (Weick et al., 2009). Day 30 corresponds to a time point when a significant proportion of cells are immature PMNs that lack functional properties and SYN1 staining appears diffuse, while day 50 represents a period when robust spiking and synaptic activity are observed along with punctate SYN1 staining (Johnson et al., 2007). Following quality control assessments, we performed a one-way ANOVA with Benjamini and Hochberg correction and used a false discovery rate of 0.05 on the entire dataset (21,735 gene-level transcripts; Table S1, tab 1). This analysis revealed 11,006 transcripts whose abundance was significantly altered at least 1.5-fold (Figure 1B; Table S1, tab 2). Unbiased hierarchical clustering analysis revealed that biological replicates from the same time point, as well as samples from similar time points, clustered together. The samples from days 0–17 and days 30–50 initially segregated into two major clusters (Figure 1C, clusters A and B) likely due to the highly significant differences between PMNs (days 30–50) and progenitor cells (days 0–17). However, the samples from days 0–6 and days 10–17 were further separated into clusters A1 and A2, which was confirmed by principal component analysis (Figure 1D). The plot in Figure 1D highlights the three independent clusters (days 0–6, days 10–17, and days 30–50), indicating that samples related in time were also more similar in gene expression.
Figure 1.

Summary of Experimental Design and Unbiased Cluster Analysis of Microarray Data
(A) Timeline illustrating the default differentiation (serum-free embryoid body) method for human pluripotent stem cells (left; hPSCs) to human pluripotent stem cell-derived neurons (right). Day 0–17 illustrations are bright-field images; day 30–50 images illustrate neurons labeled with βIII-Tubulin (red) and DAPI (blue); day 50 image also shows staining for SYN1 (green). EBs, embryoid bodies.
(B) Heatmap illustrating 11,006 transcripts with at least 1.5-fold alteration following one-way ANOVA with Benjamini and Hochberg correction of microarray data (see also Table S1, tab 2). Color bar represents the degree of upregulation (red) or downregulation (green).
(C) Heatmap illustrating unbiased clusters. Large red boxes represent primary clusters (A-B); subscripts identify secondary clusters (A1-A2).
(D) Principal component analysis of all data shows three primary groupings (days 0–6, days 10–17, and days 30–50).
SFEB Induces Robust Forebrain Marker Expression
We used the NIH database tool DAVID (v6.7) to identify enriched Gene Ontology (GO) categories for the 500 most significantly upregulated transcripts at various stages. When comparing all time points during differentiation (e.g., days 6–50) with hPSCs (day 0), the top GO categories were related to neuronal differentiation, including “forebrain development” and “axonogenesis” (Figure 2A). Interestingly, by comparing early neuroepithelial populations (days 10–17; LaVaute et al., 2009, Meyer et al., 2011) with hPSCs (day 0), we found similar results, with enrichment for categories including “forebrain development” and “telencephalon development” (Table S2, tab 2). Transcription factors involved with forebrain development (e.g., FOXG1, LHX2), along with transcripts important for neurogenesis (e.g., DCX) were similarly upregulated by day 17 (Figures 2B and 2C). Consistent with the later onset of gliogenesis, two genes related to astrocyte development (S100β and GFAP) were only significantly upregulated at day 50 (Figure 2C). Ingenuity pathway analysis (IPA) was used to confirm that predicted gene interactions were maintained in developing hPSNs. Figure 2D displays IPA results for the HUB gene PAX6, which identified many upregulated factors (red arrows), while others such as CDK2, CDC6, and MCM3 were downregulated (green lines).
Figure 2.

Default Differentiation Results in Highly Enriched Neuroectodermal Patterning
(A) Pie chart illustrating the most enriched Gene Ontology (GO) categories identified by NIH DAVID (v6.7) for the top 500 upregulated genes at days 6–50 compared with day 0 (see Table S2 for details). Numbers in pie slices indicate the percentage of top 500 genes grouped within that category. Box illustrates top 5 GO sub-categories within the “Nervous System Development” category.
(B and C) Plots illustrating expression of neuroectodermal and pluripotent transcripts altered at early time points (days 6–10; B) and neural-specific and glial-specific transcripts altered at later time points (days 10–50; C; see also Figure S1). The y axis is log2 scaled; values represent mean expression, error bars represent SEM.
(D) Ingenuity pathway analysis using PAX6 as a hub gene illustrates conserved PAX6-regulated pathways, cellular compartments, and category of protein products. IPA-predicted directional changes were confirmed in our dataset (red and green lines illustrate up- and downregulated genes, respectively). ∗ denotes that IPA resolved multiple data values for individual genes to a single value.
Importantly, pluripotent markers POU5F1 (OCT4) and NANOG were significantly downregulated by day 6 (Figure 2B) and markers for endodermal and mesodermal lineages were not expressed (Figures S1A and S1B). Together, these data support previous findings that hPSCs differentiated via default SFEB methods strongly represent forebrain neuroectoderm at the transcriptome level.
hPSNs Display Functional Markers and Developmental Transitions In Vitro
Consistent with the functional maturation of hPSNs after day 30, GO results for comparisons between late time points (days 30–50) and earlier time points (days 6–17) identified categories such as “synaptic transmission,” “transmission of nerve impulse,” and “neuron projection development” (Figure 3A). Individual upregulated genes associated with the GO category “synaptic transmission” (Figure 3A) encode both pre- and post-synaptic proteins (Figures 3B and 3C). Although many individual genes involved with glutamatergic neurotransmission were upregulated during differentiation (Figures 3B and 3C), GO analysis identified the “gamma-aminobutyric acid signaling” but not the “glutamic acid signaling” pathway as significantly enriched (Figure 3A; Table S2, tab 3). Lastly, two genes involved with cell proliferation (Gunsalus et al., 2012), the microRNA LIN28 and neuron-restrictive silencing factor/RE1-silencing transcription factor (NRSF/REST), were significantly downregulated after day 17 (Figure 3D).
Figure 3.

Temporal Maturation of hPSNs
(A) Pie chart illustrating the most enriched Gene Ontology (GO) categories identified by NIH DAVID (v6.7) for the top 500 upregulated genes at days 30–50 compared with days 6–17 (see Table S2 for details). Box illustrates top 5 GO sub-categories within the “Nervous System Development” category.
(B–D) Plots illustrating differentiation stage-dependent expression of selected pre-synaptic (B), post-synaptic (C), and neural repressive transcripts (D). Error bars represent SEM.
(E) TMAP analysis illustrates overlap between gene expression during in vivo developmental period transitions for human cortex and hPSNs at day 50 (see also Figure S2A).
(F) CoNTExT algorithm trained on spatiotemporal human brain gene expression prediction for the developmental period of individual in vitro samples of hPSCs (day 0) and hPSNs (day 50).
To better identify the temporal and regional patterning of SFEB-derived hPSNs, we compared our data with that of in vivo developing human brain samples (Allen Brain Atlas) using bioinformatic tools (Stein et al., 2014). We used transition mapping (TMAP) to compare genes that were differentially expressed between day 0 and day 50 samples with those of human cortical samples from time points spanning 4–8 post-conception weeks (pcw) to >20 years of age (Figure 3E). This analysis identified a strong degree of overlap between highly expressed genes at day 0 with early embryonic periods, while day 50 hPSNs showed strong overlap with mid-gestational time points (box “1 versus 6”; max –log10(p value) > 460; Figure 3E). To validate these data, we performed the same analysis on a wild-type iPSC line (DS2U) (Weick et al., 2013) and found similar results (Figure S2A). As many of the genes that are upregulated during early neuronal development are maintained into adulthood, some overlap of upregulated genes was also observed for genes differentially expressed between adult and embryonic stages (box “1 versus 13”). However, comparisons between period “2” and later time points produced little correlation, likely due to the presence of a significant number of PMNs during period 2 (9–10 pcw), which reduces the number of changed genes at later time points.
While TMAP compares pooled data between samples, the machine learning algorithm classification of neuroanatomical and temporal expression via transcriptomics (CoNTExT) characterizes the temporal identity of individual samples. Similar to TMAP, CoNTExT revealed a strong overlap of hPSC gene expression with in vivo developmental period 1 (4–8 pcw), while day 50 neurons were strongly correlated with later periods (16–19 pcw; Figure 3F), consistent with previous reports using various differentiation strategies (Stein et al., 2014). Of note, while hPSNs at day 50 do not mimic postnatal or adult time points, their correlation with 112–133 day-old embryos (16–19 pcw) does represent a significantly advanced temporal progression. However, it should be noted that removal of neuroepithelia from samples at days 30 and 50 likely enhanced this correlation due to the relative enrichment of PMNs. The individual variability was minimal as indicated by low color variation (correlation values) between samples, suggesting the SFEB differentiation paradigm is highly repeatable.
SFEB-Derived hPSNs Demonstrate Pallial and Subpallial Gene Expression Patterns
While default patterning of hPSCs is thought to drive dorsal forebrain phenotypes, arealization of SFEB-derived neurons remains relatively unknown. Figure 4A illustrates the expression profile of multiple regional markers identified in rodents that correspond to anterior-medial (SP8), anterior-lateral (PAX6), posterior-medial (EMX2), and posterior-lateral (COUP-TF1/NR2F1) regions (Hansen et al., 2011). All four of these factors were significantly upregulated by day 6 in default-differentiated hPSNs and remained high for the duration of the culture period. Although the pattern of expression of SP8, EMX2, and NR2F1 in human brain remains unknown, the universal expression of PAX6 in hPSC-derived neural progenitors (Zhang et al., 2010) suggests that these markers do not show the same regional differences as rodent brain (see Discussion). Additional upregulated factors related to cortical development included LIX1, SIX3, DACH1, and MEIS1 (Figure S2B). TMAP comparisons between relatively late time point hPSNs (day 50 for WA09 and day 30 for DS2U) and various in vivo cortical layers revealed strong overlap of both upregulated and downregulated genes when comparing progenitor domains (ventricular and subventricular zones) with early cortical domains containing PMNs (IZ, SP, CP, MZ; Figure 4D). These data suggest the presence of a mixed population of progenitors and PMNs, despite enrichment for PMNs. Several recent studies have focused on establishing an in vitro model of cortical development using hPSNs, which demonstrates appropriate temporal profiles for the appearance of individual layer-specific gene products (Espuny-Camacho et al., 2013). We also observed significant upregulation of layer-specific markers including layer 1 (reelin, RLN), subplate (CNTN2, TBR1), superficial layers (BRN2, SATB2), and deep layers (CTIP2, TBR1), but most showed similar temporal profiles (Figure 4B). The one exception was the superficial layer marker SATB2, which was only upregulated at day 50.
Figure 4.

Default Differentiated hPSNs Adopt Pallial and Subpallial Identities
(A and B) Plots illustrating expression of cortical regionalization (A) and mature cortical layer-specific transcripts (B; see Figure S2B). Error bars represent SEM.
(C) CoNTExT algorithm predicted regional identity of WA09 (left panel) and DS2U hPSNs (right panel; also see Figures S2B and S3). WGCNA analyses support these findings (see Figure S4).
(D) TMAP analysis illustrates overlap between gene expression during in vivo cortical laminar transitions and differentiating hPSNs (WA09, day 50, top panel; DS2U, day 30, bottom panel).
In addition to temporal analysis, CoNTExT also incorporates regional patterning data from hundreds of different brain regions over multiple developmental time points. Of significance, SFEB-derived hPSNs from the WA09 line showed equivalent overlap in gene expression patterns with in vivo samples from both “Cortex” and “Striatum” (Figure 4C, left). Again we repeated analyses in the DS2U line, which also showed strong overlap with both “Cortex” and in vivo human “Striatum” (Figure 4C, right). Lower degrees of overlap were seen for “Hippocampus,” “Amygdala,” “Thalamus,” and “Cerebellum” for both cell lines (Figure 4B). To test the utility of this dataset to potentially inform chemically mediated differentiation strategies, we compared it with two previously published datasets from hPSC-derived neurons. First, we compared SFEB-derived neurons with those differentiated in the presence of DKK1 (lines PGP-1 and i03-01), a WNT antagonist commonly used to drive cortical differentiation (Mariani et al., 2012, Watanabe et al., 2005). When predicting regional identity of day 50 hPSNs, samples strongly correlated with Cortex and Hippocampus, with little or no overlap with other regions, including Striatum (Figure S3A). In addition, Pasca et al. used EGF/FGF2 to expand cortical spheroids that show nearly identical temporal maturation at day 50 compared with day 50 default-differentiated hPSNs (Pasca et al., 2015). However, while these cells resemble cortex to a greater degree than SFEB-derived hPSNs (Figure S3B), they also show a significant overlap with Cerebellar gene expression patterns, similar to previously published results of monolayer differentiated cells (Stein et al., 2014). Thus, the dataset from default-patterned neurons represents a foundation upon which to compare the effects of small-molecule-based differentiation strategies on regional patterning and suggests previously unappreciated diversity in hPSNs generated by various treatments.
Lastly, we used weighted gene co-expression network analysis (WGCNA) of cortical samples to understand the preservation of neurodevelopmental biological processes in addition to temporal and regional predictions. This network was constructed based on co-expression of genes in developing human cortex (Kang et al., 2011) and validated in another in vivo dataset of developing cortex, allowing for the identification of the most robust modules (Table S3; Stein et al., 2014). Both WA09- and DS2U-derived hPSNs showed robust preservation of cortical pathways, with 18/28 and 17/28 modules showing significantly preserved Z scores, respectively (Figure S4A, Table S3, see Experimental Procedures). Conserved modules included those related to ion transport (red), synapse assembly and vesicle transport (cyan), and glutamatergic synaptic transmission (green), but not gliogenesis (yellow) or blood vessel development (light cyan).
Subpallial Gene Expression Patterns Resemble In Vivo CGE/LGE
The CoNTExT analysis, which revealed a correlation between default-derived neurons with in vivo striatal samples, is intriguing given previous reports of GABAergic neurons in these cultures (Mariani et al., 2012, Weick et al., 2013). Of note, the label of “Striatum” is somewhat misleading due to the fact that the datasets used to create CoNTExT also include multiple subpallial domains during early forebrain development, including the MGE, LGE, and CGE from 8 to 9 pcw (Stein et al., 2014). To investigate the conserved gene regulatory networks involved with subpallial differentiation, we constructed a WGCNA network for “subpallial developmental processes” (modules listed in Table S4). WGCNA for default-differentiated hPSNs from both WA09 (Figure S4B, upper panel) and DS2U (Figure S4B, lower panel) revealed significant preservation in 9/14 modules for both cell lines. Significantly, preserved processes include cell cycle and interneuron development (blue) as well as ion transport (red). WGCNA-identified hub genes for these specific modules include DLX1/2, ARX, SP8, and ASCL1, all of which are markers for subpallial domains (Long et al., 2009).
To better determine the regional identity of the GABAergic population, we analyzed the expression profiles of genes determined from in vivo studies to be involved in GABAergic neuron specification. SFEB-derived hPSNs showed robust expression of many GABAergic progenitor markers, including members of the Distal-less family, all of which begin to be upregulated as early as day 17 (DLX1/2/5/6; Figure 5A). DLX family members expressed in the nervous system appear in subcortical telencephalic tissue starting around embryonic day 9.5 in mouse, which correlates to human embryonic day 22 (Ghanem et al., 2007, Theiler, 2013). Importantly, day 17 of hPSC differentiation in vitro corresponds to neural tube formation at around day 21 in vivo. In addition, hPSNs expressed the mature IN markers Calretinin (CALB2), Neuropeptide Y (NPY), Somatostatin (SST), and the substance P precursor Tachykinin 1 (TAC1; Figure 5B). In contrast, at the latest time point we analyzed (day 50), we found no expression of Calbindin (CALB1), Cholecystokinin (CCK), Parvalbumin (PVALB), and the serotonin receptor 3A (HTR3A; Figure 5C). Many genes involved with GABAergic neurotransmission were also highly upregulated at later time points (Figure 5C).
Figure 5.
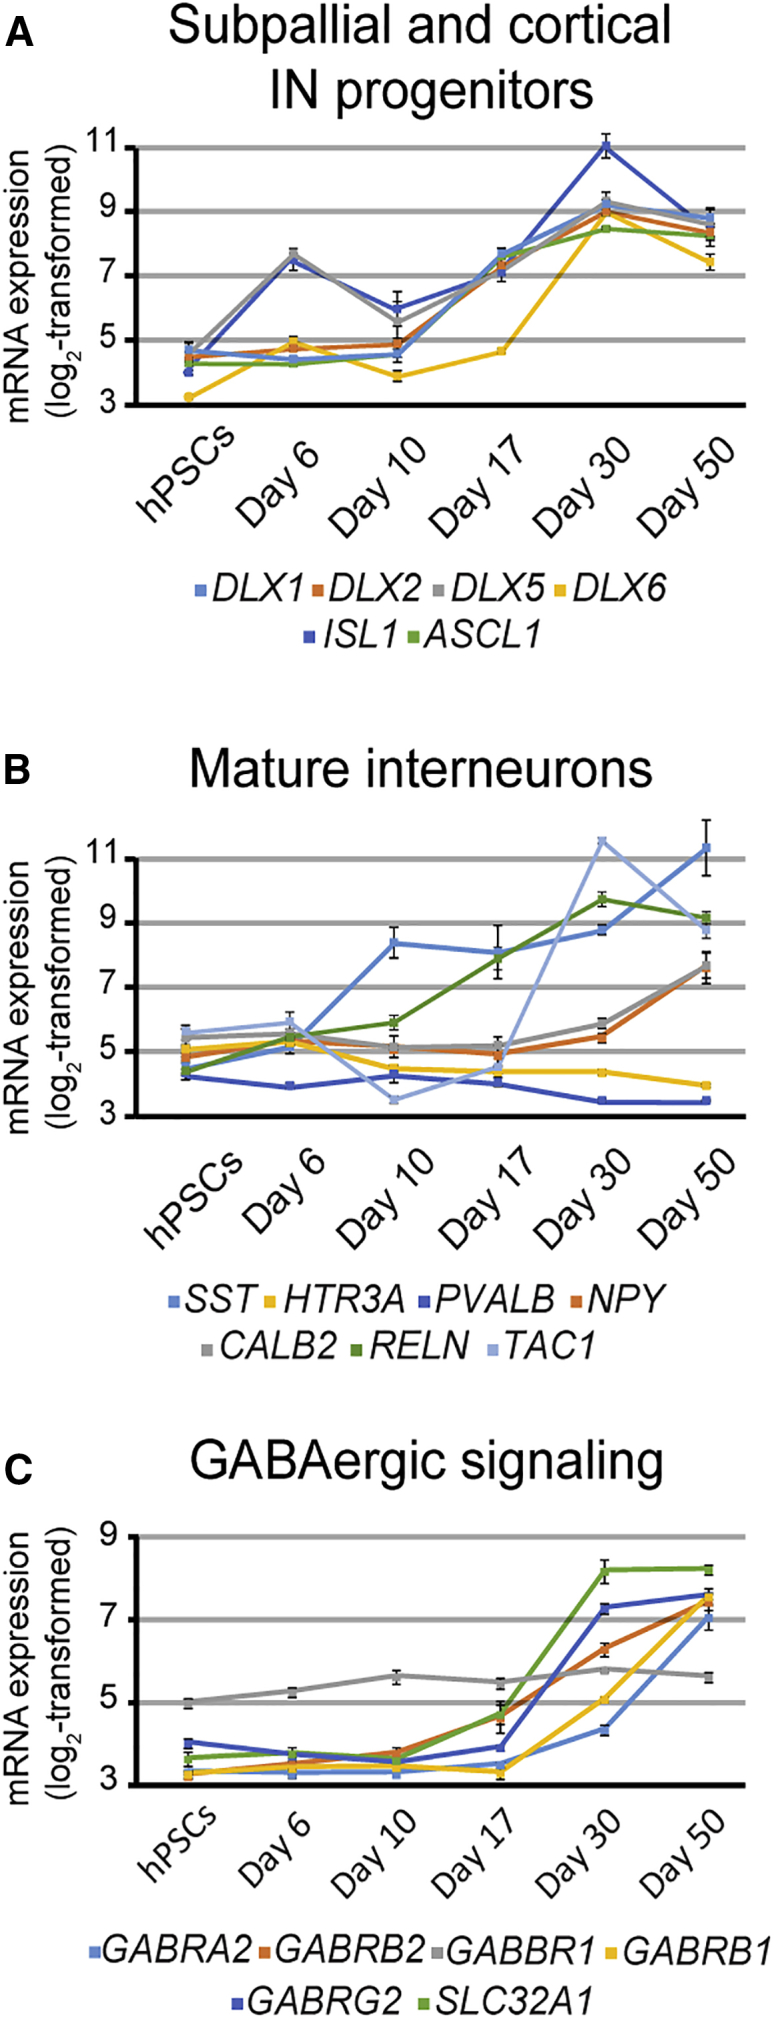
Default Patterned hPSNs Express Common Subpallial and Interneuron Transcripts
(A–C) Plots illustrating expression of subpallial and cortical interneuron progenitors (A), mature interneurons (B), GABAergic synapse markers (C). Error bars represent SEM.
To further elucidate whether hPSNs identify more closely with a specific subpallial domain, we examined selected CGE/LGE-, and MGE-specific markers (Long et al., 2009, Nord et al., 2015) from array and qPCR assays. Figure 6A shows expression of individual CGE/LGE-specific markers (left panel) and MGE markers (middle panel). The right panel reveals that SFEB-derived hPSNs display significantly greater mean expression of CGE/LGE markers compared with MGE markers at all time points based on array data (Figure 6A, right panel, p < 0.05). qPCR analysis of day 50 samples confirmed these array findings, illustrating a significant upregulation in 8 out of 9 CGE/LGE-specific markers compared with 1 out of 7 MGE-specific markers for all three cell lines tested (Figure 6B; χ2 = 8.905, p < 0.01).
Figure 6.

SFEB-Derived hPSNs Express a Preponderance of CGE/LGE- but Not MGE-Specific Markers
(A) Plots illustrating expression of CGE/LGE-specific (left), MGE-specific (middle) markers from array data. Mean expression of CGE/LGE transcripts was significantly greater than MGE transcripts (right; two-way repeated measures ANOVA, F(1,14) = 4.66, p = 0.048).
(B) Plots illustrating qPCR for markers specific for CGE/LGE transcripts (blue) and MGE transcripts (orange). Chi squared analysis revealed significantly greater CGE/LGE marker expression in WA09- (left panel), WA01- (middle), and DS2U-derived hPSNs (right panel; χ2 = 8.905, p < 0.005 for each group). Data are presented as ΔΔCt relative to GAPDH, n = 3 biological replicates.
Error bars represent SEM.
We further probed the identity of the GABAergic population produced via immunocytochemical labeling of progenitors and PMNs. We found that a significant proportion of neuroepithelia stained positive for a pan-DLX antibody (Figure 7A, middle, merge) that recognizes all members of the DLX family expressed in the nervous system (Liu et al., 1997). In addition, many DLX+ progenitors from both WA01 and WA09 also stained for COUPTFII, indicative of a CGE/LGE-like phenotype (Figures 7A and 7E; Kanatani et al., 2008). Furthermore, we found that approximately 40% of neurons that had migrated away from neurospheres stained positive for CALB2 (Figures 7B–7E), a marker of GABAergic interneurons derived from the CGE in vivo (Miyoshi et al., 2010). This is the same proportion of WA01 neurons that were found positive for both CALB2 (Figures 7D and 7E) and GABA (Figure 7E), and very similar to the overall proportion of neurons derived from WA09 and DS2U that stain positive for GABA (Larsen et al., 2016, Weick et al., 2013). The presence of functional GABAergic neurons derived from WA01 was demonstrated via physiological recordings of excitatory and inhibitory post-synaptic currents (EPSCs and IPSCs; Figures 7F–7H). The overall proportion and mean amplitude of EPSCs and IPSCs was nearly identical to previously published reports from other cell lines (Figures 7F–7H; Larsen et al., 2016, Pre et al., 2014, Weick et al., 2013).
Figure 7.

Default Differentiation Produces Functional CGE-like GABAergic Neurons
(A–C) Representative confocal images illustrating the expression of progenitor markers DLX (green) and COUPTFII (A, red) as well as the mature CGE marker CALB2 (B, green) but not the MGE-derived marker PVALB (C, green) from WA09-derived cells; neurons are co-stained for βIII-Tubulin or MAP2 (B-C, red).
(D) Paired confocal images from WA01-derived neurons stained for CALB2 (green) and MAP2 (red) at day 50. Scale bars represent 30 μm for (A–D).
(E) Quantification of pooled data illustrates the proportion of neurons expressing various CGE and IN markers. Bars represent mean ± SEM. n = 3 biological replicates.
(F) Representative traces from whole-cell patch-clamp recordings from WA01-derived hPSNs illustrating the presence of EPSCs (downward deflections) and IPSCs (upward deflections).
(G and H) Pooled data demonstrate mean frequency (G) and amplitude (H) of EPSCs (dark gray bars) and IPSCs (light gray bars) in default-patterned WA01 hPSNs (d45-50). Error bars indicate SEM. n = 21 neurons from three biological replicates.
Discussion
We used bioinformatic analysis of developmental transcriptome array data to compare default-patterned hPSNs with in vivo human brain samples. These data present a unique picture of the temporal and spatial identity of a heterogeneous but forebrain-specific population of hPSNs. Temporally, day 50 hPSNs correspond to early to mid stages of fetal development, likely due to the preponderance of neurons relative to other CNS cell types such as astrocytes and oligodendrocytes, which develop at later stages (Qian et al., 2000). Spatially, default-patterned hPSNs express dorsal cortical markers that span cortical layers as well as A-P patterning. Lastly, we identified a significant population of neurons with a unique CGE/LGE-like phenotype at the RNA and protein level and a lack of MGE-specific marker expression.
In vivo, MGE-derived INs are thought to comprise approximately 60% of cortical interneurons with CGE-derived interneurons supplying an additional 30% (Wonders and Anderson, 2006). While the MGE is thought to produce the majority of PVALB and SST INs that reside in mature cortex, CGE-derived INs comprise a unique population that include the Calretinin (CALB2) and Reelin-expressing subtypes (Miyoshi et al., 2010). Interestingly, with the notable exception of SST in our dataset, transcript expression for both Calretinin and Reelin far exceed those for other IN subtypes. However, despite initial attempts, we were unable to conclusively demonstrate SST or Reelin via immunocytochemical labeling. This may be due to the fact that extended time courses (up to 30 weeks) are needed to identify fully mature IN phenotypes in hPSNs (Maroof et al., 2013, Nicholas et al., 2013) as well as in vivo (Bartolini et al., 2013, Canty et al., 2009). Interestingly, the presence of NPY and Tachykinin (precursor for substance P) mRNA was observed in array and qPCR analysis, suggesting the presence of a small population of other types of INs or the co-expression of these peptide hormones in CALB2-, SST-, and/or Reelin-expressing neurons (Cauli et al., 1997, Markram et al., 2004). In vivo, NPY, SST, and substance P have been found to be expressed in interneuron progenitors as early as 13.5 weeks in rodents (Batista-Brito et al., 2008), 1 week after CGE interneurons begin to appear (Miyoshi and Fishell, 2010). CGE interneurons, especially VIP-expressing subtypes, typically occupy cortical layers II/III after migration (Rudy et al., 2011). Because layers II/III develop relatively late in gestation (Fame et al., 2011), it may be that CGE-like hPSNs need longer to fully express neuropeptides such as VIP. Future studies using extended culture durations are needed to determine the full complement of IN marker expression of CGE-derived neuronal markers.
In addition to CALB2 and Reelin, genetic fate mapping has revealed that COUPTFII can distinguish CGE-derived interneurons from LGE-derived neurons (Miyoshi et al., 2010). Kanatani et al. used microarray and in situ hybridization to reveal that COUPTFII is predominantly expressed in the CGE and the ventral border between LGE and MGE. In addition, heterotopic transplantation of COUPTFII-overexpressing MGE cells into E13.5 CGE results in caudal migration of MGE cells, suggesting that COUP-TFII is sufficient to change the migratory direction of MGE-derived cells to caudal (Kanatani et al., 2008). Importantly, immunohistochemical analysis revealed that COUPTFII is robustly expressed in caudal cortex compared with more rostral regions in human fetal tissue at 15–22 gestational weeks, and that there may be a human-specific role of COUPTFII as its expression in human tissue occurs relatively earlier compared with later CGE-derived neurons in rodents (Miyoshi and Fishell, 2010). Taken together, these data suggest that default patterned hPSNs produce a CGE-like subpopulation of GABAergic neurons in addition to the remaining cortical glutamatergic phenotype.
One interesting finding related to the GABAergic gene expression of default-patterned neurons is that SHH appears to be dispensable. This is supported by a complete absence of NKX2-1 expression (Maroof et al., 2013, Nicholas et al., 2013), previously shown to require SHH signaling for its induction (Anderson et al., 2001, Xu et al., 2005). SHH robustly induces ventral, MGE-like phenotypes in developing hPSNs (Maroof et al., 2013, Nicholas et al., 2013). While the in vivo requirement for SHH signaling remains unclear for non-MGE-derived GABAergic neurons, multiple reports using mouse and human stem cell-derived neurons used SHH to promote CGE/LGE-like phenotypes (Danjo et al., 2011, Ma et al., 2012). In addition, others suggest that SHH antagonism is able to promote dorsalization and cortical excitatory neuron generation from hPSCs (van de Leemput et al., 2014). In contrast, one study found that SHH antagonism did not alter a number of GABAergic or glutamatergic markers in hPSNs (Espuny-Camacho et al., 2013), consistent with the absence of SHH expression in untreated hPSNs (Mariani et al., 2012, Maroof et al., 2013).
In addition to blocking SHH, inhibition of WNT signaling is thought to drive more dorsal cortical fates of differentiating PSCs from both mouse and human sources (Mariani et al., 2012, Sasai, 2005). Previous studies using neurons treated with DKK1 expressed little if any of the DLX family normally expressed in nervous tissue (DLX1/2/5/6; Liu et al., 1997, Saino-Saito et al., 2003), as well as the mature IN markers GAD1/2, VGAT, and several post-synaptic GABARs (Mariani et al., 2012). WNT signaling is involved in early telencephalic development, particularly during dorsal/ventral axis patterning of the forebrain (Harrison-Uy and Pleasure, 2012, Watanabe et al., 2005). Inactivation of canonical WNT signaling upregulates ventral forebrain markers such as GSX2, ASCL1, and DLX2 (Chenn, 2008). However, WNT inhibition was not sufficient to completely suppress GABAergic neuron generation (Mariani et al., 2012, Mertens et al., 2015), suggesting additional signals are also critical. Importantly, WNT signaling has also been shown to be involved in anteroposterior patterning by promoting caudalization (Nordström et al., 2002). Therefore, it would be important to further dissect the timing of DKK1 application and its effect on dorsoventral versus anteroposterior patterning.
Lastly, the current data support the use of this model system to examine human-specific transcriptional patterns, as arealization of SFEB-derived neurons diverges from rodent cortex, but largely mimics in vivo human patterning. For example, a PAX6 gradient exists in developing rodent brain but is lost after gestational week 8 in humans (Ip et al., 2010). Zhang et al. (2010) confirmed that human stem cell-derived neuroepithelial cells express PAX6 prior to SOX1, opposing findings in mouse forebrain (Walther and Gruss, 1991) and suggesting a human-specific role for PAX6 during neural patterning. Furthermore, default-derived hPSNs show overlapping expression of ASCL1 and PAX6. ASCL1 was shown to be highly expressed in the subpallial region in developing mouse brain (Finger et al., 2017, Stenman et al., 2003), while Pax6 is specific to the pallium (Puelles et al., 2000). As hPSNs form appropriate transmitter phenotypes and functional glutamatergic and GABAergic synaptic connections, these two disparate populations appear to have a unique genetic signature in hPSNs, and possibly in in vivo human brain (BrainSpan Atlas; Miller et al., 2014). Interestingly, others have suggested that, unlike rodents, primates generate a substantial proportion of GABAergic interneurons from pallial progenitors (Petanjek et al., 2009), which may explain unique marker expression patterns in hPSNs. Thus, a more complete understanding of hPSC differentiation may continue to reveal differences from rodent development and uncover human-specific mechanisms for directed differentiation.
Experimental Procedures
The current study was approved by the Embryonic Stem Cell Research Oversight (ESCRO) Committee at the University of New Mexico-Health Sciences Center.
Cell Culture and Sample Preparation
hPSCs were maintained on MEF feeder layers and differentiated to neurons according to previous studies (Johnson et al., 2007). On day 20, and during collection of day 30 and 50 samples (see below), embryoid bodies that adopted a “vesicle-like” appearance were removed (Meyer et al., 2011); non-vesicular neurospheres were plated on day 21 and transitioned to neural differentiation medium. RNA from three independent biological replicates from each time point was harvested using Trizol according to the manufacturer's protocol (Sigma, St. Louis, MO). Samples from days 0–17 represent whole RNA extraction from all cells present in the culture either in monolayer (days 0 and 17) or as floating spheres (days 6 and 10). Samples taken on days 30 and 50 represent the product of neurospheres (n = 6–10/coverslip) plated on day 21 on coverslips and allowed to differentiate until the time indicated. To enrich for PMNs at these time points, half of visible spheres that contained a mixture of progenitors and PMNs and all vesicular clusters with non-neuronal morphology were removed mechanically, and Trizol was applied to the remaining adherent cells (n = 10–12 coverslips/time point).
Microarray and Data Analysis
RNA samples (>5 μg) were processed and run on the Affymetrix U133plus2 microarray platform according to the manufacturer's specifications (Thermo Fisher Scientific, Waltham, MA). Quality control and data processing were performed on open access and custom Bioconductor packages as described previously (Kang et al., 2012). Detailed methods can be found in the Supplemental Experimental Procedures. A two-way repeated measure ANOVA was used to compare mean expression values between individual markers and across timepoints.
Kegg/GO Analysis
The Database for Annotation, Visualization and Integrated Discovery (DAVID; v6.7) was used for GO and KEGG pathway analysis for all datasets. For GO analysis, datasets were analyzed using R Bioconductor and sorted by positive fold change and adjusted p value in Microsoft Excel; the top 500 gene IDs for the various time-point comparisons were input for analysis. IPA (QIAGEN, Venlo, Limburg, Netherlands) was performed online to confirm predicted gene interactions.
CoNTExT, TMAP, WGCNA
Transcriptome data from samples of day 0 hPSCs and day 50 hPSNs and in vivo samples from the Allen Brain Atlas were fed into the CoNTExT analysis framework (Stein et al., 2014). TMAP was done between in vivo developmental periods or laminae in the developing cortex (Stein et al., 2014) and our pooled samples. Preservation analysis was conducted using a previously established WGCNA module for cortical samples. In addition, we constructed a WGCNA network based on co-expression of genes in the developing human striatal region (periods 1–8) (Langfelder and Horvath, 2008, Zhang and Horvath, 2005) using previously published data (Kang et al., 2011).
qPCR
qPCR analysis of cDNA transcripts was performed as described previously (Larsen et al., 2016). qPCR primers for all amplicons are listed in Supplemental Experimental Procedures (Schmittgen and Livak, 2008).
Immunocytochemistry
Immunocytochemistry was as described previously (Larsen et al., 2016). Primary antibodies consisted of monoclonal COUPTFII (1:500; Perseus Proteomics PP-H7147-00, Tokyo, Japan), polyclonal panDLX (1:1000; gift from Dr. Yury Morozov, Yale University, New Haven, CT), monoclonal βIII-Tubulin (1:5,000; Sigma T8660), polyclonal Calretinin (CALB2; 1:1000; Swant 7697, Switzerland), monoclonal Parvalbumin (1:5000; Swant PV235), and polyclonal MAP2 (1:2000; BioLegend 822501, San Diego, CA). Secondary antibodies used were: anti-mouse CF555, anti-rabbit CF488 (both at 1:2000; Sigma SAB4600060 and SAB4600036), and anti-chicken CF647 (1:500; Sigma SAB4600179).
Electrophysiology
Whole-cell patch-clamp recordings were performed and analyzed as previously reported (Larsen et al., 2016) with minor modifications. Detailed methods can be found in the Supplemental Experimental Procedures.
Author Contributions
C.M.F. contributed to collection and/or assembly of data, analysis and interpretation, manuscript writing, and final approval of the manuscript. R.D., H.K., and J.L.S. contributed to assembly of data, analysis and interpretation, and final approval of the manuscript. J.P.W. conceived and designed the study and contributed to financial support, provision of study materials, collection and/or assembly of data, analysis and interpretation, manuscript writing, and final approval of the manuscript.
Acknowledgments
We would like to thank Kharli Brockmeier for her assistance with experimental procedures and Drs. Flora Vaccarino and Daniel Geschwind for providing valuable advice and datasets. This project was funded by a P20 center grant from NIGMS (GM109089).
Published: October 26, 2017
Footnotes
Supplemental Information includes Supplemental Experimental Procedures, four figures, and four tables and can be found with this article online at https://doi.org/10.1016/j.stemcr.2017.09.023.
Accession Numbers
All .cel files have been deposited at NCBI and can be accessed via accession number GEO: GSE93351 for WA09 samples and GEO: GSE48611 for DS2U samples.
Supplemental Information
References
- Anderson S.A., Marín O., Horn C., Jennings K., Rubenstein J. Distinct cortical migrations from the medial and lateral ganglionic eminences. Development. 2001;128:353–363. doi: 10.1242/dev.128.3.353. [DOI] [PubMed] [Google Scholar]
- Bartolini G., Ciceri G., Marín O. Integration of GABAergic interneurons into cortical cell assemblies: lessons from embryos and adults. Neuron. 2013;79:849–864. doi: 10.1016/j.neuron.2013.08.014. [DOI] [PubMed] [Google Scholar]
- Batista-Brito R., Machold R., Klein C., Fishell G. Gene expression in cortical interneuron precursors is prescient of their mature function. Cereb. Cortex. 2008;18:2306–2317. doi: 10.1093/cercor/bhm258. [DOI] [PMC free article] [PubMed] [Google Scholar]
- Ben-Ari Y., Cherubini E., Corradetti R., Gaiarsa J. Giant synaptic potentials in immature rat CA3 hippocampal neurones. J. Physiol. 1989;416:303–325. doi: 10.1113/jphysiol.1989.sp017762. [DOI] [PMC free article] [PubMed] [Google Scholar]
- Canty A.J., Dietze J., Harvey M., Enomoto H., Milbrandt J., Ibáñez C.F. Regionalized loss of parvalbumin interneurons in the cerebral cortex of mice with deficits in GFRα1 signaling. J. Neurosci. 2009;29:10695–10705. doi: 10.1523/JNEUROSCI.2658-09.2009. [DOI] [PMC free article] [PubMed] [Google Scholar]
- Cauli B., Audinat E., Lambolez B., Angulo M.C., Ropert N., Tsuzuki K., Hestrin S., Rossier J. Molecular and physiological diversity of cortical nonpyramidal cells. J. Neurosci. 1997;17:3894–3906. doi: 10.1523/JNEUROSCI.17-10-03894.1997. [DOI] [PMC free article] [PubMed] [Google Scholar]
- Chenn A. Wnt/β-catenin signaling in cerebral cortical development. Organogenesis. 2008;4:76–80. doi: 10.4161/org.4.2.5852. [DOI] [PMC free article] [PubMed] [Google Scholar]
- Danjo T., Eiraku M., Muguruma K., Watanabe K., Kawada M., Yanagawa Y., Rubenstein J.L., Sasai Y. Subregional specification of embryonic stem cell-derived ventral telencephalic tissues by timed and combinatory treatment with extrinsic signals. J. Neurosci. 2011;31:1919–1933. doi: 10.1523/JNEUROSCI.5128-10.2011. [DOI] [PMC free article] [PubMed] [Google Scholar]
- Espuny-Camacho I., Michelsen K.A., Gall D., Linaro D., Hasche A., Bonnefont J., Bali C., Orduz D., Bilheu A., Herpoel A. Pyramidal neurons derived from human pluripotent stem cells integrate efficiently into mouse brain circuits in vivo. Neuron. 2013;77:440–456. doi: 10.1016/j.neuron.2012.12.011. [DOI] [PubMed] [Google Scholar]
- Fame R.M., MacDonald J.L., Macklis J.D. Development, specification, and diversity of callosal projection neurons. Trends Neurosci. 2011;34:41–50. doi: 10.1016/j.tins.2010.10.002. [DOI] [PMC free article] [PubMed] [Google Scholar]
- Finger J.H., Smith C.M., Hayamizu T.F., McCright I.J., Xu J., Law M., Shaw D.R., Baldarelli R.M., Beal J.S., Blodgett O. The mouse gene expression database (GXD): 2017 update. Nucleic Acids Res. 2017;45:D730–D736. doi: 10.1093/nar/gkw1073. [DOI] [PMC free article] [PubMed] [Google Scholar]
- Ghanem N., Yu M., Long J., Hatch G., Rubenstein J.L., Ekker M. Distinct cis-regulatory elements from the Dlx1/Dlx2 locus mark different progenitor cell populations in the ganglionic eminences and different subtypes of adult cortical interneurons. J. Neurosci. 2007;27:5012–5022. doi: 10.1523/JNEUROSCI.4725-06.2007. [DOI] [PMC free article] [PubMed] [Google Scholar]
- Gunsalus K.T., Wagoner M.P., Meyer K., Potter W.B., Schoenike B., Kim S., Alexander C.M., Friedl A., Roopra A. Induction of the RNA regulator LIN28A is required for the growth and pathogenesis of RESTless breast tumors. Cancer Res. 2012;72:3207–3216. doi: 10.1158/0008-5472.CAN-11-1639. [DOI] [PMC free article] [PubMed] [Google Scholar]
- Hansen D.V., Rubenstein J.L., Kriegstein A.R. Deriving excitatory neurons of the neocortex from pluripotent stem cells. Neuron. 2011;70:645–660. doi: 10.1016/j.neuron.2011.05.006. [DOI] [PMC free article] [PubMed] [Google Scholar]
- Harrison-Uy S.J., Pleasure S.J. Wnt signaling and forebrain development. Cold Spring Harb. Perspect. Biol. 2012;4:a008094. doi: 10.1101/cshperspect.a008094. [DOI] [PMC free article] [PubMed] [Google Scholar]
- Hébert J.M., Fishell G. The genetics of early telencephalon patterning: some assembly required. Nat. Rev. Neurosci. 2008;9:678–685. doi: 10.1038/nrn2463. [DOI] [PMC free article] [PubMed] [Google Scholar]
- Hill R.S., Walsh C.A. Molecular insights into human brain evolution. Nature. 2005;437:64–67. doi: 10.1038/nature04103. [DOI] [PubMed] [Google Scholar]
- Hofman M. Evolution of the human brain: when bigger is better. Front. Neuroanat. 2014;8:15. doi: 10.3389/fnana.2014.00015. [DOI] [PMC free article] [PubMed] [Google Scholar]
- Huang C.T., Tao Y., Lu J., Jones J.R., Fowler L., Weick J.P., Zhang S.C. Time-course gene expression profiling reveals a novel role of non-canonical WNT signaling during neural induction. Sci. Rep. 2016;6:32600. doi: 10.1038/srep32600. [DOI] [PMC free article] [PubMed] [Google Scholar]
- Ip B.K., Wappler I., Peters H., Lindsay S., Clowry G.J., Bayatti N. Investigating gradients of gene expression involved in early human cortical development. J. Anat. 2010;217:300–311. doi: 10.1111/j.1469-7580.2010.01259.x. [DOI] [PMC free article] [PubMed] [Google Scholar]
- Johnson M.A., Weick J.P., Pearce R.A., Zhang S.C. Functional neural development from human embryonic stem cells: accelerated synaptic activity via astrocyte coculture. J. Neurosci. 2007;27:3069–3077. doi: 10.1523/JNEUROSCI.4562-06.2007. [DOI] [PMC free article] [PubMed] [Google Scholar]
- Kanatani S., Yozu M., Tabata H., Nakajima K. COUP-TFII is preferentially expressed in the caudal ganglionic eminence and is involved in the caudal migratory stream. J. Neurosci. 2008;28:13582–13591. doi: 10.1523/JNEUROSCI.2132-08.2008. [DOI] [PMC free article] [PubMed] [Google Scholar]
- Kang H.J., Kawasawa Y.I., Cheng F., Zhu Y., Xu X., Li M., Sousa A.M., Pletikos M., Meyer K.A., Sedmak G. Spatio-temporal transcriptome of the human brain. Nature. 2011;478:483–489. doi: 10.1038/nature10523. [DOI] [PMC free article] [PubMed] [Google Scholar]
- Kang H., Wilson C.S., Harvey R.C., Chen I.M., Murphy M.H., Atlas S.R., Bedrick E.J., Devidas M., Carroll A.J., Robinson B.W. Gene expression profiles predictive of outcome and age in infant acute lymphoblastic leukemia: a Children's Oncology Group study. Blood. 2012;119:1872–1881. doi: 10.1182/blood-2011-10-382861. [DOI] [PMC free article] [PubMed] [Google Scholar]
- Langfelder P., Horvath S. WGCNA: an R package for weighted correlation network analysis. BMC Bioinformatics. 2008;9:559. doi: 10.1186/1471-2105-9-559. [DOI] [PMC free article] [PubMed] [Google Scholar]
- Larsen Z.H., Chander P., Joyner J.A., Floruta C.M., Demeter T.L., Weick J.P. Effects of ethanol on cellular composition and network excitability of human pluripotent stem cell-derived neurons. Alcohol. Clin. Exp. Res. 2016;40:2339–2350. doi: 10.1111/acer.13218. [DOI] [PMC free article] [PubMed] [Google Scholar]
- LaVaute T.M., Yoo Y.D., Pankratz M.T., Weick J.P., Gerstner J.R., Zhang S.C. Regulation of neural specification from human embryonic stem cells by BMP and FGF. Stem Cells. 2009;27:1741–1749. doi: 10.1002/stem.99. [DOI] [PMC free article] [PubMed] [Google Scholar]
- Liu J.K., Ghattas I., Liu S., Chen S., Rubenstein J.L. Dlx genes encode DNA-binding proteins that are expressed in an overlapping and sequential pattern during basal ganglia differentiation. Dev. Dyn. 1997;210:498–512. doi: 10.1002/(SICI)1097-0177(199712)210:4<498::AID-AJA12>3.0.CO;2-3. [DOI] [PubMed] [Google Scholar]
- Long J.E., Cobos I., Potter G.B., Rubenstein J.L. Dlx1&2 and Mash1 transcription factors control MGE and CGE patterning and differentiation through parallel and overlapping pathways. Cereb. Cortex. 2009;19:i96–i106. doi: 10.1093/cercor/bhp045. [DOI] [PMC free article] [PubMed] [Google Scholar]
- Ma L., Hu B., Liu Y., Vermilyea S.C., Liu H., Gao L., Sun Y., Zhang X., Zhang S.C. Human embryonic stem cell-derived GABA neurons correct locomotion deficits in quinolinic acid-lesioned mice. Cell Stem Cell. 2012;10:455–464. doi: 10.1016/j.stem.2012.01.021. [DOI] [PMC free article] [PubMed] [Google Scholar]
- Mariani J., Simonini M.V., Palejev D., Tomasini L., Coppola G., Szekely A.M., Horvath T.L., Vaccarino F.M. Modeling human cortical development in vitro using induced pluripotent stem cells. Proc. Natl. Acad. Sci. USA. 2012;109:12770–12775. doi: 10.1073/pnas.1202944109. [DOI] [PMC free article] [PubMed] [Google Scholar]
- Markram H., Toledo-Rodriguez M., Wang Y., Gupta A., Silberberg G., Wu C. Interneurons of the neocortical inhibitory system. Nat. Rev. Neurosci. 2004;5:793. doi: 10.1038/nrn1519. [DOI] [PubMed] [Google Scholar]
- Maroof A.M., Keros S., Tyson J.A., Ying S.W., Ganat Y.M., Merkle F.T., Liu B., Goulburn A., Stanley E.G., Elefanty A.G. Directed differentiation and functional maturation of cortical interneurons from human embryonic stem cells. Cell Stem Cell. 2013;12:559–572. doi: 10.1016/j.stem.2013.04.008. [DOI] [PMC free article] [PubMed] [Google Scholar]
- Mertens J., Wang Q.W., Kim Y., Yu D.X., Pham S., Yang B., Zheng Y., Diffenderfer K.E., Zhang J., Soltani S. Differential responses to lithium in hyperexcitable neurons from patients with bipolar disorder. Nature. 2015;527:95–99. doi: 10.1038/nature15526. [DOI] [PMC free article] [PubMed] [Google Scholar]
- Meyer J.S., Howden S.E., Wallace K.A., Verhoeven A.D., Wright L.S., Capowski E.E., Pinilla I., Martin J.M., Tian S., Stewart R. Optic vesicle-like structures derived from human pluripotent stem cells facilitate a customized approach to retinal disease treatment. Stem Cells. 2011;29:1206–1218. doi: 10.1002/stem.674. [DOI] [PMC free article] [PubMed] [Google Scholar]
- Miller J.A., Ding S.-L., Sunkin S.M., Smith K.A., Ng L., Szafer A., Ebbert A., Riley Z.L., Royall J.J., Aiona K. Transcriptional landscape of the prenatal human brain. Nature. 2014;508:199–206. doi: 10.1038/nature13185. [DOI] [PMC free article] [PubMed] [Google Scholar]
- Miyoshi G., Fishell G. GABAergic interneuron lineages selectively sort into specific cortical layers during early postnatal development. Cereb. Cortex. 2010;21:845–852. doi: 10.1093/cercor/bhq155. [DOI] [PMC free article] [PubMed] [Google Scholar]
- Miyoshi G., Hjerling-Leffler J., Karayannis T., Sousa V.H., Butt S.J., Battiste J., Johnson J.E., Machold R.P., Fishell G. Genetic fate mapping reveals that the caudal ganglionic eminence produces a large and diverse population of superficial cortical interneurons. J. Neurosci. 2010;30:1582–1594. doi: 10.1523/JNEUROSCI.4515-09.2010. [DOI] [PMC free article] [PubMed] [Google Scholar]
- Nicholas C.R., Chen J., Tang Y., Southwell D.G., Chalmers N., Vogt D., Arnold C.M., Chen Y.J., Stanley E.G., Elefanty A.G. Functional maturation of hPSC-derived forebrain interneurons requires an extended timeline and mimics human neural development. Cell Stem Cell. 2013;12:573–586. doi: 10.1016/j.stem.2013.04.005. [DOI] [PMC free article] [PubMed] [Google Scholar]
- Nord A.S., Pattabiraman K., Visel A., Rubenstein J.L. Genomic perspectives of transcriptional regulation in forebrain development. Neuron. 2015;85:27–47. doi: 10.1016/j.neuron.2014.11.011. [DOI] [PMC free article] [PubMed] [Google Scholar]
- Nordström U., Jessell T.M., Edlund T. Progressive induction of caudal neural character by graded Wnt signaling. Nat. Neurosci. 2002;5:525. doi: 10.1038/nn0602-854. [DOI] [PubMed] [Google Scholar]
- Pasca A.M., Sloan S.A., Clarke L.E., Tian Y., Makinson C.D., Huber N., Kim C.H., Park J.Y., O'Rourke N.A., Nguyen K.D. Functional cortical neurons and astrocytes from human pluripotent stem cells in 3D culture. Nat. Methods. 2015;12:671–678. doi: 10.1038/nmeth.3415. [DOI] [PMC free article] [PubMed] [Google Scholar]
- Petanjek Z., Kostović I., Esclapez M. Primate-specific origins and migration of cortical GABAergic neurons. Front. Neuroanat. 2009;3:26. doi: 10.3389/neuro.05.026.2009. [DOI] [PMC free article] [PubMed] [Google Scholar]
- Pre D., Nestor M.W., Sproul A.A., Jacob S., Koppensteiner P., Chinchalongporn V., Zimmer M., Yamamoto A., Noggle S.A., Arancio O. A time course analysis of the electrophysiological properties of neurons differentiated from human induced pluripotent stem cells (iPSCs) PLoS One. 2014;9:e103418. doi: 10.1371/journal.pone.0103418. [DOI] [PMC free article] [PubMed] [Google Scholar]
- Puelles L., Kuwana E., Puelles E., Bulfone A., Shimamura K., Keleher J., Smiga S., Rubenstein J.L. Pallial and subpallial derivatives in the embryonic chick and mouse telencephalon, traced by the expression of the genes Dlx-2, Emx-1, Nkx-2.1, Pax-6, and Tbr-1. J. Comp. Neurol. 2000;424:409–438. doi: 10.1002/1096-9861(20000828)424:3<409::aid-cne3>3.0.co;2-7. [DOI] [PubMed] [Google Scholar]
- Qian X., Shen Q., Goderie S.K., He W., Capela A., Davis A.A., Temple S. Timing of CNS cell generation: a programmed sequence of neuron and glial cell production from isolated murine cortical stem cells. Neuron. 2000;28:69–80. doi: 10.1016/s0896-6273(00)00086-6. [DOI] [PubMed] [Google Scholar]
- Rakic P. Evolution of the neocortex: a perspective from developmental biology. Nat. Rev. Neurosci. 2009;10:724–735. doi: 10.1038/nrn2719. [DOI] [PMC free article] [PubMed] [Google Scholar]
- Rudy B., Fishell G., Lee S., Hjerling-Leffler J. Three groups of interneurons account for nearly 100% of neocortical GABAergic neurons. Dev. Neurobiol. 2011;71:45–61. doi: 10.1002/dneu.20853. [DOI] [PMC free article] [PubMed] [Google Scholar]
- Saino-Saito S., Berlin R., Baker H. Dlx-1 and Dlx-2 expression in the adult mouse brain: relationship to dopaminergic phenotypic regulation. J. Comp. Neurol. 2003;461:18–30. doi: 10.1002/cne.10611. [DOI] [PubMed] [Google Scholar]
- Sasai Y. Directed differentiation of neural and sensory tissues from embryonic stem cells in vitro. Ernst Schering Res. Found. Workshop. 2005:101–109. doi: 10.1007/3-540-37644-5_7. [DOI] [PubMed] [Google Scholar]
- Schmittgen T.D., Livak K.J. Analyzing real-time PCR data by the comparative C(T) method. Nat. Protoc. 2008;3:1101–1108. doi: 10.1038/nprot.2008.73. [DOI] [PubMed] [Google Scholar]
- Shi Y., Kirwan P., Livesey F.J. Directed differentiation of human pluripotent stem cells to cerebral cortex neurons and neural networks. Nat. Protoc. 2012;7:1836–1846. doi: 10.1038/nprot.2012.116. [DOI] [PubMed] [Google Scholar]
- Stein J.L., de la Torre-Ubieta L., Tian Y., Parikshak N.N., Hernández I.A., Marchetto M.C., Baker D.K., Lu D., Hinman C.R., Lowe J.K. A quantitative framework to evaluate modeling of cortical development by neural stem cells. Neuron. 2014;83:69–86. doi: 10.1016/j.neuron.2014.05.035. [DOI] [PMC free article] [PubMed] [Google Scholar]
- Stenman J., Toresson H., Campbell K. Identification of two distinct progenitor populations in the lateral ganglionic eminence: implications for striatal and olfactory bulb neurogenesis. J. Neurosci. 2003;23:167–174. doi: 10.1523/JNEUROSCI.23-01-00167.2003. [DOI] [PMC free article] [PubMed] [Google Scholar]
- Takahashi K., Tanabe K., Ohnuki M., Narita M., Ichisaka T., Tomoda K., Yamanaka S. Induction of pluripotent stem cells from adult human fibroblasts by defined factors. Cell. 2007;131:861–872. doi: 10.1016/j.cell.2007.11.019. [DOI] [PubMed] [Google Scholar]
- Theiler K. Springer Science & Business Media; 2013. The House Mouse: Atlas of Embryonic Development. [Google Scholar]
- van de Leemput J., Boles N.C., Kiehl T.R., Corneo B., Lederman P., Menon V., Lee C., Martinez R.A., Levi B.P., Thompson C.L. CORTECON: a temporal transcriptome analysis of in vitro human cerebral cortex development from human embryonic stem cells. Neuron. 2014;83:51–68. doi: 10.1016/j.neuron.2014.05.013. [DOI] [PubMed] [Google Scholar]
- Walther C., Gruss P. Pax-6, a murine paired box gene, is expressed in the developing CNS. Development. 1991;113:1435–1449. doi: 10.1242/dev.113.4.1435. [DOI] [PubMed] [Google Scholar]
- Watanabe K., Kamiya D., Nishiyama A., Katayama T., Nozaki S., Kawasaki H., Watanabe Y., Mizuseki K., Sasai Y. Directed differentiation of telencephalic precursors from embryonic stem cells. Nat. Neurosci. 2005;8:288–296. doi: 10.1038/nn1402. [DOI] [PubMed] [Google Scholar]
- Weick J.P., Austin Johnson M., Zhang S.C. Developmental regulation of human embryonic stem cell-derived neurons by calcium entry via transient receptor potential channels. Stem Cells. 2009;27:2906–2916. doi: 10.1002/stem.212. [DOI] [PMC free article] [PubMed] [Google Scholar]
- Weick J.P., Held D.L., Bonadurer G.F., 3rd, Doers M.E., Liu Y., Maguire C., Clark A., Knackert J.A., Molinarolo K., Musser M. Deficits in human trisomy 21 iPSCs and neurons. Proc. Natl. Acad. Sci. USA. 2013;110:9962–9967. doi: 10.1073/pnas.1216575110. [DOI] [PMC free article] [PubMed] [Google Scholar]
- Wonders C.P., Anderson S.A. The origin and specification of cortical interneurons. Nat. Rev. Neurosci. 2006;7:687–696. doi: 10.1038/nrn1954. [DOI] [PubMed] [Google Scholar]
- Xu Q., Wonders C.P., Anderson S.A. Sonic hedgehog maintains the identity of cortical interneuron progenitors in the ventral telencephalon. Development. 2005;132:4987–4998. doi: 10.1242/dev.02090. [DOI] [PubMed] [Google Scholar]
- Zecevic N., Hu F., Jakovcevski I. Interneurons in the developing human neocortex. Dev. Neurobiol. 2011;71:18–33. doi: 10.1002/dneu.20812. [DOI] [PMC free article] [PubMed] [Google Scholar]
- Zhang B., Horvath S. A general framework for weighted gene co-expression network analysis. Stat. Appl. Genet. Mol. Biol. 2005;4:1128. doi: 10.2202/1544-6115.1128. [DOI] [PubMed] [Google Scholar]
- Zhang X., Huang C.T., Chen J., Pankratz M.T., Xi J., Li J., Yang Y., Lavaute T.M., Li X.J., Ayala M. Pax6 is a human neuroectoderm cell fate determinant. Cell Stem Cell. 2010;7:90–100. doi: 10.1016/j.stem.2010.04.017. [DOI] [PMC free article] [PubMed] [Google Scholar]
Associated Data
This section collects any data citations, data availability statements, or supplementary materials included in this article.