

Abstract
Increasingly, evidence suggests that exposure to maternal obesity creates an inflammatory environment in utero, exerting long‐lasting postnatal signatures on the juvenile innate immune system and microbiome that may predispose offspring to development of fatty liver disease. We found that exposure to a maternal Western‐style diet (WD) accelerated fibrogenesis in the liver of offspring and was associated with early recruitment of proinflammatory macrophages at 8‐12 weeks and microbial dysbiosis as early as 3 weeks of age. We further demonstrated that bone marrow‐derived macrophages (BMDMs) were polarized toward an inflammatory state at 8 weeks of age and that a potent antioxidant, pyrroloquinoline quinone (PQQ), reversed BMDM metabolic reprogramming from glycolytic toward oxidative metabolism by restoring trichloroacetic acid cycle function at isocitrate dehydrogenase. This resulted in reduced inflammation and inhibited collagen fibril formation in the liver at 20 weeks of age, even when PQQ was withdrawn at 3 weeks of age. Beginning at 3 weeks of age, WD‐fed mice developed a decreased abundance of Parabacteroides and Lactobacillus, together with increased Ruminococcus and decreased tight junction gene expression by 20 weeks, whereas microbiota of mice exposed to PQQ retained compositional stability with age, which was associated with improved liver health. Conclusion: Exposure to a maternal WD induces early gut dysbiosis and disrupts intestinal tight junctions, resulting in BMDM polarization and induction of proinflammatory and profibrotic programs in the offspring that persist into adulthood. Disrupted macrophage and microbiota function can be attenuated by short‐term maternal treatment with PQQ prior to weaning, suggesting that reshaping the early gut microbiota in combination with reprogramming macrophages during early weaning may alleviate the sustained proinflammatory environment, preventing the rapid progression of nonalcoholic fatty liver disease to nonalcoholic steatohepatitis in offspring of obese mothers. (Hepatology Communications 2018;2:313‐328)
Abbreviations
- ALT
alanine aminotransferase
- AST
aspartate aminotransferase
- BMDM
bone marrow‐derived macrophage
- BSA
bovine serum albumin
- CARS
coherent anti‐Stokes Raman scattering
- CD
clusters of differentiation
- CH
chow diet
- FLIM
fluorescence lifetime intensity microscopy
- IFNγ
interferon‐gamma
- IL
interleukin
- LPS
lipopolysaccharide
- NADH
reduced nicotinamide adenine dinucleotide
- NAFLD
nonalcoholic fatty liver disease
- NASH
nonalcoholic steatohepatitis
- OXPHOS
oxidative phosphorylation
- PQQ
pyrroloquinoline quinone
- TCA
tricarboxylic acid
- TGF
transforming growth factor
- WD
Western‐style diet
Introduction
Nearly 60% of U.S. women of childbearing age are overweight or obese. Their offspring tend to have increased liver fat and regardless of sex, have increased risk of progressing to obesity and nonalcoholic fatty liver disease (NAFLD), the most prevalent liver disorder worldwide. NAFLD affects ∼34% of obese children in North America,1 up to half of whom have progressed to nonalcoholic steatohepatitis (NASH; characterized by inflammation and cellular damage in addition to steatosis) at the time of diagnosis.2 Children with NASH are more likely to have advanced fibrosis, even after adjusting for obesity.3 Both NAFLD and NASH may progress to hepatocellular carcinoma, and fatty liver disease is rapidly becoming a leading cause for liver transplant in the United States.4 However, the causative mechanisms underlying disease development are not well understood, and longitudinal studies are needed to track the progression of NAFLD that potentially begins during the perinatal period.
Evidence in rodents and nonhuman primates suggests that exposure to a high‐fat or Western‐style diet (WD; high fat, high sugar) during pregnancy and lactation creates a long‐lasting metabolic signature on the infant liver, its innate immune system, and microbiota, which together predispose the offspring to NAFLD and accelerate the transition of NAFLD to NASH.5, 6, 7 Dietary changes can have major effects on microbial composition and release of lipopolysaccharide (LPS), a key driver released by gram‐negative bacteria, that provoke inflammation, insulin resistance, and may even program bone marrow‐derived stem cells8 prior to the development of obesity. Inflammation in LPS‐exposed macrophages9 is causally linked through accumulation of mitochondrial reactive oxygen species and succinate10 secondary to metabolic reprogramming to a “Warburg” metabolism (increased aerobic glycolysis together with a reprogrammed tricarboxylic acid [TCA] cycle and decreased oxidative phosphorylation [OXPHOS]). Restoring oxidative metabolism in macrophages might attenuate proinflammatory activation and promote an anti‐inflammatory phenotype, which is thought to be required to attenuate and/or reverse fibrosis.11 Similarly, the severity of NAFLD is strongly associated with gut dysbiosis12; animal studies have demonstrated direct roles for the gut microbiota in each of the liver lesions that are observed in NAFLD, including steatosis,13 NASH,14 and fibrosis.15 Because early immune development is highly dependent on triggers provided by the microbiota,16 infants born to obese mothers might be exposed to products of gut dysbiosis that activate macrophages in the liver and bone marrow. However, the timing, mechanisms involved, and whether interventions that alter oxidative stress can prevent early innate immune system “programming” are unknown.
Our study shows that maternal obesity/diet causes critical dysbiosis of early gut microbiota during weaning that is associated with programmed dysregulation in bone marrow‐derived macrophage (BMDM) metabolism, including crucial and distinct roles in liver progression from steatosis to NASH. The novel dietary antioxidant di‐sodiated pyrroloquinoline quinone (Bio PQQ), shown to be safe in humans, may be a potent countermeasure during pregnancy and lactation for protecting against NAFLD risk in the next generation.
Materials and Methods
ANIMALS AND DIETS
All experiments were reviewed, approved, and monitored by the University of Colorado Institutional Animal Care and Use Committee in accordance with the Guide for Care and Use of Laboratory Animals published by the National Research Council.
WD accelerates steatosis and mild fibrosis17 and at 20 weeks of age recapitulates a phenotype similar to human NASH18; therefore, we used a similar formulation in our studies. Sibling C57BL/6J mice were randomly stratified into breeding groups and fed either standard chow (CH, 2019; Envigo, Indianapolis, IN) or WD (TD.88137; Envigo) ad libitum with or without BioPQQ supplementation in their drinking water (3.8 μM), as described.19 Di‐sodiated PQQ (BioPQQ) was generously provided to K. R. J. as a gift by the Mitsubishi Gas and Chemical Company. Litters were culled to five to eight mice per dam, and offspring were either continued on the maternal diets (CH, WD, or WDPQQ) or were weaned to WD without PQQ (WDPQQ/WD). A subset of CH‐fed offspring was supplemented for 2 weeks with PQQ beginning at 6 weeks of age to investigate the effects of short‐term postnatal PQQ exposure. Mice were weighed weekly. Tissues from offspring were harvested during the light cycle following a 4‐hour fast either at the time of weaning (postnatal day 21), at 12 weeks, or at ∼20‐22 weeks of age. Tissues were dissected, weighed, snap frozen, and stored at –80 °C until used or were embedded in optimal cutting temperature medium and cryosectioned. Intrahepatic mononuclear cells were isolated as described, with the exception of further purification of clusters of differentiation (CD)11b cells in order to include all macrophage populations.20 BMDMs were isolated and cultured as described.21 Up to three siblings per litter were studied from at least two breeding pairs per group; therefore, “n” represents number of mice. Data collected from male mice are presented because they respond more robustly to diet‐induced obesity than female mice.22 Body composition, measured 24‐48 hours prior to sacrifice, was determined in adult mice by using quantitative magnetic resonance (Echo MRI Whole Body Composition Analyzer; Echo Medical Systems, Houston, TX).
SERUM CHEMISTRY AND HORMONE ANALYSES
Serum was collected and stored as described.19 Aspartate aminotransferase (AST), alanine aminotransferase (ALT), cholesterol, and triglycerides were measured using standardized protocols by the University of Colorado Anschutz Department of Laboratory Services clinical laboratory. Insulin and leptin levels were measured using kits following the manufacturer's directions (Crystal Chem, Downers Grove, IL; ALPCO Diagnostics, Salem, NH, respectively).
COHERENT ANTI‐STOKES AND SPONTANEOUS RAMAN IMAGING
Coherent anti‐Stokes Raman scattering (CARS) signals to visualize lipid droplets and quantitate steatosis were obtained by combining two laser beams tuned for lipid‐specific vibrations, as described23 and in the Supporting Information. Mosaics were formed with two‐by‐two CARS images of 512 × 512 pixels, with 1.38 μm/pixel, acquired at 2,840 cm−1 Raman shift and analyzed using Analyze Particles in ImageJ (National Institutes of Health). A tabulation of the number of lipid droplets with corresponding surface areas was used to produce histograms for three different droplet size groups: small (surface area <4 μm2), medium (4‐100 μm2), and large droplets (>100 μm2). Images were acquired from eight mice per group and three cryosections per mouse liver. Spontaneous Raman spectra were acquired with a Raman microscope (InVia Confocal; Renishaw, Gloucestershire, United Kingdom) as described.23 On average, n = 24 lipid droplets were analyzed per diet group and were visualized in two separate liver sections from n = 4 mice per group for the Raman studies.
SECOND‐HARMONIC GENERATION AND TWO‐PHOTON AUTOFLUORESCENCE MICROSCOPY
Microscopy was used for label‐free fibrillary collagen imaging as described23 and in the Supporting Information. Sections (5 μm) from liver fixed in 4% paraformaldehyde and embedded in paraffin were scanned in 15 random regions of interest, n = 6 mice per group. Images were acquired at 20 × magnification and analyzed in ImageJ.
FLUORESCENCE LIFETIME INTENSITY MICROSCOPY
Fluorescence lifetime intensity microscopy (FLIM) was performed to detect changes in metabolism characterized by levels of free versus bound reduced nicotinamide adenine dinucleotide (NADH) in BMDMs, using a Zeiss 780 laser‐scanning confocal/multiphoton‐excitation fluorescence microscope, as described in the Supporting Information. Phasor transformation and data analysis were carried out using Global SimFCS (Laboratory for Fluorescence Dynamics, University of California, Irvine) as described.24 Fractional analysis of free versus bound NADH in each pixel was determined based on fluorescence lifetime corresponding to 0.4 nanosecond (bound) and 3.4 nanoseconds (free) for NADH (Supporting Fig. S1). Pixels occupied by the NADH signal were quantified in 15 images per condition. Average percentage change compared to CH was plotted for each condition using Prism 6.0 (GraphPad, San Diego, CA).
TOTAL RNA EXTRACTION AND QUANTITATIVE REAL‐TIME POLYMERASE CHAIN REACTION
RNA isolation from homogenates of snap‐frozen liver tissue, cecum (with feces), and isolated BMDMs was performed using the RNeasy Mini Kit (Qiagen, Valencia, CA) following the manufacturer's instructions. Quantitative real‐time polymerase chain reaction was performed as described.19, 25 Forward and reverse sequences for primers are summarized in Supporting Table S1. For all gene expression experiments in BMDMs, TaqMan probes were used (Applied Biosystems, Waltham, MA).
ISOLATION OF HEPATIC MACROPHAGES AND FLOW CYTOMETRY
Hepatic macrophages were isolated as described.20 Briefly, livers were minced in cold Hank's balanced salt solution and digested using collagenase, type I (Worthington, Lakewood, NJ) and deoxyribonuclease I (Worthington) for 30 minutes at 37 °C, then filtered and centrifuged at 50g for 3 minutes at 4 °C. Supernatants were further separated over a 16% Histodenz gradient at 1,400g for 15 minutes at 4 °C. Cells were collected at the interface, and equivalent numbers of cells were washed with phosphate‐buffered saline and then incubated with Fc block (Invitrogen, Waltham, MA) in 5% bovine serum albumin (BSA) for 15 minutes at room temperature. Cells were pelleted, washed with 5% BSA, and then resuspended in 5% BSA with F4/80, CD11b, and CD45 antibodies (Invitrogen) prior to incubation at room temperature for 30 minutes. Stained cells were washed with 5% BSA and then resuspended in fluorescence‐activated cell sorting buffer (phosphate‐buffered saline, 1 mM ethylene diamine tetraacetic acid, 25 mM 4‐(2‐hydroxyethyl)‐1‐piperazine ethanesulfonic acid pH 7.0, 1% BSA). Cells were analyzed by flow cytometry at the University of Colorado Cancer Center Flow Cytometry Core Facility.
BMDM ACTIVATION
BMDMs were differentiated from monocytes with macrophage colony‐stimulating factor for 7 days and then activated for 24 hours with LPS (100 ng/mL) with and without interferon‐gamma (IFNγ) (2 ng/mL), with or without BioPQQ (100 μM). Nitrites were measured as described, using the Griess reagent.26
LIVER HISTOLOGY AND SCORING
Livers were fixed for 24 hours in 4% paraformaldehyde, embedded in paraffin and sectioned, and then stained with hematoxylin and eosin or picrosirius red (Research Pathology Core, University of Colorado, Anschutz) as described.23 Liver sections were blindly scored by a pathologist for NAFLD severity.27 Briefly, each section was initially given an aggregate score based on Brunt criteria for steatosis (0‐3), fibrosis (0‐5), inflammation (0‐6), liver cell injury (0‐4), and reactive change (0‐3). Steatosis scores evaluated the presence of macrosteatosis (1, 0%‐33%; 2, 34%‐66%; 3, 67%‐100%). Fibrosis was scored based on the density of positive pixels in picrosirius red‐stained sections, measured primarily in the interstitial space, and integrated intensities ranged from 1 to 2.6 in arbitrary units, normalized to CH‐fed mice. The inflammation score (0‐6) accounted for the presence of lobular inflammation (0‐3), foci of inflammatory cells (0‐1), and lipogranulomas (0‐2). The liver cell injury score was based on ballooning (0, none; 2, few; 4, many). Reactive change was the aggregate score from the examination of ductal reaction and enlarged hepatocytes (0, none; 1, <50%; 2, 51%‐100%). With this modified score, a calculated value of the NAFLD activity score >10 (from a potential score of 21) was defined as NASH.
METABOLOMICS AND MICROBIOTA ANALYSIS
Metabolomics analyses using ultrahigh‐performance liquid chromatography–mass spectrometry were performed as described in the Supporting Information. Bacterial profiles were determined by broad‐range amplification and high‐throughput sequence analysis of 16S ribosomal RNA genes as described in the Supporting Information.
STATISTICS
Data were expressed as mean ± SEM or SD. Statistical differences between groups were determined by one‐way analysis of variance using Holm‐Sidak or Tukey correction for multiple comparisons, two‐way analysis of variance, or Mann‐Whitney U test using Prism 6.0. Statistical differences were determined as significant for P < 0.05. MetaboAnalyst (www.metaboanalyst.ca) was used for display and analysis of metabolomics data. Explicet (v2.10.5) and R were used for display and analysis of microbiota data. Permutation‐based analysis of variance tests were performed using Bray‐Curtis dissimilarity scores and 100,000 replicate resamplings.
Results
PQQ, SUPPLEMENTED ONLY DURING PREGNANCY AND LACTATION, ATTENUATES WD‐INDUCED ADIPOSITY AND INDICES OF LIVER FUNCTION IN ADULT OFFSPRING OF OBESE PREGNANCY
In this study, we tested the role of maternal WD and early life exposure to di‐sodiated PQQ, given only during pregnancy and lactation, on the prevention of progression toward liver fibrosis and evaluated changes in macrophage biology and microbiota composition. Body composition characteristics for the cohorts are summarized in Table 1. Body weight of WD offspring significantly increased by 56% compared to CH‐fed mice (P < 0.0001), while weight gain increased significantly less in WDPQQ‐treated groups (increased by an average of 22%, P = 0.0024). Most of the gain could be attributed to fat mass, which significantly increased in WD‐fed mice by 140% compared to CH‐fed controls (P < 0.0001). PQQ treatment significantly reduced overall percentage of fat in WD‐fed offspring at 20 weeks of age, even when PQQ was withdrawn at weaning (3 weeks of age) (WDPQQ/WD, P = 0.0002). Although liver hypertrophy induced by WD decreased in PQQ‐exposed animals, kidney atrophy (assessed by average percentage kidney mass) did not, suggesting the action of PQQ might preferentially target the liver in this model. The levels of serum AST, ALT, cholesterol, triglycerides, and metabolic hormones are shown in Table 1. We observed a robust reversal of WD‐induced increases in AST and ALT levels by PQQ (P = 0.015, P = 0.0177, respectively), as well as modest improvements in cholesterol (P = 0.0238). Serum triglycerides did not change appreciably with diet or PQQ, and PQQ did not alter WD‐induced leptin levels.
Table 1.
EFFECT OF WD AND PQQ ON BODY COMPOSITION AND SERUM CHEMISTRY OF DEVELOPMENTALLY PROGRAMMED OFFSPRING
| Maternal Diet: | CH | WD | WDPQQ | WDPQQ | |
|---|---|---|---|---|---|
| Offspring Diet: | CH | WD | WDPQQ | WD | |
| n = 5‐6 | n = 3‐6 | n = 3‐6 | n = 6 | P Valuea | |
| Body weight (g) | 27.7 ± 1.4§ | 43.1 ± 0.8 | 34.3 ± 1.0§ | 33.4 ± 0.5§ | <0.0001 |
| % Liver mass | 4.4 ± 0.1† | 6.6 ± 0.5 | 4.7 ± 0.1† | 4.4 ± 0.4† | 0.0003 |
| % Right kidney mass | 0.71 ± 0.03‡ | 0.44 ± 0.02 | 0.49 ± 0.02 | 0.45 ± 0.01 | <0.0001 |
| % Left kidney mass | 0.69 ± 0.02§ | 0.46 ± 0.03 | 0.52 ± 0.02 | 0.45 ± 0.01 | <0.0001 |
| % Fat mass | 17.2 ± 1.8§ | 41.3 ± 1.0 | 34.6 ± 2.0† | 32.1 ± 1.4§ | <0.0001 |
| AST (U/L) | 28 ± 2.6† | 171 ± 37.8 | 50.4 ± 9.6‡ | NM | 0.0068 |
| ALT (U/L) | 13.5 ± 0.9† | 154.2 ± 45.7 | 42 ± 10.5† | NM | 0.0315 |
| Cholesterol (mg/dL) | 104.4 ± 14.2‡ | 249 ± 37.4 | 163.8 ± 10.1† | NM | 0.0358 |
| Triglycerides (mg/dL) | 94.8 ± 15.3 | 91.2 ± 6.6 | 101.4 ± 7.5 | NM | 0.7903 |
| Leptin (ng/mL) | 1.07 ± 0.43† | 5.52 ± 0.74 | 5.52 ± 0.74 | NM | 0.0007 |
| Insulin (ng/mL) | 0.87 ± 0.11 | 1.34 ± 0.31 | 0.84 ± 0.19 | NM | 0.2189 |
Ordinary one‐way analysis of variance performed using the Holm‐Sidak correction for multiple comparisons. P values demonstrating significant differences between groups are shown in bold. Mann‐Whitney U tests used for pairwise comparisons to WD/WD: † P < 0.05, ‡ P < 0.01, § P < 0.001; n refers to individual mice rather than litters.
Abbreviation: NM, not measured.
WD RESULTS IN HISTOLOGIC FEATURES ASSOCIATED WITH FIBROSIS THAT ARE BLUNTED BY PQQ SUPPLEMENTATION
Mice fed WD beginning after weaning normally are resistant to developing histologic evidence of NASH until approximately 1 year of age.28 We hypothesized that feeding WD beginning at conception would accelerate progression to fibrosis and that supplementation with PQQ during gestation and lactation would counteract this response. We therefore investigated whether di‐sodiated PQQ improved histologic features associated with NASH at 20 weeks of age. As expected, livers from WD mice had marked macrosteatosis in all lobular zones detected by blinded histologic assessment (Fig. 1A; Table 2). In contrast, steatosis was dramatically reduced by PQQ supplementation (Fig. 1A, lower panels); strikingly, steatosis was also reduced in offspring only supplemented with PQQ during gestation and lactation (WDPQQ/WD). We next used CARS to visualize hepatic lipid droplets in WD‐fed offspring (Fig. 1B). PQQ supplementation reduced the mean lipid droplet area by approximately half (Fig. 1C), with persistent improvement in the WDPQQ/WD group.
Figure 1.
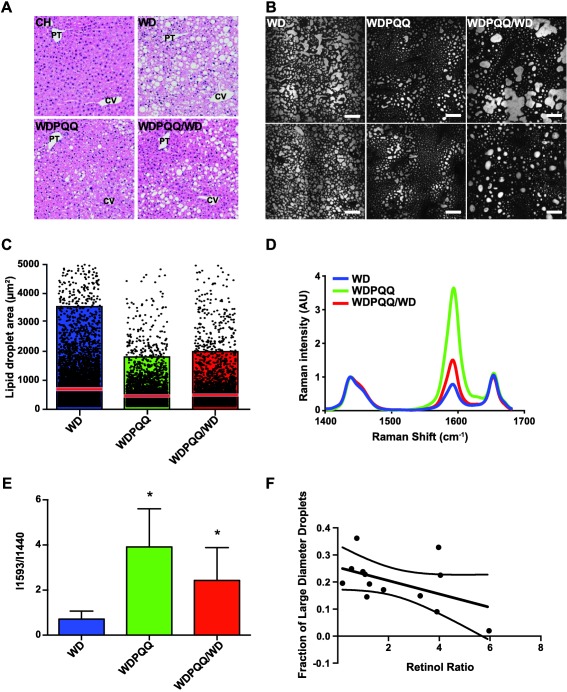
PQQ supplementation reduces steatosis and retinoid loss in livers of WD‐fed mice at 20 weeks of age. (A) H&E staining of liver sections from 20‐week‐old offspring. Locations of central veins and portal triads are indicated (magnification × 200). (B) CARS microscopy was used to visualize lipid droplets in 12‐μm‐thick cryosections from mouse livers at 20 weeks. Representative images from eight mice per group are shown for offspring of dams treated with or without PQQ and for offspring removed from PQQ at weaning. Image magnification × 60, resulting in a field of view of ∼1.4 × 1.4 µm2; scale bars are 50 µm. Background subtraction was performed with Fluoview software. (C) Distribution of droplet areas was calculated as described in Materials and Methods. Images were acquired from three separate liver cryosections from six mice per group. Points represent data, the red line denotes the mean, pink boxes denote the 75% confidence interval and colored boxes denote the 25% confidence interval for each diet group. (D) Spontaneous Raman spectra examined over a spectral range from 1,400 to 1,700 cm−1 were averaged from 12 lipid droplets from livers of WD (blue trace), WDPQQ (green trace), and WDPQQ/WD (red trace)‐fed offspring at 20 weeks of age. (E) Ratio of abundance of 1,593 cm−1/1,440 cm−1 for n = 5 mice/group. The peak at 1,440 cm−1 is a background peak used for normalization. Data are mean ± SEM, * P < 0.05 as compared to WD. (F) Correlation between large droplet size and retinoid signal in hepatic lipid droplets. CH, WD, and WDPQQ in A‐E represent both maternal and offspring diets. Abbreviations: AU, arbitrary unit; CV, central veins; H&E, hematoxylin and eosin; PT, portal triad.
Table 2.
SUMMARIZED BRUNT SCORE OF NOTABLE HISTOLOGIC FEATURESa
| Offspring Diet: | CH | WD | WDPQQ | WDPQQ/WD | P Value |
|---|---|---|---|---|---|
| Steatosis | 0.17 ± 0.18§ | 2.17 ± 0.18 | 1.00 ± 0.28‡ | 1.50 ± 0.24† | <0.0001 |
| Fibrosis | 1.00 ± 0.21§ | 2.58 ± 0.25 | 0.96 ± 0.19§ | 0.82 ± 0.19§ | <0.0001 |
| Inflammation | 0.00 ± 0.00§ | 5.33 ± 0.37 | 1.83 ± 0.91‡ | 2.33 ± 0.83‡ | 0.0001 |
| Liver cell Injury | 0.00 ± 0.00‡ | 1.67 ± 0.37 | 0.00 ± 0.00‡ | 0.33 ± 0.37† | 0.0005 |
| Reactive change | 0.00 ± 0.00‡ | 1.67 ± 0.37 | 0.00 ± 0.00‡ | 0.67 ± 0.46 | 0.0019 |
| Total | 1.17 ± 0.28§ | 13.41 ± 0.71 | 3.80 ± 0.97§ | 5.65 ± 1.07§ | <0.0001 |
One‐way analysis of variance performed with the Tukey correction for multiple comparisons between groups. P values demonstrating significant differences between groups are shown in bold. Data are mean ± SEM, n = 6/group. Fibrosis scores were obtained from quantitation of positive pixels per 100 × field in picrosirius red‐stained sections viewed under cross‐polarized light (Fig. 2A). Scores were averaged per group and normalized to the CH‐fed mice. Total represents the sum of mean scores for all histologic features. Mann‐Whitney U tests used for pairwise comparisons to WD/WD: † P < 0.05, ‡ P < 0.01, § P < 0.001.
Retinol export is one of the earliest indicators of hepatic stellate cell activation, which results in fibrotic scarring.29, 30, 31 We used spontaneous Raman spectroscopy to probe for the presence of retinoids in individual lipid droplets in liver cryosections and found one notable difference: a reduction in peak intensity at 1,593 cm−1 in the WD mice (Fig. 1D,E blue) compared to the WDPQQ mice (green). The peak at 1,593 cm−1 was attributed to the conjugated C=C stretch vibrations of retinol,23 suggesting retinoids are more highly retained in lipid droplets in WDPQQ mice. Some retinoid loss was observed from the WDPQQ/WD droplets (red); however, both short‐ and long‐term PQQ supplementation prevented retinoid loss from WD‐fed offspring. Furthermore, we compared droplet diameters with retinoid signal and found a negative association (Spearman coefficient r = –0.478, P = 0.101) between the presence of large droplets (macrosteatosis) and retinoids (Fig. 1F). No such correlation was found for medium and small diameter droplets.
Because retinol loss is an early sign of impending liver fibrosis, picrosirius red staining and second‐harmonic generation microscopy were used to visualize collagen deposition in fixed liver sections to confirm the presence of fibrosis. Although 20 weeks on a WD is very early for development of fibrosis in mice,28 collagen deposition in the interstitial space was clearly observed in WD liver sections, particularly under polarized light (Fig. 2A, panel b, 2C, panel b). As quantified by analysis of positive pixels (Fig. 2B,D), PQQ supplementation, even when only provided to the dams, significantly reduced collagen deposition and progression toward fibrosis in WD‐fed offspring. Brunt scoring (Table 2) revealed a pattern of elevated histologic features, including fibrosis, inflammation, liver cell injury, and reactive change in livers of WD mice that were either normalized to control levels or reduced by half in PQQ‐treated mice (Supporting Fig. S2). Adding the percentage of large diameter droplets from the CARS analysis (0, 1%‐10%; 2, 11%‐20%; 4, 21%‐30%; 6, 31%‐40%; 8, 41%‐50%) plus the second‐harmonic generation intensity values (normalized to CH‐fed mice) yielded a modified NAFLD activity score ranging from 0 through 31 that increased the relative weighting of macrosteatosis and fibrosis (Fig. 2E). Although some signs of inflammation and liver cell injury were present in the WDPQQ/WD group, it is important to note that these mice only received di‐sodiated PQQ through their mothers to age 3 weeks (i.e., weaning) and were subsequently maintained on WD without PQQ for an additional 17 weeks. Therefore, Bio PQQ supplementation in very early life exerted a notable and persistent protective effect.
Figure 2.
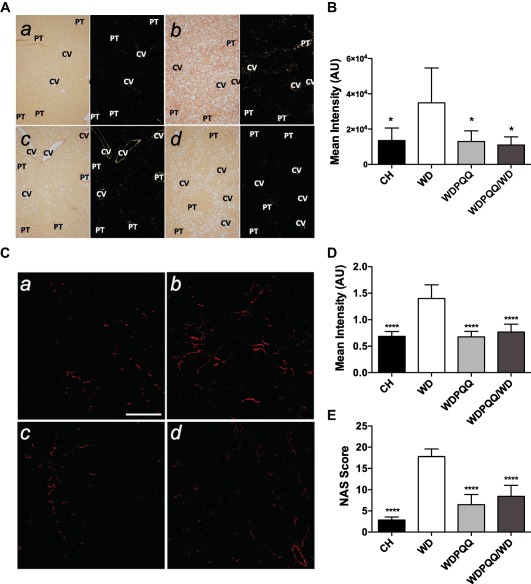
PQQ supplementation diminishes collagen deposition in livers from WD‐fed offspring. (A) Fixed liver sections were stained with picrosirius red and viewed under cross‐polarized light at 100 × to visualize collagen fibrils. a) CH, b) WD, c) WDPQQ, d) WDPQQ/WD. (B) Quantification of positive pixels present in picrosirius red‐stained sections. (C) SHG imaging was performed on fixed liver sections at a magnification of 20×. a) CH, b) WD, c) WDPQQ, d) WDPQQ/WD. (D) Quantification of mean intensity of the SHG signal. (E) Group‐averaged modified NAS, including Brunt criteria, SHG, and CARS indices. Data are mean ± SEM, n = 5‐6/group. Representative images are shown for each group. One‐way analysis of variance with Tukey correction was used to compare between groups. *P < 0.05, ****P < 0.0001 compared to WD. CH, WD, and WDPQQ in A‐E represent both maternal and offspring diets. Abbreviations: AU, arbitrary unit; CV, central veins; NAS, NAFLD activity score; PT, portal triad; SHG, second‐harmonic generation.
EXPRESSION OF PROFIBROTIC GENES IS INCREASED BY WD AND SUPPRESSED BY PQQ SUPPLEMENTATION
To further elucidate potential mechanisms by which di‐sodiated PQQ might act to reduce fibrosis in WD‐fed offspring, we measured hepatic messenger RNA expression levels of extracellular matrix‐modifying genes as well as expression levels of genes involved in profibrotic signaling, inflammation, and oxidative stress. WD significantly increased expression of extracellular matrix‐modifying genes, and both maternal PQQ and long‐term supplementation prevented this dietary effect (Fig. 3A), with expression of collagen type 3 alpha 1 chain (Col3a1) and tissue inhibitor of metalloproteinase 1 (Timp1) significantly differing between WDPQQ/WD and WDPQQ groups. The expression of profibrinogenic markers actin, alpha 2 (Acta2) and transforming growth factor beta 1 (Tgfb1) were significantly increased by WD and reduced by PQQ in both treatment groups; however, Tgfb2 was unchanged and expression levels for TGFβ receptor 1 subunit (Tgfbr1) were only slightly modulated by diet and PQQ (Fig. 3B). Acta2 and Tgfb3 expression levels were significantly different between WDPQQ and WDPQQ/WD mice. Expression of Tgfb3, heme oxygenase 1 (Hmox1), interleukin 6 (Il6), and nitric oxide synthase 2 (Nos2), genes found in proinflammatory macrophages, was significantly increased by WD and decreased by PQQ (Fig. 3B,C). We therefore determined expression of markers associated with recruitment of inflammatory macrophages in the liver (chemokine (C‐C motif) receptor 2 [Ccr2], integrin subunit alpha M [ITGAM/Cd11b], lymphocyte antigen 6 [Ly6c]) and found they were all dramatically increased in livers of WD‐fed offspring and decreased in both PQQ‐treated groups (Fig. 3D), with Ccr2 expression significantly higher in WDPQQ/WD offspring compared to WDPQQ. Taken together, these data suggest that early PQQ supplementation can attenuate WD‐induced progression toward NASH, at least in part, by limiting macrophage activation and recruitment.
Figure 3.
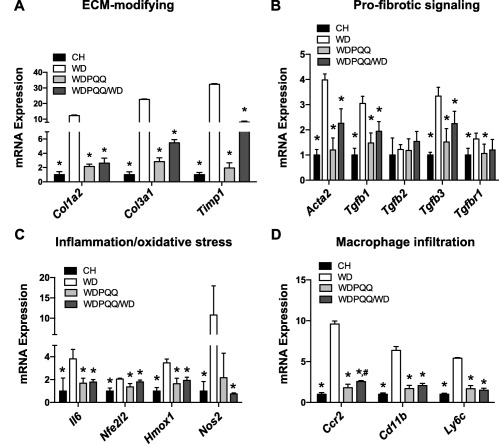
PQQ reverses WD‐induced up‐regulation of profibrotic genes in mouse liver. mRNA expression of genes important for (A) modification of the extracellular matrix, (B) profibrotic signaling, (C) induction of proinflammatory and oxidative stress‐related signaling pathways, and (D) infiltration of activated proinflammatory macrophages was measured in livers of adult male offspring. Endogenous normalization was to 18S rRNA (A‐C) or Hprt1 (D). Data are mean ± SEM; n = 5‐6/group. Mann‐Whitney U test was used to compare groups pairwise. *P < 0.05 compared with WD, # P < 0.05 compared with WDPQQ. CH, WD, and WDPQQ represent both maternal and offspring diets. Abbreviations: ECM, extracellular matrix; mRNA, messenger RNA; rRNA, ribosomal RNA.
WD AND PQQ EXPOSURE IN VIVO BLUNTS MACROPHAGE RECRUITMENT AND SHIFTS PROINFLAMMATORY AND PROREMODELING GENE EXPRESSION IN LIVER AND BMDMs
To determine whether the proinflammatory liver phenotype induced by WD exposure is activated early in the disease process and to further explore whether rescue of the phenotype by PQQ was due to attenuated recruitment of inflammatory macrophages, we used flow cytometry to sort resident and recruited hepatic macrophage populations obtained from 12‐week‐old mice from our diet groups (Fig. 4A), assessed inflammatory polarization in liver (Fig. 4B), and isolated BMDM from these mice (Fig. 4C). Macrophage recruitment to the liver was significantly expanded in mice fed WD, and infiltration was attenuated in mice supplemented with PQQ, although differences were not statistically significant (Fig. 4A). We observed an increase in the proinflammatory to anti‐inflammatory Il1b to Il10 expression ratio in liver from WD‐fed mice that was diminished to control levels by PQQ consumption (Fig. 4B), reflecting a similar pattern observed in the recruited macrophage population (Fig. 4A). A similar attenuation in recruitment of inflammatory macrophages was also found following injection intraperitoneally with LPS in CH‐fed mice supplemented with PQQ for 2 weeks (Supporting Fig. S3A). Acute (5‐hour) exposure of CH‐fed mice to PQQ also significantly reduced LPS‐induced expression of proinflammatory activation markers (Il1b, Il6, Nos2, and tumor necrosis factor [Tnf]) and profibrotic marker arginase 1 (Arg1) in liver (Supporting Fig. S3B), with concomitant suppressed production of nitric oxide (Supporting Fig. S3B, inset). Taken together, these data suggest that both chronic and short‐term PQQ supplementation relieves hepatic inflammation by attenuating recruitment of inflammatory macrophages.
Figure 4.
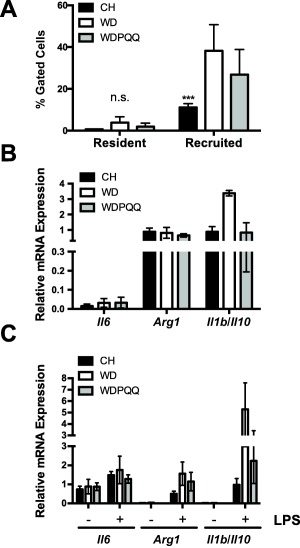
PQQ attenuates recruitment of inflammatory macrophages and LPS‐induced activation of BMDMs. (A) Percent abundance of FACS‐sorted hepatic macrophage populations obtained from CH, WD, and WDPQQ‐fed offspring at 12 weeks. (B) mRNA expression levels of proinflammatory and profibrotic genes in liver. Endogenous normalization was to 18S rRNA and Gapdh. (C) mRNA expression levels of proinflammatory and profibrotic genes in BMDMs stimulated with or without LPS for 24 hours. Endogenous normalization was to 18S rRNA and Gapdh. Data are mean ± SEM, n = 4/group. Mann‐Whitney U test was used to compare groups pairwise. ***P < 0.001 compared with WD. Abbreviations: FACS, fluorescence‐activated cell sorting; mRNA, messenger RNA; n.s., not significant; rRNA, ribosomal RNA.
To determine whether proinflammatory activation by WD extends to BMDMs, we tested the innate immune response in BMDMs obtained from 8‐12‐week‐old mice from our diet groups. Upon stimulation with LPS, expression of proinflammatory Il6, Arg1, and Il1b was strongly induced by WD and Il10 was down‐regulated (Fig. 4C), suggesting WD consumption leads to inflammatory polarization of the BMDMs that was attenuated in cells from mice fed WD + PQQ. Furthermore, BMDMs from CH‐fed mice costimulated with LPS/IFNγ and PQQ also exhibited a diminished inflammatory response (Supporting Fig. S3C), suggesting that PQQ at physiologic doses can directly attenuate proinflammatory macrophage activation.
WD SUPPRESSES AND PQQ INCREASES BMDM METABOLIC PROGRAMMING TOWARD OXIDATIVE METABOLISM
To investigate whether the suppressed expression of proinflammatory genes in PQQ‐treated macrophages was associated with metabolic reprogramming, we used FLIM to measure levels of endogenous NADH as a cellular metabolic marker of aerobic glycolysis.32 FLIM maps of phasor plots and quantitation of percentage free versus bound NADH are shown in Fig. 5A. The green signal in the FLIM map corresponds to more glycolysis (increased free NADH), and red corresponds to more OXPHOS (bound NADH). In unstimulated conditions, BMDMs from all three diet groups had low levels of free NADH, suggesting OXPHOS as the primary metabolic program in quiescent macrophages. In contrast, upon stimulation with LPS and IFNγ, BMDMs exhibited a striking increase in the fraction of free NADH and a corresponding reduction of bound NADH, suggesting increased glycolysis. Proinflammatory activation was augmented (increased green signal) when BMDMs were derived from WD‐fed mice (Fig. 5A, middle panel) relative to those derived from CH‐fed mice (Fig. 5A, top panel), suggesting that WD had effects on the bone marrow progenitors which subsequently increased macrophage aerobic glycolysis. Surprisingly, activation of BMDMs derived from WDPQQ‐fed mice (Fig. 5A, bottom panel) increased the fraction of free NADH compared to those derived from WD‐fed animals, suggesting in vivo exposure to PQQ programs additional metabolic pathways using NADH/NAD+ that may be activated by LPS/IFNγ. In addition, free NADH localized proximal to the nucleolus, as observed in highly synthetic cells,33 and is consistent with a state of macrophage activation. Importantly, regardless of diet, PQQ cotreatment reduced free cellular NADH levels, although in the case of WD‐fed mice, levels did not return to control values.
Figure 5.
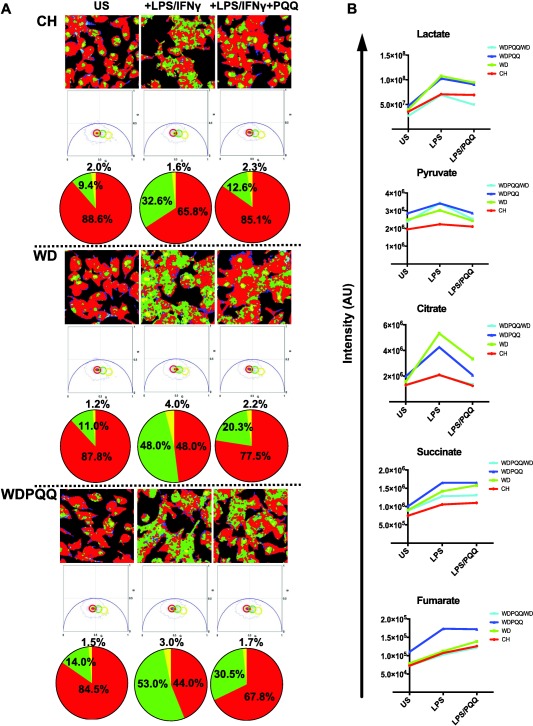
PQQ shifts cellular metabolism toward OXPHOS in activated BMDMs. (A) FLIM maps are shown in the top panel, phasor plots and quantitation of percentage free versus bound NADH are displayed below for BMDMs differentiated from 8‐12‐week‐old offspring fed CH, WD, or WDPQQ. Green signal in the FLIM map corresponds to pixels occupied by free NADH (more glycolysis), and red corresponds to pixels with more bound NADH (more OXPHOS). In unstimulated conditions, cells had low levels of free NADH, suggesting oxidative phosphorylation as the primary metabolic program. In contrast, on stimulation with LPS and IFNγ (+LPS/IFNγ), macrophages exhibited significantly increased free NADH, suggesting increased glycolysis. PQQ treatment shifted the NADH signal back to more bound NADH (more OXPHOS) for all groups. (B) Signal intensities of metabolites identified by ultrahigh‐performance liquid chromatography–tandem mass spectrometry. Representative data are shown. Abbreviations: AU, arbitrary units; US, unstimulated.
While FLIM provides an assessment of the overall change in metabolic activity in live cells at the glycolysis and TCA cycle level, ultrahigh‐performance liquid chromatography–mass spectrometry‐based metabolomics affords direct measurements of steady state levels of metabolic intermediates of these pathways (Fig. 5B; Supporting Table S2). Stimulation of BMDMs with LPS/IFNγ increased lactate and pyruvate as well as the lactate/pyruvate ratio. Levels of citrate and succinate increased with stimulation, and PQQ coculture profoundly reduced citrate concentrations compared to stimulated levels in all diet groups. Mice exposed to PQQ in vivo had elevated levels of pyruvate, succinate, and fumarate in unstimulated cells, suggesting increased oxidative activity at baseline. These data expand on evidence from the FLIM analyses by showing that BMDM metabolic reprogramming in response to proinflammatory stimuli is exacerbated in adult offspring of WD‐fed mice. At the same time, our data suggest a protective role for PQQ on BMDM activation by LPS/IFNγ in WD‐fed mice, particularly when mice are exposed to PQQ during gestation and lactation.
WD OR PQQ EXPOSURE IN EARLY LIFE HAS PERSISTENT EFFECTS ON MICROBIAL COMPOSITION
In newborn infants, gastrointestinal microbes are noted for their ability to serve as direct inducers/regulators of the infant immune system (reviewed in Houghteling and Walker34). Using 16S ribosomal RNA gene sequencing of cecal contents, we determined bacterial profiles in weanling mice at postnatal day 21 from CH‐, WD‐, and WDPQQ‐fed dams and in 20‐week‐old adult offspring from the same diet groups plus WDPQQ/WD animals. Relative abundances of the six most abundant phyla (Fig. 6A) and genera (Fig. 6B) were plotted for weanlings and adults. Firmicutes were more abundant in WD‐fed mice compared to CH‐fed mice, regardless of age. Lachnospiraceae and S24‐7 were the most abundant families, and Lachnospiraceae decreased with PQQ supplementation in both age groups. In cecal tissue, the expression of tight junction protein 1 (Tjp1; also known as ZO‐1), a marker of intestinal barrier function, was decreased by 60% in WD‐fed mice compared to CH‐fed counterparts and decreased by 40% in PQQ‐supplemented mice (Fig. 6C), suggesting continuous exposure to PQQ improved WD‐induced barrier dysfunction.
Figure 6.
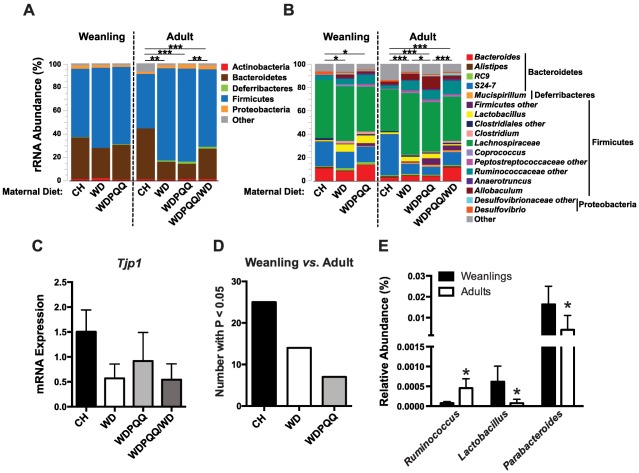
PQQ‐induced microbial changes may persist into adulthood. 16S rRNA sequencing was performed on cecal contents from n = 5‐7 mice/group. Relative abundance of the top 99.5% most abundant (A) phyla and (B) genera for adults and weanlings were plotted as a percent of OTU abundance. Permutational analysis of variance P values for pairwise comparisons are noted (*P < 0.05, **P < 0.01, ***P < 0.001). (C) mRNA levels of zona occludens 1 (Tjp1) in RNA isolated from cecum, normalized to 18S. (D) Count of OTUs with P < 0.05 when compared between weanlings and adults plotted for each diet group. (E) Mean percentage abundance of OTUs with significant changes between adults and weanlings only in WD‐fed mice. Data are mean ± SEM. Abbreviations: mRNA, messenger RNA; OTU, operational taxonomic unit; rRNA, ribosomal RNA.
Significant differences in overall genus‐level microbial composition were observed between dietary groups (Supporting Table S3) for both weanlings (P = 0.0086) and adults (P = 1.0E‐05). Diet was significantly associated with microbial composition in both weanlings (P = 0.0067) and adults (P = 0.00019). After adjusting for diet, PQQ exposure was also significantly associated with the overall microbiota composition in both weanlings (P = 0.026) and adults (P = 0.0069). To further examine the relationships between treatment and age groups, Manhattan plots were generated for pairwise comparisons of diet/treatment/age groups (Supporting Fig. S4A; Supporting Table S4), and the number of taxa with P < 0.05 in each comparison was plotted by diet group (Fig. 6D). PQQ‐treated mice retained more of an early life microbial profile than did CH‐fed or WD‐fed mice, suggesting that early exposure to PQQ may have persistent effects on the gut microbial communities of adults, despite continued consumption of WD. We identified unique genera in WD‐fed mice that differed in abundance between each age group within diets (Fig. 6E). Relative abundance of Parabacteroides and Lactobacillus was significantly decreased in WD‐fed adult mice compared to weanlings, while Ruminococcus was significantly increased. An unsupervised Random Forest analysis was performed, and Prevotellaceae was identified as the most important microbial feature contributing to overall differences between age and diet groups (Supporting Fig. S4B). PQQ supplementation, regardless of age, resulted in decreased abundance of Prevotellaceae (Supporting Fig. S4C). Taken together, these data suggest that influences of WD on the infant microbiota are augmented in adulthood and that Bio PQQ supplementation in early life, even after its withdrawal, leads to a protective microbial profile that persists into adulthood.
Discussion
Multiple lines of evidence suggest maternal obesity‐induced developmental programming of NAFLD in the offspring involves the innate immune system as well as metabolic perturbations by gut bacteria.35, 36 Maternal microbiota drive early postnatal innate immune development,37 while in adults, gut bacterial disorders induced by obesity are likely mediated by cells of the innate immune system, a phenomenon observed in Rag1−/– mice lacking all cells of the adaptive immune system.13 Here, we show that maternal WD induces metabolic reprogramming in macrophages shortly after weaning, shifting their polarization toward glycolytic metabolism. We also observed that BMDMs from WD‐fed mice had an augmented response to ex vivo activation compared to CH‐fed mice and a switch toward glycolytic metabolism that was abrogated by PQQ supplementation, even when PQQ was withdrawn at weaning. Our findings show that PQQ‐exposed offspring are protected from fibrosis and are consistent with and expand upon a previous report using a thioacetamide mouse model of fibrosis in which oral PQQ protected mice from fibrosis; protection was associated with decreased infiltration of hepatic macrophages.38 We observed a phenotype in adult mice characterized by increased recruitment of hepatic macrophages, loss of retinoids, increased fibrogenesis, exacerbated inflammation, and liver damage accompanied by high ALT, occurring in as little as 20 weeks. Importantly, our data suggest that macrophage activation by maternal WD involves programming of gut dysbiosis as early as 3 weeks of age that can persist into adulthood, reflected by an increase in abundance of proinflammatory genera, such as Ruminococcus, and decreased expression of a gene regulating tight junction formation. Consequently, our results are consistent with early programming effects of diet and PQQ on the gut microbiota and BMDM polarization and suggest that reshaping of the early gut microbiota and reprogramming of macrophages during the early weaning period are critical for pronounced development of NAFLD to NASH.
Despite continuous feeding with WD postnatally, early exposure to di‐sodiated PQQ attenuated the development of liver injury and fibrosis through mechanisms that appear to involve restoration of oxidative metabolism in macrophages and retention of an early life microbial composition. In addition to its antioxidant action, PQQ is a noted potentiator of oxidoreductase activity, both in bacteria and mammals, and promotes oxidative metabolism through modulation of lactate dehydrogenase activity.39 The increased abundance of citrate in BMDMs following stimulation combined with the augmented response in WD‐fed mice with rescue by in vitro addition of PQQ suggests that reprogramming of the TCA cycle at isocitrate dehydrogenase may be attenuated by PQQ. Furthermore, metabolic reprogramming and increased citrate concentration have been associated with induction of immunologic memory in macrophages, mediated by hypoxia inducible factor 1 alpha,40 which is critical for controlling macrophage polarization and an inflammatory phenotype. It is tempting to speculate that PQQ restores the TCA/oxidative cycle function in the bone marrow microenvironment and results in a shift in BMDM metabolism with persistent hepatoprotective effects by potentiating oxidoreductase action.
A key process occurring during birth and the early postnatal period is the transmission of commensal bacteria from mother to neonate. Although pioneering microbiota shape the nascent infant immune system, little is known about how early dysbiosis in the gut might affect subsequent development of the gut–liver axis. Our results suggest that as WD‐fed offspring aged, abundance of Lactobacillus and Parabacteroides decreased and Ruminococcus increased. Shifts in these genera were not apparent in PQQ‐supplemented mice. Indeed, PQQ administration led to remarkable stability of the microbiota, with a significant reduction of Prevotellaceae abundance, regardless of age. Increased abundance of Ruminococcus was recently reported in a study of 57 patients with biopsy‐proven NAFLD to be independently associated with NASH,15 although reduction of this genus and Prevotella were reported in children with NASH.41 Abundance of Parabacteroides was increased in human NASH and could discriminate between NAFLD and controls in pediatric patients.42 Species within Lactobacillus have been tested as probiotics and have protected against dyslipidemia in mice fed a high‐fat diet.43 Although additional studies are required, our data suggest that alterations in the microbiota of neonates born to mothers with obesity might produce an early proinflammatory response, resulting in altered liver or gut gene expression and, potentially, persistent immunologic changes in the infant that can be blunted by PQQ. Longitudinal analyses of the microbiota at the strain level using larger group sizes are required to further decipher these effects on metabolic reprogramming of the immune system and susceptibility to liver disease in later life. Our results suggest that BMDMs, derived from a stem cell progenitor, are susceptible to metabolic reprogramming by a maternal WD in early life. Further research into mechanisms responsible for programming bone marrow cells is warranted.
In conclusion, we provide experimental evidence that PQQ attenuates early microbial dysbiosis as well as macrophage metabolic reprogramming and proinflammatory polarization in offspring of obese mothers, preventing acceleration of NAFLD. The major source of this nontoxic nonsynthetic antioxidant is dietary,44 and PQQ is enriched in breast milk.45 Although levels in lean versus obese mothers have not been studied in humans or animals, PQQ is a potentially safe therapeutic to test for prevention of developmental programming of NAFLD/NASH. Importantly, because disruption of immune development during the early neonatal period more profoundly and persistently alters postnatal immune responses than does disruption during adult life,46 our results highlight the importance of the neonatal period as a critical developmental window to protect obese offspring from the harmful effects of diet‐induced lipotoxicity and potentially halt the devastating trend of increasing pediatric NAFLD associated with childhood obesity.
Author names in bold designate shared co‐first authorship.
Supporting information
Additional Supporting Information may be found at onlinelibrary.wiley.com/doi/10.1002/hep4.1139/full.
Supporting Information 1
Supporting Information Figure S1
Supporting Information Figure S2
Supporting Information Figure S3
Supporting Information Figure S4
Supporting Information Table S1
Supporting Information Table S2
Supporting Information Table S2
Supporting Information Table S2
Acknowledgment
K.R.J. appreciates helpful discussions with Dr. Robert Rucker (University of California, Davis) and the generous gift of BioPQQ from the Mitsubishi Gas and Chemical Company.
Potential conflict of interest: Nothing to report.
Supported by the National Institute of Diabetes and Digestive and Kidney Diseases (P30DK048520 and R24DK090964 to J.E.F.; R01DK098336 to X.X.W. and M.L. and K25DK098615 to K.R.J.), the National Center for Advancing Translational Sciences (UL1TR001082 to the Advanced Light Microscopy Core Facility, University of Colorado Anschutz Medical Campus), the NIH Office of the Director (1S10OD016257 to M.L. for the Zeiss LSM780 laser and P41RR01192 to A.A.G. and E.O.P. for the Laser Microbeam and Medical Program), the VA (1I01BX001954 to X.X.W. and M.L.) and the Center for Women's Health Research at the University of Colorado Anschutz Medical Campus (to K.R.J.).
REFERENCES
- 1. Anderson EL, Howe LD, Jones HE, Higgins JP, Lawlor DA, Fraser A. The prevalence of non‐alcoholic fatty liver disease in children and adolescents: a systematic review and meta‐analysis. PLoS One 2015;10:e0140908. [DOI] [PMC free article] [PubMed] [Google Scholar]
- 2. Goyal NP, Schwimmer JB. The progression and natural history of pediatric nonalcoholic fatty liver disease. Clin Liver Dis 2016;20:325‐338. [DOI] [PMC free article] [PubMed] [Google Scholar]
- 3. Newton KP, Feldman HS, Chambers CD, Wilson L, Behling C, Clark JM, et al.; Nonalcoholic Steatohepatitis Clinical Research Network (NASH CRN) . Low and high birth weights are risk factors for nonalcoholic fatty liver disease in children. J Pediatr 2017;187:141‐146. [DOI] [PMC free article] [PubMed] [Google Scholar]
- 4. Agopian VG, Kaldas FM, Hong JC, Whittaker M, Holt C, Rana A, et al. Liver transplantation for nonalcoholic steatohepatitis: the new epidemic. Ann Surg 2012;256:624‐633. [DOI] [PubMed] [Google Scholar]
- 5. Bruce KD, Cagampang FR, Argenton M, Zhang J, Ethirajan PL, Burdge GC, et al. Maternal high‐fat feeding primes steatohepatitis in adult mice offspring, involving mitochondrial dysfunction and altered lipogenesis gene expression. Hepatology 2009;50:1796‐1808. [DOI] [PubMed] [Google Scholar]
- 6. McCurdy CE, Bishop JM, Williams SM, Grayson BE, Smith MS, Friedman JE, et al. Maternal high‐fat diet triggers lipotoxicity in the fetal livers of nonhuman primates. J Cin Invest 2009;119:323‐335. [DOI] [PMC free article] [PubMed] [Google Scholar]
- 7. Thorn SR, Baquero KC, Newsom SA, El Kasmi KC, Bergman BC, Shulman GI, et al. Early life exposure to maternal insulin resistance has persistent effects on hepatic NAFLD in juvenile nonhuman primates. Diabetes 2014;63:2702‐2713. [DOI] [PMC free article] [PubMed] [Google Scholar]
- 8. Giusti L, Gabriele M, Penno G, Garofolo M, Longo V, Del Prato S, et al. A fermented whole grain prevents lipopolysaccharides‐induced dysfunction in human endothelial progenitor cells. Oxid Med Cell Longev 2017;2017:1026268. [DOI] [PMC free article] [PubMed] [Google Scholar]
- 9. Rivera CA, Adegboyega P, van Rooijen N, Tagalicud A, Allman M, Wallace M. Toll‐like receptor‐4 signaling and Kupffer cells play pivotal roles in the pathogenesis of non‐alcoholic steatohepatitis. J Hepatol 2007;47:571‐579. [DOI] [PMC free article] [PubMed] [Google Scholar]
- 10. Mills EL, Kelly B, Logan A, Costa AS, Varma M, Bryant CE, et al. Succinate dehydrogenase supports metabolic repurposing of mitochondria to drive inflammatory macrophages. Cell 2016;167:457‐470.e413. [DOI] [PMC free article] [PubMed] [Google Scholar]
- 11. El Kasmi KC, Stenmark KR. Contribution of metabolic reprogramming to macrophage plasticity and function. Semin Immunol 2015;27:267‐275. [DOI] [PMC free article] [PubMed] [Google Scholar]
- 12. Wieland A, Frank DN, Harnke B, Bambha K. Systematic review: microbial dysbiosis and nonalcoholic fatty liver disease. Aliment Pharmacol Ther 2015;42:1051‐1063. [DOI] [PubMed] [Google Scholar]
- 13. Bäckhed F, Ding H, Wang T, Hooper LV, Koh GY, Nagy A, et al. The gut microbiota as an environmental factor that regulates fat storage. Proc Natl Acad Sci U S A 2004;101:15718‐15723. [DOI] [PMC free article] [PubMed] [Google Scholar]
- 14. Harley IT, Stankiewicz TE, Giles DA, Softic S, Flick LM, Cappelletti M, et al. IL‐17 signaling accelerates the progression of nonalcoholic fatty liver disease in mice. Hepatology 2014;59:1830‐1839. [DOI] [PMC free article] [PubMed] [Google Scholar]
- 15. Boursier J, Mueller O, Barret M, Machado M, Fizanne L, Araujo‐Perez F, et al. The severity of nonalcoholic fatty liver disease is associated with gut dysbiosis and shift in the metabolic function of the gut microbiota. Hepatology 2016;63:764‐775. [DOI] [PMC free article] [PubMed] [Google Scholar]
- 16. Rooks MG, Garrett WS. Gut microbiota, metabolites and host immunity. Nat Rev Immunol 2016;16:341‐352. [DOI] [PMC free article] [PubMed] [Google Scholar]
- 17. Lytle KA, Jump DB. Is Western diet‐induced nonalcoholic steatohepatitis in Ldlr‐/‐ mice reversible? PloS One 2016;11:e0146942. [DOI] [PMC free article] [PubMed] [Google Scholar]
- 18. Verbeek J, Jacobs A, Spincemaille P, Cassiman D. Development of a representative mouse model with nonalcoholic steatohepatitis. Curr Protoc Mouse Biol 2016;6:201‐210. [DOI] [PubMed] [Google Scholar]
- 19. Jonscher KR, Stewart MS, Alfonso‐Garcia A, DeFelice BC, Wang XX, Luo Y, et al. Early PQQ supplementation has persistent long‐term protective effects on developmental programming of hepatic lipotoxicity and inflammation in obese mice. FASEB J 2017;31:1434‐1448. [DOI] [PMC free article] [PubMed] [Google Scholar]
- 20. El Kasmi KC, Anderson AL, Devereaux MW, Fillon SA, Harris JK, Lovell MA, et al. Toll‐like receptor 4‐dependent Kupffer cell activation and liver injury in a novel mouse model of parenteral nutrition and intestinal injury. Hepatology 2012;55:1518‐1528. [DOI] [PMC free article] [PubMed] [Google Scholar]
- 21. El Kasmi KC, Anderson AL, Devereaux MW, Vue PM, Zhang W, Setchell KD, et al. Phytosterols promote liver injury and Kupffer cell activation in parenteral nutrition‐associated liver disease. Sci Transl Med 2013;5:206ra137. [DOI] [PMC free article] [PubMed] [Google Scholar]
- 22. Samuelsson AM, Matthews PA, Argenton M, Christie MR, McConnell JM, Jansen EH, et al. Diet‐induced obesity in female mice leads to offspring hyperphagia, adiposity, hypertension, and insulin resistance: a novel murine model of developmental programming. Hypertension 2008;51:383‐392. [DOI] [PubMed] [Google Scholar]
- 23. Jonscher KR, Alfonso‐Garcia A, Suhalim JL, Orlicky DJ, Potma EO, Ferguson VL, et al. Spaceflight activates lipotoxic pathways in mouse liver. PLoS One 2016;11:e0152877. [DOI] [PMC free article] [PubMed] [Google Scholar]
- 24. Digman MA, Caiolfa VR, Zamai M, Gratton E. The phasor approach to fluorescence lifetime imaging analysis. Biophys J 2008;94:L14‐L16. [DOI] [PMC free article] [PubMed] [Google Scholar]
- 25. Li M, Riddle S, Zhang H, D'Alessandro A, Flockton A, Serkova NJ, et al. Metabolic reprogramming regulates the proliferative and inflammatory phenotype of adventitial fibroblasts in pulmonary hypertension through the transcriptional corepressor C‐terminal binding protein‐1. Circulation 2016;134:1105‐1121. [DOI] [PMC free article] [PubMed] [Google Scholar]
- 26. El Kasmi KC, Qualls JE, Pesce JT, Smith AM, Thompson RW, Henao‐Tamayo M, et al. Toll‐like receptor‐induced arginase 1 in macrophages thwarts effective immunity against intracellular pathogens. Nat Immunol 2008;9:1399‐1406. [DOI] [PMC free article] [PubMed] [Google Scholar]
- 27. Santiago‐Rolon A, Purcell D, Rosado K, Toro DH. A comparison of Brunt's criteria, the non‐alcoholic fatty liver disease activity score (NAS), and a proposed NAS scoring that includes fibrosis in non‐alcoholic fatty liver disease staging. P R Health Sci J 2015;34:189‐194. [PMC free article] [PubMed] [Google Scholar]
- 28. Mouralidarane A, Soeda J, Visconti‐Pugmire C, Samuelsson AM, Pombo J, Maragkoudaki X, et al. Maternal obesity programs offspring nonalcoholic fatty liver disease by innate immune dysfunction in mice. Hepatology 2013;58:128‐138. [DOI] [PubMed] [Google Scholar]
- 29. Milliano MT, Luxon BA. Rat hepatic stellate cells become retinoid unresponsive during activation. Hepatol Res 2005;33:225‐233. [DOI] [PubMed] [Google Scholar]
- 30. Friedman SL. Hepatic stellate cells: protean, multifunctional, and enigmatic cells of the liver. Physiol Rev 2008;88:125‐172. [DOI] [PMC free article] [PubMed] [Google Scholar]
- 31. Friedman SL. Evolving challenges in hepatic fibrosis. Nat Rev Gastroenterol Hepatol 2010;7:425‐436. [DOI] [PubMed] [Google Scholar]
- 32. Alfonso‐Garcia A, Smith TD, Datta R, Luu TU, Gratton E, Potma EO, et al. Label‐free identification of macrophage phenotype by fluorescence lifetime imaging microscopy. J Biomed Opt 2016;21:46005. [DOI] [PMC free article] [PubMed] [Google Scholar]
- 33. Wright BK, Andrews LM, Jones MR, Stringari C, Digman MA, Gratton E. Phasor‐FLIM analysis of NADH distribution and localization in the nucleus of live progenitor myoblast cells. Microsc Res Tech 2012;75:1717‐1722. [DOI] [PMC free article] [PubMed] [Google Scholar]
- 34. Houghteling PD, Walker WA. Why is initial bacterial colonization of the intestine important to infants' and children's health? J Pediatr Gastroenterol Nutr 2015;60:294‐307. [DOI] [PMC free article] [PubMed] [Google Scholar]
- 35. Boursier J, Diehl AM. Nonalcoholic fatty liver disease and the gut microbiome. Clin Liver Dis 2016;20:263‐275. [DOI] [PubMed] [Google Scholar]
- 36. Wesolowski SR, Kasmi KC, Jonscher KR, Friedman JE. Developmental origins of NAFLD: a womb with a clue. Nat Rev Gastroenterol Hepatol 2017;14:81‐96. [DOI] [PMC free article] [PubMed] [Google Scholar]
- 37. Gomez de Agüero M, Ganal‐Vonarburg SC, Fuhrer T, Rupp S, Uchimura Y, Li H, et al. The maternal microbiota drives early postnatal innate immune development. Science 2016;351:1296‐1302. [DOI] [PubMed] [Google Scholar]
- 38. Jia D, Duan F, Peng P, Sun L, Ruan Y, Gu J. Pyrroloquinoline‐quinone suppresses liver fibrogenesis in mice. PLoS One 2015;10:e0121939. [DOI] [PMC free article] [PubMed] [Google Scholar]
- 39. Akagawa M, Minematsu K, Shibata T, Kondo T, Ishii T, Uchida K. Identification of lactate dehydrogenase as a mammalian pyrroloquinoline quinone (PQQ)‐binding protein. Sci Rep 2016;6:26723. [DOI] [PMC free article] [PubMed] [Google Scholar]
- 40. Cheng SC, Quintin J, Cramer RA, Shepardson KM, Saeed S, Kumar V, et al. mTOR‐ and HIF‐1alpha‐mediated aerobic glycolysis as metabolic basis for trained immunity. Science 2014;345:1250684. [DOI] [PMC free article] [PubMed] [Google Scholar]
- 41. Zhu L, Baker SS, Gill C, Liu W, Alkhouri R, Baker RD, et al. Characterization of gut microbiomes in nonalcoholic steatohepatitis (NASH) patients: a connection between endogenous alcohol and NASH. Hepatology 2013;57:601‐609. [DOI] [PubMed] [Google Scholar]
- 42. Del Chierico F, Nobili V, Vernocchi P, Russo A, Stefanis C, Gnani D, et al. Gut microbiota profiling of pediatric nonalcoholic fatty liver disease and obese patients unveiled by an integrated meta‐omics‐based approach. Hepatology 2017;65:451‐464. [DOI] [PubMed] [Google Scholar]
- 43. Kim B, Park KY, Ji Y, Park S, Holzapfel W, Hyun CK. Protective effects of Lactobacillus rhamnosus GG against dyslipidemia in high‐fat diet‐induced obese mice. Biochem Biophys Res Commun 2016;473:530‐536. [DOI] [PubMed] [Google Scholar]
- 44. Rucker R, Chowanadisai W, Nakano M. Potential physiological importance of pyrroloquinoline quinone. Altern Med Rev 2009;14:268‐277. [PubMed] [Google Scholar]
- 45. Steinberg F, Stites TE, Anderson P, Storms D, Chan I, Eghbali S, et al. Pyrroloquinoline quinone improves growth and reproductive performance in mice fed chemically defined diets. Exp Biol Med (Maywood) 2003;228:160‐166. [DOI] [PubMed] [Google Scholar]
- 46. Torow N, Hornef MW. The neonatal window of opportunity: setting the stage for life‐long host‐microbial interaction and immune homeostasis. J Immunol 2017;198:557‐563. [DOI] [PubMed] [Google Scholar]
Associated Data
This section collects any data citations, data availability statements, or supplementary materials included in this article.
Supplementary Materials
Additional Supporting Information may be found at onlinelibrary.wiley.com/doi/10.1002/hep4.1139/full.
Supporting Information 1
Supporting Information Figure S1
Supporting Information Figure S2
Supporting Information Figure S3
Supporting Information Figure S4
Supporting Information Table S1
Supporting Information Table S2
Supporting Information Table S2
Supporting Information Table S2