An official website of the United States government
Here's how you know
Official websites use .gov
A
.gov website belongs to an official
government organization in the United States.
Secure .gov websites use HTTPS
A lock (
) or https:// means you've safely
connected to the .gov website. Share sensitive
information only on official, secure websites.
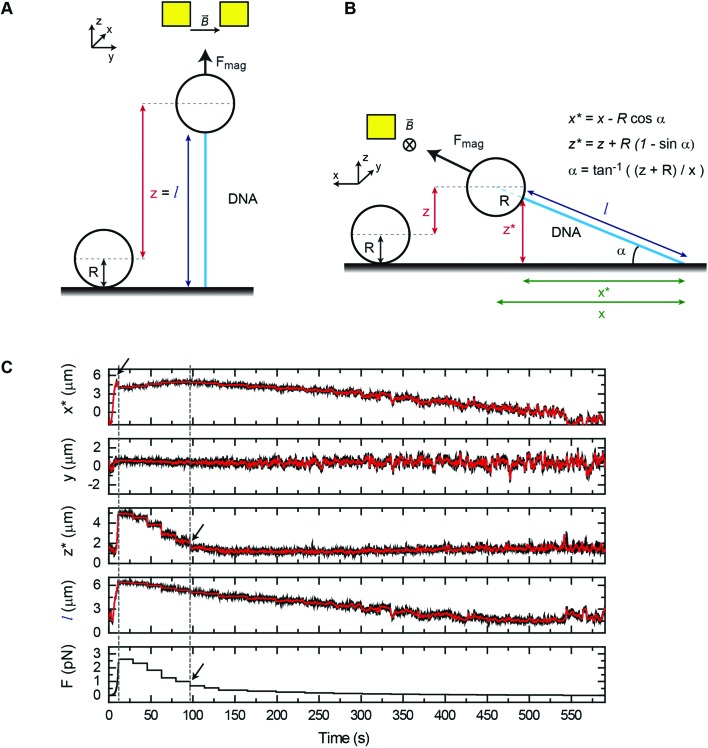
 . This assumes that the DNA is attached analogously to vertical pulling. (C) Position coordinates (x, y, z) and extension (l) of a DNA molecule measured in a lateral pulling cycle, where the force is first suddenly increased (by moving the magnet to the closest position) (t = 20 s) and then decreased, in a stepwise manner. This produced a fast increase of the x signal and a small peak (arrow) that occurs just before the lift-off of the bead from the surface (left dashed line). The bead rests again at the surface beyond t = 95 s where the z measurement is close to zero (black arrow, and right dashed line), and the x coordinate recovers its maximum value.