

Abstract
Background
The proto-oncogene MYC is implicated in prostate cancer progression. Whether MYC tumor expression at the protein or mRNA level is associated with poorer prognosis has not been well studied.
Methods
We conducted a cohort study including 634 men from the Physicians’ Health Study and Health Professionals Follow-up Study treated with radical prostatectomy for prostate cancer in 1983–2004 and followed up for a median of 13.7 years. MYC protein expression was evaluated using IHC, and we used Cox regression to calculate HRs and 95% confidence intervals (CIs) of its association with lethal prostate cancer (distant metastases/prostate cancer–related death).We assessed the association between MYC mRNA expression and lethal prostate cancer in a case–control study, including 113 lethal cases and 291 indolent controls.
Results
MYC nuclear protein expression was present in 97% of tumors. MYC protein expression was positively correlated with tumor proliferation rate (r = 0.37; P < 0.001) and negatively correlated with apoptotic count (r = −0.17; P < 0.001). There were no significant associations between MYC protein expression and stage, grade, or PSA level at diagnosis. The multivariable HR for lethal prostate cancer among men in the top versus bottom quartile of MYC protein expression was 1.09 (95% CI, 0.50–2.35). There was no significant association between MYC mRNA expression and lethal prostate cancer.
Conclusions
Neither MYC protein overexpression nor MYC mRNA overexpression are strong prognostic markers in men treated with radical prostatectomy for prostate cancer.
Impact
This is the largest study to examine the prognostic role of MYC protein and mRNA expression in prostate cancer.
Introduction
The proto-oncogene MYC, a nuclear transcription factor regulating cellular processes such as metabolism, proliferation, and apoptosis, is a key biomarker in prostate cancer. Amplification of 8q/8q24, the genomic region where MYC is located, occurs in 10%–30% of localized prostate tumors and more than 50% of advanced tumors and has been linked with poorer prognosis in several studies (1–7). However, whether MYC overexpression at the protein or mRNA level is associated with poorer prognosis is less well studied and remains unclear (7–10).
The primary aim of this study was to assess the association of MYC protein expression in prostate tumors with clinicopathologic factors, and with risk of metastases and prostate cancer specific death. To this end, we conducted a cohort study including 634 men from the prospective Physicians’ Health Study (PHS) and Health Professionals Follow-up Study (HPFS) cohorts treated with radical prostatectomy for prostate cancer. We also explored the association between MYC tumor mRNA expression and lethal prostate cancer in a case–control study, including 113 lethal cases and 291 indolent controls from the PHS and HPFS.
Materials and Methods
Study population
This study includes men diagnosed with prostate cancer who were participants in the PHS and the HPFS. PHS was a randomized trial of aspirin and β-carotene among 22,071 male physicians ages 40 to 84 years at randomization in 1982 (11). HPFS is an ongoing prospective study of causes of cancer and other diseases among 51,529 male health professionals aged 40 to 75 years at enrollment in 1986 (12). In both PHS and HPFS, men were free of diagnosed cancer (excluding nonmelanoma skin cancer) at baseline. Incident prostate cancer diagnoses were identified by self-report, and then confirmed by review of medical records and pathology reports. All study participants provided written informed consent, the study was conducted in accordance with the U.S. Common Rule, and was approved by the institutional review boards at the Harvard T.H. Chan School of Public Health and Partners Health Care.
Clinical and follow-up data
Among participants with prostate cancer in PHS and HPFS, information on tumor stage, prostate-specific antigen (PSA) level at diagnosis, and treatments has been abstracted from medical records and pathology reports. Since 2000, prostate cancer patients have been followed for biochemical recurrence and development of metastatic disease via questionnaires. For men with prostate cancer in the HPFS, treating physicians have also been contacted to collect information about their clinical course and to confirm development of metastases. For men with prostate cancer in the PHS, about 80% of reports of metastases have been confirmed by medical record review. Biochemical recurrence has been reported by the participant or the treating physician, or abstracted from medical records; defined as PSA above 0.2 ng/mL postsurgery sustained over two measures when abstracted from medical records. Cause of death is assigned following a centralized review of medical records and death certificates by study physicians. Follow-up for mortality is >95%.
Tumor tissue cohort
Among men in PHS and HPFS diagnosed with prostate cancer, we have sought to retrieve archival formalin-fixed paraffin-embedded (FFPE) specimens for men who underwent radical prostatectomy or trans-urethral resection of the prostate (TURP). To date, we have retrieved archived tumor specimens from approximately 3,200 men. Hematoxylin and eosin slides have been reviewed by a pathologist to provide uniform Gleason grade and other histopathologic features, and to select areas of tumor for construction of tumor tissue microarrays (TMA). TMAs have been constructed by taking at least three 0.6-mm cores of tumor tissue per case from the primary tumor nodule or the nodule with the highest Gleason grade. For this study, we included 652 men (264 men from PHS, and 388 men from HPFS) treated with radical prostatectomy and included on a TMA for whom MYC protein expression was undertaken.
Protein expression data
Five-μm-sections of each TMA were deparaffinized in xylene, followed by a graded alcohol rehydration. Antigen retrieval was performed by microwaving the tissue in citrate buffer for 5 minutes. MYC antisera [c-Myc (N-term; MYC) antibody RabMAb, Cat.#: 1472-1, Rabbit Monoclonal Antibody, Epitomics Inc.] was applied at the concentration of 1:100 for 1 hour. We used a BioGenex i6000 automated staining platform (BioGenex Laboratories Inc.), and detection of the primary MYC antibody was carried out using the BioGenex SS Multilink secondary antibody, followed by horseradish peroxidase (HRP) conjugation to the secondary antibody using the Biogenex SS HRP Labeling kit. MYC expression was visualized using the 3,3-Diaminobenzidine (DAB) substrate kit (Vector Laboratories Inc.). Sections were subsequently counterstained with hematoxylin and dehydrated in a graded series of alcohol prior to coverslip application. For positive control we used reactive germinal centers (tonsil). For negative control, omission of the primary antibody. MYC expression was analyzed using the CRi Vectra/InForm multispectral analysis platform. The InForm software package was trained to segment prostate cancer tumor regions only (i.e., no stromal regions were included in the analysis). The staining intensity ranged from 0 to 0.3. Thresholds for positive nuclear and cytoplasmic staining were set based on the MYC staining intensity across all tumor samples and were verified by the pathologists to represent staining intensity detectable by eye. Calculation of MYC nuclear and cytoplasmic expression was performed after subtraction of the background staining/threshold values. Men with <100 tumor cells analyzed for MYC expression were excluded. The following four measures of MYC expression were calculated based on data from all available TMA cores: (i) MYC nuclear percentage staining (the number of cells staining positive for MYC in the nucleus divided by the total number of cells), (ii) MYC nuclear staining intensity (the mean nuclear staining intensity among the cells staining positive for MYC in the nucleus), (iii) MYC cytoplasmic percentage staining (the number of cells staining positive for MYC in the cytoplasm divided by the total number of cells), and (iv) MYC cytoplasmic staining intensity (the mean cytoplasmic staining intensity among the cells staining positive for MYC in the cytoplasm).
We were unable to successfully assess MYC protein expression for 18 participants due to technical reasons (e.g., benign tissue instead of tumor tissue on the TMAs), leaving 634 men for analyses (254 men from PHS, and 380 men from HPFS).
For a subset of the participants we also had data available on tumor proliferation (Ki67) and apoptosis (TUNEL assay), assessed as previously described (13). Ki67 was available for 618 men and TUNEL for 566 men with known MYC protein expression data.
mRNA expression data
Whole-transcriptome mRNA expression was available from a prior case–control study, including 404 men in PHS and HPFS with prostate cancer (14). The study design is described in detail in reference 14. Briefly, cases and controls were sampled from the Tumor tissue cohort (see above) using an extreme case design, and includes 113 men who died of prostate cancer or developed bony or distant metastases and 291 men who lived at least 8 years after prostate cancer diagnosis and were not diagnosed with metastases through 2012. Whole-transcriptome mRNA expression was conducted on archived FFPE tumor tissue using the Affymetrix Human Gene 1.0 ST array as previously described (14). There is not complete overlap between participants in the MYC tumor mRNA case–control study and the MYC tumor protein expression cohort; 222 participants with data on MYC mRNA expression also had data on MYC tumor protein expression.
Statistical analyses
Spearman trend tests were used to assess differences in MYC protein expression by categories of age at diagnosis, pathological tumor stage, Gleason score at diagnosis and PSA level at diagnosis. We used Cox proportional hazards models to calculate hazard ratios (HRs) and 95% confidence intervals (CIs) of the association between MYC protein expression and time to lethal prostate cancer (i.e., distant metastases or prostate cancer death) or biochemical recurrence. Men who did not report a PSA rise but who reported lymph node metastases, distant metastases, or who died of prostate cancer were assigned a biochemical recurrence on the earliest date of any of these events. Follow-up started at the date of prostate cancer diagnosis, and men were censored at death from other causes, or at end of follow-up (March 2011 for men in the PHS, and December 2011 for men from the HPFS). In both PHS and HPFS, follow-up for recurrence and metastases ended approximately 2 years before follow-up for death due to questionnaire timing. We used quantile normalization (15) to adjust for TMA batch effects in protein expression levels. After normalization, MYC nuclear percentage staining and MYC nuclear staining intensity were divided into quartiles. MYC cytoplasmic percentage staining and MYC cytoplasmic staining intensity were divided into three categories, as 34% of the tumors had no cytoplasmic MYC expression (see Results): no expression, below or equal to the median expression, and above the median expression. The median value of each category was modeled as a semicontinuous variable and included in the Cox model to test for evidence of linear trends. Spearman rank correlations were used for correlation analyses.
For the case–control analyses, odds ratios (OR) and 95% CIs for the association between MYC mRNA expression, modeled as a continuous variable, and prostate cancer death were calculated using unconditional logistic regression. We ran models adjusted for age at diagnosis, and multivariable models additionally adjusted for Gleason score and pathological tumor stage.
Analyses were conducted using SAS version 9.4 (SAS institute Inc.) and R version 3.3.1. All statistical tests were two-sided with P values <0.05 considered statistically significant.
Results
The MYC protein expression cohort consisted of 634 men diagnosed with prostate cancer between 1983 and 2004 and treated with radical prostatectomy. The mean age at diagnosis was 65.2 years. The median follow-up time was 13.7 years. There were 50 events of lethal prostate cancer (38 men died of prostate cancer, and 12 developed distant metastases), and 156 events of biochemical recurrences (including the 50 men with lethal prostate cancer).
The median number of tumor cells analyzed per tumor sample was 1,039 (Q1, 587; Q3, 1775). 97% of the tumors expressed nuclear MYC in at least one tumor cell, whereas cytoplasmic MYC was present in at least one tumor cell in 66% of the tumors; nuclear and cytoplasmic staining is shown in Supplementary Fig. S1. The median percentage of MYC nuclear staining was 10.5%, and the median percentage of MYC cytoplasmic staining was 0.4% (Table 1; Fig. 1). MYC staining intensity was also higher in the nucleus versus the cytoplasm; the median nuclear staining intensity was 0.029, whereas the median cytoplasmic staining intensity was 0.010.
Table 1.
Clinicopathologic characteristics and MYC protein expression among 634 men with prostate cancer in the PHS and HPFS cohorts treated with radical prostatectomy
| N | MYC nuclear percentage Median (q1–q3) | MYC nuclear intensity Median (q1–q3) | MYC cytoplasmic percentage Median (q1–q3) | MYC cytoplasmic intensity Median (q1–q3) | |
|---|---|---|---|---|---|
| All men | 634 | 10.5 (3.7–25.1) | 0.029 (0.018–0.043) | 0.41 (0.038–2.55) | 0.010 (0.002–0.028) |
| Age at diagnosis | |||||
| <66 (median) | 317 | 10.8 (3.8–24.8) | 0.030 (0.018–0.044) | 0.46 (0.038–2.48) | 0.011 (0.002–0.027) |
| ≥66 | 317 | 10.2 (3.4–25.2) | 0.029 (0.019–0.042) | 0.39 (0.038–2.71) | 0.010 (0.002–0.029) |
| Pa | 0.37 | 0.53 | 0.27 | 0.55 | |
| Tumor stageb | |||||
| pT2 N0/Nx | 424 | 11.8 (4.1–26.2) | 0.029 (0.018–0.044) | 0.48 (0.038–2.68) | 0.010 (0.002–0.028) |
| pT3 N0/Nx | 175 | 8.0 (2.9–22.0) | 0.028 (0.017–0.041) | 0.24 (0.037–2.09) | 0.010 (0.002–0.027) |
| pT4 N1 M1 | 19 | 15.0 (9.1–29.4) | 0.030 (0.022–0.044) | 0.45 (0.26–1.47) | 0.015 (0.005–0.021) |
| P | 0.08 | 0.50 | 0.74 | 0.95 | |
| Gleason score | |||||
| 4−6 | 119 | 9.3 (2.9–27.0) | 0.027 (0.016–0.046) | 0.31 (0.036–2.75) | 0.006 (0.002–0.027) |
| 3+4 | 243 | 14.3 (4.9–31.0) | 0.032 (0.020–0.046) | 0.59 (0.048–2.95) | 0.012 (0.002–0.028) |
| 4+3 | 164 | 8.9 (2.9–19.9) | 0.027 (0.017–0.040) | 0.21 (0.036–1.74) | 0.007 (0.002–0.025) |
| 8−10 | 108 | 9.2 (3.9–22.5) | 0.029 (0.021–0.043) | 0.42 (0.038–1.83) | 0.015 (0.002–0.028) |
| P | 0.16 | 0.69 | 0.48 | 0.90 | |
| PSA at diagnosisc | |||||
| <4 | 67 | 10.6 (3.3–26.2) | 0.029 (0.018–0.044) | 0.35 (0.04–1.9) | 0.007 (0.002–0.024) |
| 4−<10 | 338 | 11.0 (3.6–25.4) | 0.029 (0.018–0.042) | 0.40 (0.04–2.7) | 0.010 (0.002–0.028) |
| ≥10 | 162 | 9.3 (3.6–23.2) | 0.027 (0.019–0.043) | 0.34 (0.04–1.8) | 0.010 (0.002–0.027) |
| P | 0.50 | 0.81 | 0.73 | 0.40 |
All P values are based on Spearman’s rank correlations.
Available for 618 men.
Available for 567 men.
Figure 1.
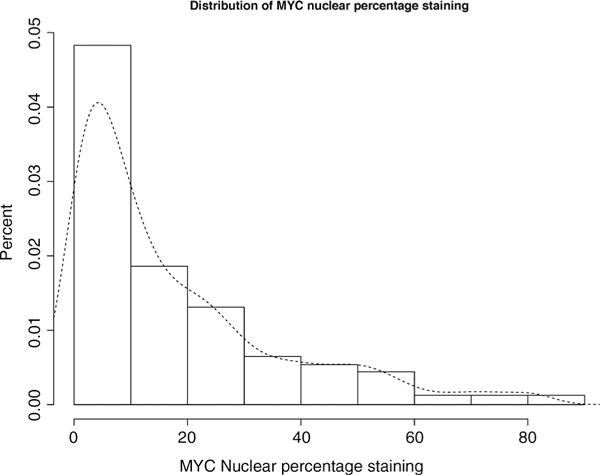
Distribution of quantile-normalized MYC nuclear percentage staining in radical prostatectomy tumor tissue samples from 634 men with prostate cancer in the PHS and HPFS cohorts.
There were no significant differences of MYC expression across categories of stage, age at diagnosis, Gleason score, or PSA at diagnosis (Table 1).
The different measures of MYC protein expression were positively correlated with Ki67 and negatively correlated with TUNEL (Table 2). For example, the Spearman rank correlation between MYC nuclear percentage staining and Ki67 was 0.37 (P < 0.001), and the correlation between MYC nuclear percentage staining and TUNEL was −0.17 (P < 0.001).
Table 2.
Spearman correlation coefficients and P values for the relationship between MYC protein expression and Ki67 and TUNEL in the prostate tumors among men with prostate cancer in the PHS and HPFS cohorts treated with radical prostatectomy
| MYC nuclear percentage N = 634 |
MYC nuclear intensity N = 634 |
MYC cytoplasmic percentage N = 634 |
MYC cytoplasmic intensity N = 634 |
Ki67 N = 618 |
TUNEL N = 566 |
|
|---|---|---|---|---|---|---|
| MYC nuclear percentage | 1.00 | 0.77 <0.001 |
0.80 <0.001 |
0.61 <0.001 |
0.37 <0.001 |
−0.17 <0.001 |
| MYC nuclear intensity | N/A | 1.00 | 0.77 <0.001 |
0.71 <0.001 |
0.31 <0.001 |
−0.18 <0.001 |
| MYC cytoplasmic percentage | N/A | N/A | 1.00 | 0.83 <0.001 |
0.30 <0.001 |
−0.17 <0.001 |
| MYC cytoplasmic intensity | N/A | N/A | N/A | 1.00 | 0.25 <0.001 |
−0.11 0.01 |
There were no significant associations between MYC expression and lethal prostate cancer or biochemical recurrence (Fig. 2; Table 3). The multivariable HR for lethal prostate cancer among men in the highest versus lowest quartile of MYC nuclear percentage staining was 1.09 (95% CI, 0.50–2.35), and the corresponding HR for biochemical recurrence was 1.10 (95% CI, 0.73–1.68).
Figure 2.
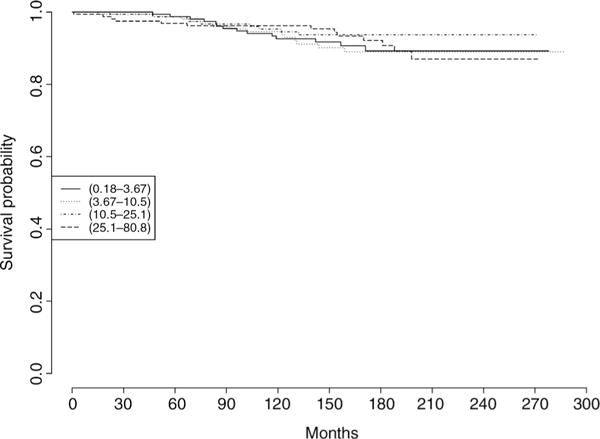
Survival times by quartile of MYC nuclear percentage staining among 634 men with prostate cancer in the PHS and HPFS cohorts treated with radical prostatectomy. The outcome is lethal prostate cancer (metastases or prostate cancer death).
Table 3.
HRs and 95% CIs of the association between MYC protein expression and lethal prostate cancer (N = 50) and biochemical recurrence (N = 156) among 634 men with prostate cancer in the PHS and HPFS cohorts treated with radical prostatectomy
| MYC expression | Median | Total | Lethal prostate cancer
|
Biochemical recurrence
|
||||
|---|---|---|---|---|---|---|---|---|
| Events | Model 1a | Model 2b | Events | Model 1a | Model 2b | |||
| Nuclear percentage | ||||||||
| Quartile 1 | 1.8 | 159 | 14 | Reference | Reference | 46 | Reference | Reference |
| Quartile 2 | 6.7 | 158 | 14 | 1.06 (0.50–2.22) | 1.07 (0.49–2.35) | 33 | 0.71 (0.46–1.11) | 0.68 (0.43–1.08) |
| Quartile 3 | 16.9 | 158 | 9 | 0.63 (0.27–1.45) | 0.66 (0.28–1.54) | 34 | 0.72 (0.46–1.12) | 0.67 (0.43–1.05) |
| Quartile 4 | 42.4 | 159 | 13 | 0.90 (0.42–1.91) | 1.09 (0.50–2.35) | 43 | 0.95 (0.62–1.43) | 1.10 (0.73–1.68) |
| Ptrend | 0.70 | 0.86 | 0.72 | 0.23 | ||||
| Nuclear intensity | ||||||||
| Quartile 1 | 0.013 | 159 | 12 | Reference | Reference | 36 | Reference | Reference |
| Quartile 2 | 0.024 | 158 | 10 | 0.82 (0.36–1.91) | 0.91 (0.39–2.12) | 38 | 1.10 (0.70–1.74) | 1.15 (0.73–1.81) |
| Quartile 3 | 0.035 | 158 | 14 | 1.11 (0.52–2.41) | 0.90 (0.40–2.01) | 42 | 1.20 (0.77–1.87) | 1.14 (0.72–1.78) |
| Quartile 4 | 0.062 | 159 | 14 | 1.14 (0.53–2.46) | 1.03 (0.47–2.26) | 40 | 1.13 (0.72–1.78) | 1.13 (0.72–1.78) |
| Ptrend | 0.58 | 0.89 | 0.63 | 0.69 | ||||
| Cytoplasmic percentage | ||||||||
| 0 | 0.0 | 219 | 17 | Reference | Reference | 46 | Reference | Reference |
| <Median | 0.5 | 207 | 16 | 1.03 (0.52–2.03) | 0.60 (0.29–1.26) | 56 | 1.38 (0.94–2.04) | 1.12 (0.75–1.67) |
| ≥Median | 4.5 | 208 | 17 | 1.03 (0.53–2.02) | 0.93 (0.47–1.82) | 54 | 1.31 (0.88–1.94) | 1.32 (0.89–1.95) |
| Ptrend | 0.95 | 0.66 | 0.45 | 0.19 | ||||
| Cytoplasmic intensity | ||||||||
| 0 | 0.000 | 219 | 17 | Reference | Reference | 46 | Reference | Reference |
| <Median | 0.011 | 207 | 17 | 1.07 (0.54–2.09) | 0.79 (0.39–1.58) | 58 | 1.42 (0.97–2.09) | 1.21 (0.82–1.80) |
| ≥Median | 0.034 | 208 | 16 | 0.99 (0.50–1.97) | 0.73 (0.35–1.49) | 52 | 1.27 (0.85–1.89) | 1.21 (0.81–1.81) |
| Ptrend | 0.42 | 0.42 | 0.37 | 0.41 | ||||
Model 1 is adjusted for age at diagnosis (continuous).
Model 2 is adjusted for age at diagnosis (continuous), pathological tumor stage (ordinal: pT2 N0/Nx, pT3 N0/Nx, pT4 N1 M1) and Gleason score (ordinal: 4−6, 3+4, 4+3, 8−10) at radical prostatectomy.
Among the 222 men with both MYC protein and MYC mRNA expression data, we found a weak, nonsignificant positive correlation (Spearman r = 0.10; P = 0.15) between MYC nuclear percentage protein expression and MYC mRNA expression.
MYC mRNA was modestly positively correlated with Ki67 (N = 215, Spearman r = 0.19; P = 0.004), and not correlated with TUNEL (N = 196, Spearman r = 0.13; P = 0.07).
Among the 404 men with available MYC mRNA expression data, there was no association between MYC mRNA levels and risk of prostate cancer death in age-adjusted (OR, 0.94; 95% CI, 0.63–1.39) or multivariable models (OR, 1.27; 95% CI, 0.77–2.11).
Discussion
Several studies have explored MYC protein expression in human prostate tumor samples using immunohistochemistry (7, 8, 10, 16–22). Results from these studies are not readily comparable as the MYC antibodies, subcellular staining localization (nuclear versus cytoplasmic) and scoring systems (including the choice of cutoff values to assign MYC positivity) differs across studies (23). MYC protein expression has been reported to be unassociated (20), positively associated (7, 21, 22) and negatively associated (18) with clinicopathologic factors such as stage and grade. In 2008, Gurel and colleagues (20) validated a new MYC antibody in a series of genetically defined control experiments. In tissue samples from 272 prostate cancer patients, MYC expression was localized primarily to the nuclei and was present in 82% of primary tumors, with a median MYC area fraction of staining—a proxy for the fraction of nuclei staining positive for MYC - of around 24%. In addition, MYC expression was not associated with tumor stage or grade. In this study, using the antibody validated by Gurel and colleagues, we found a high prevalence of MYC positive tumors (97%), with a median fraction of nuclei staining positive for MYC of 10.5%, and no clear association between MYC expression and clinicopathologic features. Although the somewhat higher proportion of MYC positive tumors, and somewhat lower proportion of nuclei staining positive for MYC, in our study compared to the study by Gurel and colleagues may be explained by differences in pre-analytical factors such as tissue fixation parameters and tissue block age (our database encompasses cases from across the United States over a ~ 25-year span), the differences in cutoff values applied for determining a case MYC positive, is the most plausible explanation. In any event, the results were totally concordant with the prior study. Overall, our finding supports the notion that MYC protein expression is a common event in prostate cancer, and that MYC protein expression is not strongly linked with clinicopathologic factors.
Prior studies of the association between MYC protein expression and biochemical recurrence or progression-free survival after radical prostatectomy are small and results are mixed, with one study reporting an inverse association (in men treated with adjuvant docetaxel for high-risk prostate cancer; ref. 8), one study reporting a positive association (10), and two studies reporting null associations (7, 21). Taken together with our null finding, these data do not support the notion that MYC protein over-expression is linked with poorer prognosis after radical prostatectomy. This is somewhat surprising given the rather strong evidence that 8q/8q24 amplification is associated with poor prognosis in prostate cancer (1–7). A possible explanation for this discrepancy is that the key event in 8q/8q24 amplification is not MYC amplification but amplification of other prognostically relevant genes in that region (7, 20, 23). In addition, MYC amplification is more prevalent (13% vs. 7%) in metastatic, castration-resistant disease than in primary tumors (24, 25), such as those we evaluated. Another possible explanation is that the role of MYC protein expression differs from that of MYC gene amplification as MYC protein levels are tightly regulated transcriptionally, post-transcriptionally, and post-translationally (26, 27). The short half-life of the MYC protein may also play a role (28).
We found a weak, non-significant positive correlation between MYC protein expression and MYC mRNA expression, in line with the notion that MYC mRNA and MYC protein expression do not necessarily correlate given the tight regulation of MYC protein levels (26, 27). To the best of our knowledge, no prior study has investigated the association between MYC protein expression and MYC mRNA expression in such a large clinical sample. We found no association between MYC mRNA expression and prostate cancer death in our data. Likewise, in the publicly available data set provided by the Memorial Sloan Kettering Cancer Center (http://www.cbioportal.org/), there is no significant association (P = 0.10) between MYC mRNA overexpression (Case set: Primary tumors with mRNA; “mRNA expression Z-scores vs. Normals” set to 2.0) and disease-free survival among 196 men with prostate cancer (29). Hawksworth and colleagues (9), in contrast, reported a significant positive association (univariate HR, 1.20; 95% CI, 1.05–1.36) between MYC mRNA expression levels and biochemical recurrence after radical prostatectomy in 80 patients. In summary, our data suggest that MYC mRNA and MYC protein expression are not strongly correlated, and that MYC mRNA expression is not associated with poorer prognosis.
In line with the notion that MYC regulates key cellular processes such as proliferation and apoptosis, we found a positive correlation between MYC protein expression and proliferation, as measured by Ki67, and a negative correlation between MYC protein expression and apoptosis, as measured by the TUNEL assay. These correlations suggest that tumors with higher versus lower MYC protein expression should more aggressive, and hence that MYC protein expression should be associated with poorer prognosis. A possible explanation for our null findings with respect to prognosis may be that the correlation between MYC protein expression and proliferation and apoptosis was rather low (0.37 for proliferation and −0–17 for apoptosis), and that neither proliferation nor apoptosis indices at diagnosis are strong prognostic factors in prostate cancer. Notably, the correlation between MYC expression and proliferation and apoptosis was stronger for MYC protein expression than for MYC mRNA expression in our data, which may suggest that MYC protein expression is a more biologically relevant measure of MYC activity.
The number of lethal events was limited (50 in the MYC protein analyses, and 113 in the MYC mRNA analyses), and we were thus not powered to detect weak to moderate associations between MYC expression and prognosis. We were unable to assess heterogeneity in MYC protein expression across tumor nodules as the TMAs were constructed by taking at least 3 cores from the same nodule (the primary tumor nodule or the nodule with the highest Gleason grade). The cores used for TMA construction and for mRNA analyses do also not necessarily match; thus, a possible explanation for the lack of correlation between MYC protein expression and MYC mRNA expression is that the tumor tissue analyzed comes from different tumor areas. Another limitation of this study is that we analyzed MYC protein expression in tumor tissue from treated rather than untreated men. It is possible that the prognostic utility of MYC expression in diagnostic biopsies from conservatively treated men is different from that in men treated with radical prostatectomy (30).
In conclusion, in a cohort of 634 men with prostate cancer treated with radical prostatectomy and followed prospectively for cancer outcomes, we observed nuclear MYC protein expression in almost all tumors, and no clear association between MYC protein expression levels and tumor stage or grade, or risk of biochemical recurrence or lethal prostate cancer. Likewise, in a case–control study, we found no significant association between MYC mRNA expression and prognosis. These results support the notion that nuclear MYC protein expression is a common event in prostate cancer, and suggest that MYC expression at the protein or mRNA level are not strong prognostic markers in men treated with radical prostatectomy.
Supplementary Material
Acknowledgments
We are grateful to Mara Meyer Epstein, Basant Badr, and Stefano Sioletic for work conducted in an earlier version of this article. We would like to thank the participants and staff of the PHS and HPFS for their valuable contributions as well as the following state cancer registries for their help: AL, AZ, AR, CA, CO, CT, DE, FL, GA, ID, IL, IN, IA, KY, LA, ME, MD, MA, MI, NE, NH, NJ, NY, NC, ND, OH, OK, OR, PA, RI, SC, TN, TX, VA, WA, WY. The TMAs were constructed by the Tissue Microarray Core Facility at the Dana Farber/Harvard Cancer Center. This work was supported by NIH grants U01 CA167552 [principal investigator (PI): Mucci, Willett], RO1CA131945 (PI: M. Loda), R01CA187918 (PI: M. Loda), and P50 CA90381 (PI: M. Loda, Balk); U.S. Army Prostate Cancer Program PC130716 (PI: M. Loda); and the Prostate Cancer Foundation.
Footnotes
Authors’ Contributions
Conception and design: A. Pettersson, K.L. Penney, E.L. Giovannucci, L.A. Mucci, M. Loda
Development of methodology: E.C. Stack, M. Loda
Acquisition of data (provided animals, acquired and managed patients, provided facilities, etc.): R.T. Lis, E.L. Giovannucci, L.A. Mucci, M. Loda
Analysis and interpretation of data (e.g., statistical analysis, biostatistics, computational analysis): A. Pettersson, T. Gerke, R.T. Lis, E.C. Stack, S. Tyekucheva, M. Loda
Writing, review, and/or revision of the manuscript: A. Pettersson, T. Gerke, K.L. Penney, R.T. Lis, E.C. Stack, N. Pértega-Gomes, G. Zadra, E.L. Giovannucci, L.A. Mucci, M. Loda
Administrative, technical, or material support (i.e., reporting or organizing data, constructing databases): T. Gerke, M. Loda
Study supervision: M. Loda
Note: Supplementary data for this article are available at Cancer Epidemiology, Biomarkers & Prevention Online (http://cebp.aacrjournals.org/).
Disclosure of Potential Conflicts of Interest
A. Pettersson is a resident in clinical oncology at Karolinska University Hospital. No potential conflicts of interest were disclosed by the other authors.
Disclaimer
The authors assume full responsibility for analyses and interpretation of these data.
References
- 1.Zafarana G, Ishkanian AS, Malloff CA, Locke JA, Sykes J, Thoms J, et al. Copy number alterations of c-MYC and PTEN are prognostic factors for relapse after prostate cancer radiotherapy. Cancer. 2012;118:4053–62. doi: 10.1002/cncr.26729. [DOI] [PubMed] [Google Scholar]
- 2.Qian J, Hirasawa K, Bostwick DG, Bergstralh EJ, Slezak JM, Anderl KL, et al. Loss of p53 and c-myc overrepresentation in stage T(2-3)N(1-3)M(0) prostate cancer are potential markers for cancer progression. Mod Pathol. 2002;15:35–44. doi: 10.1038/modpathol.3880487. [DOI] [PubMed] [Google Scholar]
- 3.Sato K, Qian J, Slezak JM, Lieber MM, Bostwick DG, Bergstralh EJ, et al. Clinical significance of alterations of chromosome 8 in high-grade, advanced, nonmetastatic prostate carcinoma. J Natl Cancer Inst. 1999;91:1574–80. doi: 10.1093/jnci/91.18.1574. [DOI] [PubMed] [Google Scholar]
- 4.Liu W, Xie CC, Thomas CY, Kim ST, Lindberg J, Egevad L, et al. Genetic markers associated with early cancer-specific mortality following prostatectomy. Cancer. 2013;119:2405–12. doi: 10.1002/cncr.27954. [DOI] [PMC free article] [PubMed] [Google Scholar]
- 5.Williams JL, Greer PA, Squire JA. Recurrent copy number alterations in prostate cancer: an in silico meta-analysis of publicly available genomic data. Cancer Genet. 2014;207:474–88. doi: 10.1016/j.cancergen.2014.09.003. [DOI] [PubMed] [Google Scholar]
- 6.Sun J, Liu W, Adams TS, Sun J, Li X, Turner AR, et al. DNA copy number alterations in prostate cancers: a combined analysis of published CGH studies. Prostate. 2007;67:692–700. doi: 10.1002/pros.20543. [DOI] [PubMed] [Google Scholar]
- 7.Fromont G, Godet J, Peyret A, Irani J, Celhay O, Rozet F, et al. 8q24 amplification is associated with Myc expression and prostate cancer progression and is an independent predictor of recurrence after radical prostatectomy. Hum Pathol. 2013;44:1617–23. doi: 10.1016/j.humpath.2013.01.012. [DOI] [PubMed] [Google Scholar]
- 8.Antonarakis ES, Keizman D, Zhang Z, Gurel B, Lotan TL, Hicks JL, et al. An immunohistochemical signature comprising PTEN, MYC, and Ki67 predicts progression in prostate cancer patients receiving adjuvant docetaxel after prostatectomy. Cancer. 2012;118:6063–71. doi: 10.1002/cncr.27689. [DOI] [PMC free article] [PubMed] [Google Scholar]
- 9.Hawksworth D, Ravindranath L, Chen Y, Furusato B, Sesterhenn IA, McLeod DG, et al. Overexpression of C-MYC oncogene in prostate cancer predicts biochemical recurrence. Prostate Cancer Prostatic Dis. 2010;13:311–5. doi: 10.1038/pcan.2010.31. [DOI] [PubMed] [Google Scholar]
- 10.Yang G, Timme TL, Frolov A, Wheeler TM, Thompson TC. Combined c-Myc and caveolin-1 expression in human prostate carcinoma predicts prostate carcinoma progression. Cancer. 2005;103:1186–94. doi: 10.1002/cncr.20905. [DOI] [PubMed] [Google Scholar]
- 11.Hennekens CH, Eberlein K. A randomized trial of aspirin and beta-carotene among U.S. physicians. Prev Med. 1985;14:165–8. doi: 10.1016/0091-7435(85)90031-3. [DOI] [PubMed] [Google Scholar]
- 12.Giovannucci E, Liu Y, Platz EA, Stampfer MJ, Willett WC. Risk factors for prostate cancer incidence and progression in the health professionals follow-up study. Int J Cancer. 2007;121:1571–8. doi: 10.1002/ijc.22788. [DOI] [PMC free article] [PubMed] [Google Scholar]
- 13.Dhillon PK, Barry M, Stampfer MJ, Perner S, Fiorentino M, Fornari A, et al. Aberrant cytoplasmic expression of p63 and prostate cancer mortality. Cancer Epidemiol Biomarkers Prev. 2009;18:595–600. doi: 10.1158/1055-9965.EPI-08-0785. [DOI] [PMC free article] [PubMed] [Google Scholar]
- 14.Penney KL, Sinnott JA, Tyekucheva S, Gerke T, Shui IM, Kraft P, et al. Association of prostate cancer risk variants with gene expression in normal and tumor tissue. Cancer Epidemiol Biomarkers Prev. 2015;24:255–60. doi: 10.1158/1055-9965.EPI-14-0694-T. [DOI] [PMC free article] [PubMed] [Google Scholar]
- 15.Gentleman R, Carey V, Huber W, Irizarry R, Dudoit S. Bioinformatics and Computational Biology Solutions using R and Bioconductor. New York, NY: Springer; 2005. [Google Scholar]
- 16.Jenkins RB, Qian J, Lieber MM, Bostwick DG. Detection of c-myc oncogene amplification and chromosomal anomalies in metastatic prostatic carcinoma by fluorescence in situ hybridization. Cancer Res. 1997;57:524–31. [PubMed] [Google Scholar]
- 17.Fox SB, Persad RA, Royds J, Kore RN, Silcocks PB, Collins CC. p53 and c-myc expression in stage A1 prostatic adenocarcinoma: useful prognostic determinants? J Urol. 1993;150:490–4. doi: 10.1016/s0022-5347(17)35533-7. [DOI] [PubMed] [Google Scholar]
- 18.Prowatke I, Devens F, Benner A, Grone EF, Mertens D, Grone HJ, et al. Expression analysis of imbalanced genes in prostate carcinoma using tissue microarrays. Br J Cancer. 2007;96:82–8. doi: 10.1038/sj.bjc.6603490. [DOI] [PMC free article] [PubMed] [Google Scholar]
- 19.Royuela M, de Miguel MP, Ruiz A, Fraile B, Arenas MI, Romo E, et al. Interferon-gamma and its functional receptors overexpression in benign prostatic hyperplasia and prostatic carcinoma: parallelism with c-myc and p53 expression. Eur Cytokine Netw. 2000;11:119–27. [PubMed] [Google Scholar]
- 20.Gurel B, Iwata T, Koh CM, Jenkins RB, Lan F, Van Dang C, et al. Nuclear MYC protein overexpression is an early alteration in human prostate carcinogenesis. Mod Pathol. 2008;21:1156–67. doi: 10.1038/modpathol.2008.111. [DOI] [PMC free article] [PubMed] [Google Scholar]
- 21.Udager AM, DeMarzo AM, Shi Y, Hicks JL, Cao X, Siddiqui J, et al. Concurrent nuclear ERG and MYC protein overexpression defines a subset of locally advanced prostate cancer: Potential opportunities for synergistic targeted therapeutics. Prostate. 2016;76:845–53. doi: 10.1002/pros.23175. [DOI] [PMC free article] [PubMed] [Google Scholar]
- 22.Zeng W, Sun H, Meng F, Liu Z, Xiong J, Zhou S, et al. Nuclear C-MYC expression level is associated with disease progression and potentially predictive of two year overall survival in prostate cancer. Int J Clin Exp Pathol. 2015;8:1878–88. [PMC free article] [PubMed] [Google Scholar]
- 23.Koh CM, Bieberich CJ, Dang CV, Nelson WG, Yegnasubramanian S, De Marzo AM. MYC and prostate cancer. Genes Cancer. 2010;1:617–28. doi: 10.1177/1947601910379132. [DOI] [PMC free article] [PubMed] [Google Scholar]
- 24.Cancer Genome Atlas Research Network. The molecular taxonomy of primary prostate cancer. Cell. 2015;163:1011–25. doi: 10.1016/j.cell.2015.10.025. [DOI] [PMC free article] [PubMed] [Google Scholar]
- 25.Robinson D, Van Allen EM, Wu YM, Schultz N, Lonigro RJ, Mosquera JM, et al. Integrative clinical genomics of advanced prostate cancer. Cell. 2015;161:1215–28. doi: 10.1016/j.cell.2015.05.001. [DOI] [PMC free article] [PubMed] [Google Scholar]
- 26.Junttila MR, Westermarck J. Mechanisms of MYC stabilization in human malignancies. Cell Cycle. 2008;7:592–6. doi: 10.4161/cc.7.5.5492. [DOI] [PubMed] [Google Scholar]
- 27.Sears RC. The life cycle of C-myc: from synthesis to degradation. Cell Cycle. 2004;3:1133–7. [PubMed] [Google Scholar]
- 28.Dang CV. MYC on the path to cancer. Cell. 2012;149:22–35. doi: 10.1016/j.cell.2012.03.003. [DOI] [PMC free article] [PubMed] [Google Scholar]
- 29.Taylor BS, Schultz N, Hieronymus H, Gopalan A, Xiao Y, Carver BS, et al. Integrative genomic profiling of human prostate cancer. Cancer Cell. 2010;18:11–22. doi: 10.1016/j.ccr.2010.05.026. [DOI] [PMC free article] [PubMed] [Google Scholar]
- 30.Pettersson A, Gerke T, Fall K, Pawitan Y, Holmberg L, Giovannucci EL, et al. The ABC model of prostate cancer: a conceptual framework for the design and interpretation of prognostic studies. Cancer. 2017;123:1490–96. doi: 10.1002/cncr.30582. [DOI] [PMC free article] [PubMed] [Google Scholar]
Associated Data
This section collects any data citations, data availability statements, or supplementary materials included in this article.