Abstract
Sensitive assay and imaging of multiple low-abundance microRNAs (miRNAs) in living cells remain a grand challenge. Herein, based on polyelectrolyte induced reduction, a facile approach has been proposed to synthesize novel MnO2 nanotubes. Owing to the remarkably strong fluorescence quenching ability, low cytotoxicity and excellent colloid stability, the as-prepared MnO2 nanotubes showed great potential for simultaneous detection and imaging of multiple miRNAs in vitro and in situ in living cells for the first time. Besides, MnO2 nanotubes can be reduced to Mn2+ by intracellular acid pH or glutathione, which may serve as activatable contrast reagent for MRI. Therefore, the MnO2 nanotubes based probes, termed “NanoSearchlight”, provide a promising, multimodal imaging tool for precise and accurate diagnosis and prognosis of cancers.
Keywords: MnO2 nanotubes, NanoSearchlight, Multiple MicroRNAs, Imaging, Live cells
TOC Graphic
INTRODUCTION
MicroRNAs (miRNAs) refer to a class of small regulatory RNAs, which have been demonstrated as a new-generation clinical biomarkers for early diagnosis and prognosis of cancers.1–7 Extensive research efforts have been paid to explore sensitive technologies for the detection of miRNAs.8–13 Furthermore, it is of great significance to measure a panel of miRNAs and thus give precise and accurate detection of cancers.14,15 On the other hand, imaging of miRNAs in situ in living cells could recognize cancerous cells directly. Therefore, it is highly desirable to develop reliable strategies for simultaneous imaging multiple miRNAs in living cells.
Currently, miRNA microarrays, Northern blots and qRT-PCR are commonly used methods for the detection and quantification of miRNAs.16–18 However, none of these conventional methods can be used for miRNA sensing in living cells. Recently, optical imaging assay based on the strategy of Förster resonance energy transfer (FRET) becomes an appealing method for monitoring miRNAs in living cells.19 In order to achieve high FRET efficiency, some nanomaterials, particularly 0D and 2D nanomaterials, have been fabricated as nanoquenchers for miRNA detection, including gold nanoparticles,20 quantum dots,21 carbon nanoparticles,22 graphene oxide,23 WS2 nanosheets,24 and metal-organic frameworks.25 It is worth noting that few 1D nanotubes beyond carbon nanotubes26–28 have been reported for such applications.
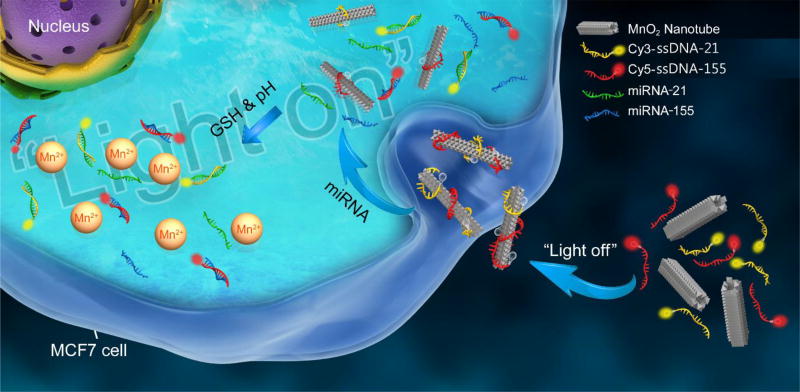
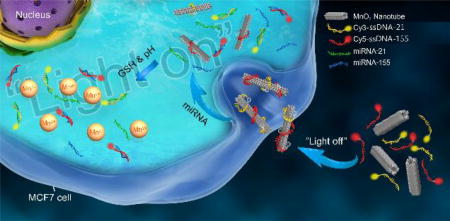
Recent studies revealed that MnO2 based nanostructures showed great potential in biomedical applications, including MnO2 nanoparticles29 and MnO2 nanosheets.30–34 Particularly, MnO2 nanosheets have been demonstrated as the energy acceptor for homogenous FRET assay.33 To the best of our knowledge, MnO2 nanotubes have not been reported for biomedical applications. Herein, we present the first MnO2 nanotubes as a new kind of 1D nanomaterials based nanoprobe, termed “NanoSearchlight”, for multiple miRNAs sensing in living cells. The NanoSearchlight MnO2 nanotubes provide a noninvasive method that can provide comprehensive insights on suspected tumors and assist in cancer screening and early detection. MiRNA-21 and miRNA-155, which have been found consistently overexpressed in breast cancer,35 are chosen as the targets for the proof-of-concept intracellular miRNAs sensing study. Scheme 1 demonstrates the signal-on strategy for imaging of multiple miRNAs in breast cancer cells (MCF-7 cells) by the NanoSearchlight. MnO2 nanotubes can afford high fluorescence quenching efficiency towards fluorescent dyes labeled two single-stranded DNAs (ssDNAs) probes as “light-off” status. Moreover, MnO2 nanotubes can facilitate uptake of the carried capturing probes into target cells via endocytosis. Once MnO2 nanotubes containing ssDNA probes are endocytosed into MCF-7 cells, ssDNA probes will bind to target miRNAs, form ssDNA probe-miRNA complexes, and therefore be released from the MnO2 nanotubes. The quenched fluorescence signals will be recovered as “light-on” status for illuminating the specific miRNAs in situ in living cells. Recent studies have revealed that MnO2 nanostructures could be used as activatable MRI contrast agents via reduction to Mn2+ by intracellular acid pH53–55 or glutathione (GSH).29,34 Similarly, the herein described MnO2 nanotubes can also provide activatable MRI imaging signals. Thus, the developed NanoSearchlight MnO2 nanotubes offer a promising, multimodal imaging tool for precise and accurate diagnosis and prognosis of cancers.
Scheme 1.
Signal-on sensing mechanism of NanoSearchlight MnO2 nanotubes for imaging of multiple miRNAs in tumor cells.
EXPERIMENTAL METHODS
Preparation of MnO2 nanotubes
The positively charged MnO2 nanotubes were prepared by one step method. 200 mg PDDA was mixed with 25 mL aqueous solution and heated to 120 °C in an oil bath. Then 200 mg KMnO4 was added into the mixed solution and stirred at 120 °C for 2 h. The resultant solution was dark brown in color, attesting that Mn7+ was reduced to Mn4+ and MnO2 was formed. The prepared dark brown suspension was centrifuged at 6000 rpm for 15 minutes washed with ultrapure water for five times, and the precipitated. MnO2 nanotubes were freeze-dried. MnO2 nanotubes were dispersed in ultrapure water to a concentration of 2 mg mL−1 ultrasonicated for 2 h, and retained for use.
Extracellular miRNAs detection
To investigate the mechanism of MnO2 nanotubes on the fluorescence quench and recovery of capturing ssDNAs, 100 µL MnO2 nanotubes dispersion at various concentrations (0, 0.5, 1.0, 1.5, 2.0, 3.5, 5.0 µg mL−1) were separately mixed with the mixture of Cy3 and Cy5 labelled capturing ssDNAs (100 µL, 50 nM capturing Cy3-ssDNA-21 for miRNA-21 detection and 50 nM capturing Cy5-ssDNA-155 for miRNA-155 detection) for 5 min followed by the addition of 800 µL ultrapure water. Through changing the distance between organic dyes and MnO2 nanotubes, the Förster resonant energy transfer (FRET) was applied to miRNA detection. We prepared MnO2 nanotubes-capturing ssDNA nanocomplex (MnO2/ssDNA) by mixing 25 µL of MnO2 nanotubes (20 µg mL−1) with 100 µL of capturing ssDNAs mixture (50 nM capturing Cy3-ssDNA-21 and 50 nM capturing Cy5-ssDNA-155) for 10 min. After reaching the quenched equilibrium, aqueous solutions of miRNA mixtures at different concentrations (100 µL, 10, 50, 100, 150, 200, 250, 400, 500, 750, 900 nM) were separately added into MnO2/ssDNA in 1 mL PBS buffer (pH 7.0, 0.01M). Then the resulting mixed solutions were incubated at 37 °C in a water bath for 10 min. After cooling to room temperature, the fluorescence signals were recorded.
Cell culture
MCF-7 breast cancer cells were purchased from ATCC and were cultured in RPMI-1640 media supplemented with 10% (v/v) fetal bovine serum (FBS), 100 U mL−1 penicillin G sodium and 100 µg mL−1 streptomycin sulfate keeping in a humidified and 5% CO2 atmosphere at 37 °C. Phosphate buffered saline (PBS, pH 7.4, 0.01M) without Ca2+ and Mg2+ was used to wash cells.
MTT assay of in vitro cytotoxicity of MnO2 nanotubes
In vitro cytotoxicity of the MnO2 nanotubes against MCF-7 cells was measured by the standard 3-(4,5-dimethylthiazol-2-yl)-2,5-diphenyltetrazolium (MTT) assay. MCF-7 cells were seeded in the 96-well plate with a density of 1×10⁴ cells per well. After incubation at 37 °C for 24 h, the cells were treated with cell culture medium containing various concentrations of MnO2 nanotubes for another 24 h. Then the culture medium was renewed, and 10 µL of MTT solution (Fisher, 5.0 mg mL−1 in PBS) was added into each well. After additional 4 h incubation, the culture medium was discarded and 100 µL of dimethylsulfoxide (DMSO) was added into each well to dissolve MTT. Finally, the optical density of each sample was recorded using a synergy H1 microplate reader (BioTeK, Winooski, VT) at a wavelength of 540 nm. The relative cell viability (%) was calculated by (Atest/Acontrol) × 100. The experiments were repeated three times and the error bars represent the standard derivations.
Confocal imaging analysis of intracellular miRNAs
1×10⁴ MCF-7 cells were cultured on a coverslip (diameter of 6mm) in the 24-well plates for 24 h. The MnO2/ssDNA nanocomplex was prepared by mixing 25 µL of MnO2 nanotubes (200 µg mL−1) and 100 µL of capturing ssDNAs mixture (50 µL of 1µM capturing Cy5-ssDNA-155 and 50µL of 1µM capturing Cy3-ssDNA-21) for 5 min followed by the addition of 875 µL cultural medium. The cells were treated with the MnO2/ssDNA nanocomplex for 0.5, 1.0, 2.0, 4.0 h at 37 °C, respectively. After washing with PBS three times, the cells were treated with 1 ml of 4% paraformaldehyde and placed in a humidified incubator at 37 °C for 10 minutes. Meanwhile, a glass slide was washed with ethanol and air dried. After the addition of 10 µL glycol onto the glass slide, the coverslip which was covered with cells was placed on the slide, sealing the coverslip and the slide. These cells were used to perform confocal microscopy imaging analysis for multiple miRNAs detection.
Flow cytometry
5×10⁵ MCF-7 cells/well were cultured in 12-well plates in RPMI media (10% FBS) and incubated at 37 °C overnight (5% CO2). The cells were then treated with MnO2-Cy5-ssDNA-155, MnO2-Cy3-ssDNA-21, or MnO2-Cy5-ssDNA-155/Cy3-ssDNA-21 at MnO2 concentration of 5 µg mL−1 and ssDNA concentration of 100 nM. At 1 and 4 hours post treatment, cells were rinsed with 1ml PBS twice and then detached with trypsin. The cells were centrifuged at 5000 rpm for 5 minutes and resuspended in 4% paraformaldehyde. Fluorescent signals from Cy3 and Cy5 were collected in the PE and APC channels of the flow cytometer, respectively.
2×10⁵ MCF-7 cells/well were cultured in 12-well plates in RPMI media (10% FBS) and incubated at 37 °C overnight (5% CO2). The cells were treated with free Cy5-ODN or MnO2-Cy5-ODN at MnO2 concentration of 5 ug mL−1 and Cy5-ODN concentration of 100nM. At 4, 8, 16, 24, and 48 hours post treatment, the cells were rinsed with 1ml PBS twice and detached with trypsin. The cells were centrifuged at 5000 rpm for 5 minutes and resuspended in 4% paraformaldehyde. Fluorescent signals from Cy5 were collected in the APC channel of the flow cytometer. 10,000 events were recorded for each sample. Mean fluorescence intensity of 3 replicates was reported.
MnO2 nanotubes as activatable MRI contrast agent
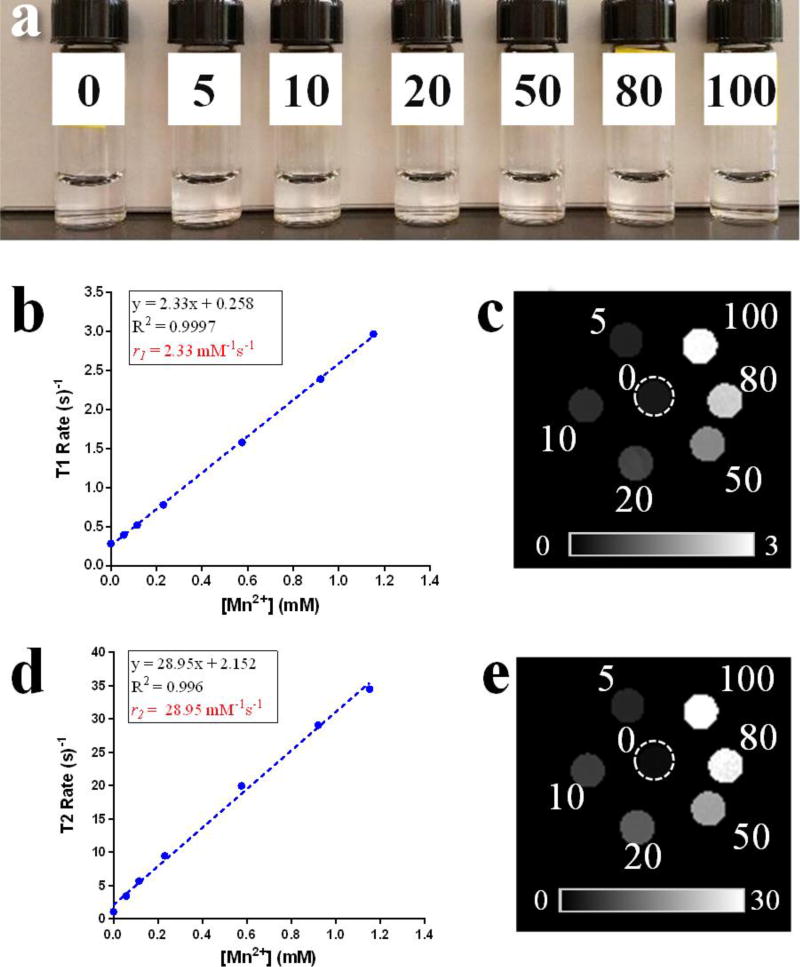
Increasing concentrations of MnO2 nanotubes (0, 5, 10, 20, 50, 80, 100 µg mL−1) were mixed with GSH (4 mM). The color of the MnO2 nanotubes solutions changed from black to colorless within 15 min indicating the successful reduction of MnO2 nanotubes to Mn2+. T1 and T2 relaxometry of GSH treated MnO2 nanotubes was carried out at 37 °C on a 4.7 Tesla preclinical MRI using the ParaVision 3.0.2 imaging platform (Bruker Biospin, Billerica, MA) and a custom-made, 35mm radiofrequency coil (m2m Imaging, Cleveland, OH). T1 and T2 relaxation rates were measured using an inversion-recovery, balanced steady-state free precession scan (IR-SSFP) and a Carr-Purcell-Meiboom-Gill (CPMG) multi-echo scan.56 Signal intensities from each sample’s region of interest were sampled and T1 and T2 rates were calculated using non-linear regression fits in MATLAB (MathWorks, Natick, MA). Relaxivity values were calculated by obtaining the slope of relaxation rate vs concentration. T1 and T2 relaxation rate maps were generated using non-linear regression fitting in MATLAB on a voxel-by-voxel basis.
RESULTS AND DISCUSSION
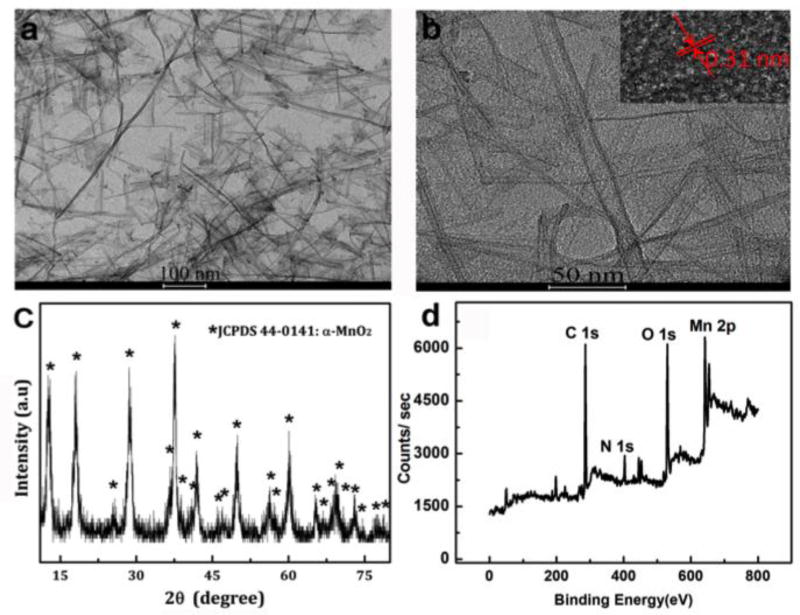
A new, facile method has been developed to prepare MnO2 nanotubes. Soluble MnO2 nanotubes were synthesized by poly (diallyldimethylammonium chloride) (PDDA) induced reduction of potassium permanganate (KMnO4) with one-pot reaction, in which PDDA was used as a reducing and stabilizing agent. It is clear that the as-prepared MnO2 nanotubes presented the typical tubular structure similar to carbon nanotubes (Figure 1a). The inserted high-resolution TEM (HRTEM) image reveals that MnO2 nanotubes have high crystalline structure with well-resolved lattice fringes (Figure 1b). The interplanar distance of the lattice fringes is 0.31 nm, corresponding to that of the (310) plane of MnO2.36 The XRD pattern of MnO2 nanotubes is shown in Figure 1c. All observed diffraction peaks of MnO2 nanotubes agree well with α-MnO2 (JCPDS no. 44-0141). The compositions of MnO2 nanotubes are further verified by X-ray photoelectron spectroscopy (XPS) (Figure 1d and Figure S1). The MnO2 nanotubes showed excellent colloid stability in water for 3 months without any agglomeration (Figure S2). Similar to MnO2 nanosheets,31 the MnO2 nanotubes exhibit a wide optical absorption window (λ≈300–800 nm) with an intense UV-vis absorption peak centered at 370 nm, which can be used as an efficient nanoquencher (Figure S3).
Figure 1.
Structure characterizations of MnO2 nanotubes: TEM images of MnO2 nanotubes (a, b), XRD pattern of MnO2 nanotubes (c) and XPS spectrum of MnO2 nanotubes (d).
The strong fluorescence quenching ability of MnO2 nanotubes was first investigated in aqueous solutions. Two types of ssDNAs labeled with Cy3 and Cy5 were used as capturing probes for the recognition of miRNA-21 and miRNA-155, respectively. The sequences of Cy3-ssDNA-21 and Cy5-ssDNA-155 are listed in Table S1. As showed in Figure S4, capturing Cy3-ssDNA-21 and Cy5- ssDNA-155 exhibited a maximum emission band at 566 nm and 668 nm with an excitation wavelength at 543 nm and 640 nm, respectively. The fluorescence intensity of capturing Cy3-ssDNA-21 and Cy5-ssDNA-155 decreased with increasing concentrations of MnO2 nanotubes (Figure S5). Moreover, a fast decrease in Cy3 and Cy5 fluorescence intensity (quenching efficiency >95%) was observed within 2 min after the addition of MnO2 nanotubes (500 ng mL−1) into capturing Cy3-ssDNA-21 or capturing Cy5-ssDNA-155 solution (5 nM) (Figure S6), which indicated that MnO2 nanotubes possessed highly efficient FRET capability. Compared with MnO2 nanosheets, the fluorescence quenching of MnO2 nanotubes was much faster and more efficient,30,51 as MnO2 nanotubes have shown the best quenching performance in comparison with the reported 1D nanomaterials (Table 1). Such rapid and efficient quenching of the as-prepared MnO2 nanotubes can be attributed to van der Waals force induced physisorption of the ssDNA chains on MnO2 nanotubes.30,37 The MnO2 nanotubes possess a zeta potential of +46.1 mV at 40.0 µg mL−1 (Figure S11). Therefore, negatively charged ssDNAs could interact with the positively charged MnO2 nanotubes by electrostatic interaction in a much faster and more stable manner. Compared to ssDNA, the formation of dsDNA decreases the surface charge of the DNA molecules and the exposure of the base. Therefore, the MnO2 NTs-ssDNA and MnO2 NTs-dsDNA show a significant difference in zeta potential when the same concentration of ssDNA and dsDNA combine with positively charged MnO2 NTs, respectively.
Table 1.
Comparison of the detection performances of DNA or miRNA by various nanoquenchers.
| Quencher (dimension) |
Quenching time |
Quenching Efficiency |
Detection time |
Linear range (nM) |
Detection limit |
Multiple detection |
Ref. |
|---|---|---|---|---|---|---|---|
| Gold nanoparticles (0D) | 10 min | - | 15 min | - | 0.1 pM | - | [42] |
| Carbon nanoparticles (0D) | - | 82% | 60 min | 33–300 | - | - | [43] |
| Polydopamine nanospheres (0D) | 1 min | 97% | 70 min | 0.78–25 | 0.1 nM | - | [44] |
| Polyaniline nanofiber (1D) | 10 min | 92.5% | 20 min | - | - | - | [45] |
| Carbon nanotube (1D) | 100 min | 96% | 185 min | - | 4 nM | - | [26] |
| CoP nanowires (1D) | 7 min | 65% | 14 min | 0.2–20 | 100 pM | - | [46] |
| Graphene (2 D) | 2 min | 96% | 35 min | - | 10 nM | - | [47] |
| Poly (p-phenylenediamine) nanobelt (2D) | 30 min | 92% | 90 min | 30–300 | - | - | [48] |
| metal-organic framework (MOF) (2D) | - | 84.5% | 240 min | 10–100 | 3 nM | - | [49] |
| MoS2 nanosheets (2D) | 5 min | 98% | 15 min | 0–15 | 500 pM | - | [37] |
| WS2 nanosheets (2D) | 20 min | 79% | 90 min | 0.1–50 | 60 pM | - | [50] |
| MnO2 nanosheets (2D) | - | 87% | >15 min | 0–20 | 0.8 nM | - | [51] |
| Carbon nitride nanosheets (2D) | 5 min | 90% | 65 min | - | - | 2 | [52] |
| MnO2 nanotubes (1D) | 2 min | >95% | 15 min | 1–90 | 0.6 nM | 2 | This work |
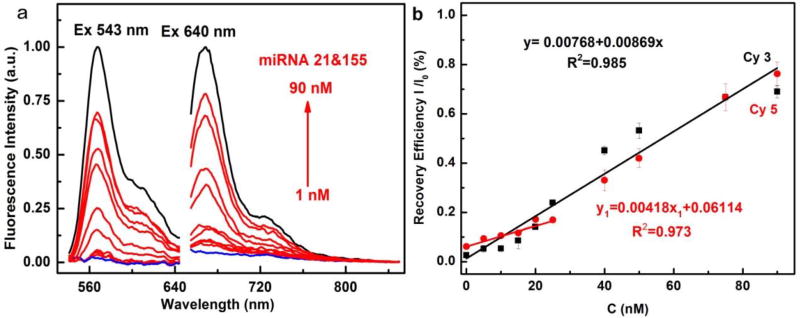
Thereafter, MnO2 nanotubes were used for mutiplex miRNA detection. MnO2/ssDNAs were simultaneously incubated with various concentrations of miRNA-21 and miRNA-155 (0, 1, 5, 10, 15, 20, 25, 40, 50, 75, 90 nM) at 37 °C for 30 min. After the hybridization with target miRNAs, ssDNAs probes were released from the MnO2 nanotubes, and as a result, the quenched fluorescence signals were restored. As shown in Figure 2, the fluorescence intensity increased with the increasing concentrations of miRNA-21 and miRNA-155. The linear calibration curves for the detection of miRNA-21 and miRNA-155 were obtained, respectively. MiRNA-21 could be measured in the range from 1 to 90 nM and miRNA-155 from 1 to 25 nM, each with the same limit of detection (LOD) of 0.6 nM (S/N=3). As presented in Table 1, it is notable that it only takes 15 min for NanoSearchlight MnO2 nanotubes to complete the whole detection procedure. And our NanoSearchlight MnO2 nanotubes achieved satisfactory detection performance compared with many other reported results, which indicates that they could serve as a reliable fluorescence sensing platform for sensitive, multiplex detection of miRNAs.
Figure 2.
Fluorescence intensity of MnO2-Cy3-ssDNA-21 or MnO2-Cy5-ssDNA-155 after simultaneous incubation with 1, 5, 10, 15, 20, 25, 40, 50, 75, 90 nM miRNA-21 and miRNA-155 (a). Calibration curves of fluorescence intensity ratio I/I0 vs target miRNA concentration (b).
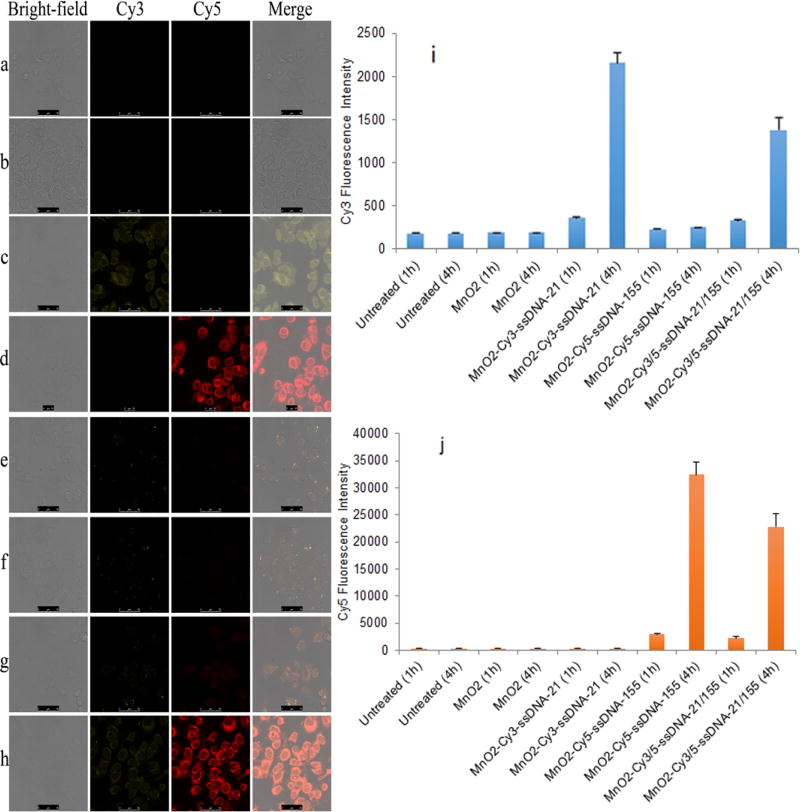
The cytotoxicity of MnO2 nanotubes was evaluated by the standard MTT assay with MCF-7 cells. As shown in Figure S7, more than 92.8 % cells survived after incubation with MnO2 nanotubes at concentrations ranging from 5.0 to 50 µg mL−1 for 24 h. This indicated that MnO2 nanotubes have low cytotoxicity, and therefore could be used to develop safe nanoprobes for intracellular miRNA imaging. In light of above results, NanoSearchlight MnO2 nanotubes were further characterized for in situ detection and imaging of miRNA-21 and miRNA-155 in MCF-7 breast cancer cells. To investigate the capability of MnO2/ssDNAs for synchronously monitoring intracellular multiple miRNAs, MCF-7 cells were incubated with MnO2/ssDNAs for 0.5, 1, 2, and 4 h. The fluorescence signals were first visualized by confocal microscopy. Subsequent, flow cytometry analysis was performed to quantify the fluorescence signals and to confirm the results of confocal microscopy. As shown in Figure 3 and Figure S10, results arising from both confocal microscopy and flow cytometry were agreement with each other. When MCF-7 cells were treated with MnO2 nanotubes alone, no changes of fluorescence intensity was observed in either Cy3 or Cy5 channels. When MCF-7 cells were incubated with MnO2-Cy3-ssDNA-21, the Cy3 fluorescence intensity emitted from capturing Cy3-ssDNA-21 probe increased ~2.0-fold at 1h and ~11.9-fold at 4 h. When MCF-7 cells were incubated with MnO2-Cy5-ssDNA-155, the Cy5 fluorescence intensity emitted from capturing Cy5-ssDNA-155 probe increased ~9.8-fold at 1h and ~108.8-fold at 4 h. When both capturing ssDNA probes were conjugated with MnO2, i.e. MnO2-Cy3-ssDNA-21/Cy5-ssDNA-155, ~1.8-fold and ~7.4-fold increase in Cy3 and Cy5 fluorescence intensity was observed at 1 h post transfection, and ~7.6-fold and ~76.4-fold increase in Cy3 and Cy5 fluorescence intensity was observed at 4 h post transfection. Compared with the cells treated with MnO2-Cy3-ssDNA-21 alone and MnO2-Cy5-ssDNA-155 alone, the lower fluorescence intensity observed in MnO2-Cy3-ssDNA-21/Cy5-ssDNA-155 treated cells might be due to the interference between these two ssDNA probes. To verify that the fluorescent signals from capturing ssDNA probes originated from the miRNA-ssDNA complexes instead of the degradation of ssDNA probes, we conjugated Cy5-oligodeoxynucleotides (Cy5-ODN) to MnO2 nanotubes. We treated MCF-7 cell with MnO2-Cy5-ODN at Cy5-ODN concentration of 100 nM, and found greatly reduced Cy5 fluorescence between 4 h and 48 h post transfection as compared to free Cy5-ODN (Figure S8). All these results demonstrated that MnO2/ssDNAs are capable of simultaneous monitoring of the expression of miRNA-21 and miRNA-155 in MCF-7 cells. Thus, the NanoSearchlight imaging platform could be used for in situ imaging of multiple intracellular miRNAs.
Figure 3.
Confocal microscopy images of MCF-7 cells transfected with blank cell culture medium (a), MnO2 nanotubes (b), MnO2-Cy3-ssDNA-21 (c), MnO2-Cy5-ssDNA-155 (d) at 37 °C for 4 h. Confocal microscopy images of MCF-7 cell transfected with MnO2-Cy3-ssDNA-21/Cy5-ssDNA-155 at 37 °C for 0.5 h, 1 h, 2 h, 4 h (e–h). Cy3 (i) and Cy5 (j) fluorescence intensity of MCF-7 cells measured by flow cytometry at 1 h and 4 h after MCF-7 cells were transfected with blank cell culture medium (untreated), MnO2 nanotubes, MnO2-Cy3-ssDNA-21, MnO2-Cy5-ssDNA-155, and MnO2-Cy3-ssDNA-21/Cy5-ssDNA-155 at 37 °C.
MnO2 nanotubes can be reduced to Mn2+ by GSH effectively. When GSH concentration was above 1.4 mM, MnO2 nanotubes were quickly converted to Mn2+, as indicated by the color change of MnO2 nanotubes solutions from yellowish-brown color to colorless within 15 min (Figures 4 and S9). Since intracellular GSH concentration in human body is always in the region of 1 mM to 10 mM,38,39 and is much higher in cancer cells,40,41 MnO2 nanotubes will be reduced completely by GSH in cancer cells, providing a large amount of Mn2+ for MRI. Therefore, potentinal MR imaging efficacy was characterized by T1 and T2 relaxometry of GSH treated MnO2 nanotubes at 37 °C on a 4.7T preclinical scanner. The comparable longitudinal relaxivity value, r1 (2.33 mM−1s−1) was obtained and was comparable to a commercial MRI contrast agent (Magnevist®: Gd-DTPA, r1=3.1 mM−1s−1) (Figure 4), suggesting that MnO2 nanotubes may serve as an effective, activatable contrast agent for MRI and aid in the detection of small tumors
Figure 4.
Photo of 0, 5, 10, 20, 50, 80, 100 µg mL−1 MnO2 nanotubes treated with GSH (4 mM) after 15 mins (a). T1 rates (b) and T1 rate map (c), T2 rates (d) and T2 rate map (e) against various Mn2+ concentrations measured after MnO2 nanotubes were treated with GSH. Dashed circle indicates location of (−) nanotube phantom.
CONCLUSIONS
In summary, a new and facile method has been developed to prepare MnO2 nanotubes, which involved polyelectrolyte induced reduction of potassium permanganate with one-pot reaction. The as-prepared MnO2 nanotubes exhibited remarkably strong fluorescence quenching capability. Following the strategy of FRET, MnO2 nanotubes were for the first time used for imaging of multiplex miRNAs in vitro and in living cells. In addition, MnO2 nanotubes can be reduced by GSH to Mn2+ for activatable MRI. NanoSearchlight MnO2 nanotubes represent a new class of materials for clinical diagnosis and prognosis of cancers.
Supplementary Material
Acknowledgments
This work was supported by WSU Start Up fund to Y. Lin, University at Buffalo Start Up fund to Y. Wu, the fellowship from the China Scholarship Council (CSC) to Q. Lu, and the NIH Cancer Center Support Grant P30-CA01605 and the Translational Imaging Shared Resource at Roswell Park Cancer Institute.
Footnotes
ASSOCIATED CONTENT
Sequences of DNA probes. XPS, UV-vis and Dispersibility of the MnO2 nanotubes. Fluorescence spectra of DNA probes. Fluorescence quenching of DNA probes by MnO2 nanotubes. MTT assay of MnO2 nanotubes. The color change of MnO2 nanotubes reaction with GSH.
References
- 1.Bartel DP. MicroRNAs: Genomics, Biogenesis, Mechanism, and Function. Cell. 2004;116:281–297. doi: 10.1016/s0092-8674(04)00045-5. [DOI] [PubMed] [Google Scholar]
- 2.Chen K, Rajewsky N. The Evolution of Gene Regulation by Transcription Factors and MicroRNAs. Nat. Rev. Genet. 2007;8:93–103. doi: 10.1038/nrg1990. [DOI] [PubMed] [Google Scholar]
- 3.Chen C, Li L, Lodish HF, Bartel DP. MicroRNAs Modulate Hematopoietic Lineage Differentiation. Science. 2004;303:83–86. doi: 10.1126/science.1091903. [DOI] [PubMed] [Google Scholar]
- 4.Dong H, Lei J, Ding L, Wen Y, Ju H, Zhang X. MicroRNA: Function, Detection, and Bioanalysis. Chem. Rev. 2013;113:6207–6233. doi: 10.1021/cr300362f. [DOI] [PubMed] [Google Scholar]
- 5.Frampton AE, Gall TM, Castellano L, Stebbing J, Jiao LR, Krell J. Blood-Based MiRNAs as Noninvasive Diagnostic and Surrogative Biomarkers in Colorectal Cancer. Expert Rev. Mol. Diagn. 2013;13:141–145. doi: 10.1586/erm.13.2. [DOI] [PubMed] [Google Scholar]
- 6.Dong H, Lei J, Ju H, Zhi F, Wang H, Guo W, Zhu Z, Yan F. Target-Cell-Specific Delivery, Imaging, and Detection of Intracellular MicroRNA with a Multifunctional SnO2 Nanoprobe. Angew. Chem. Int. Ed. 2012;51:4607–4612. doi: 10.1002/anie.201108302. [DOI] [PubMed] [Google Scholar]
- 7.Duan R, Zuo X, Wang S, Quan X, Chen D, Chen Z, Jiang L, Fan C, Xia F. Lab in a Tube: Ultrasensitive Detection of MicroRNAs at the Single-Cell Level and in Breast Cancer Patients Using Quadratic Isothermal Amplification. J. Am. Chem. Soc. 2013;135:4604–4607. doi: 10.1021/ja311313b. [DOI] [PubMed] [Google Scholar]
- 8.He X, Zeng T, Li Z, Wang G, Ma N. Catalytic Molecular Imaging of MicroRNA in Living Cells by DNA-Programmed Nanoparticle Disassembly. Angew. Chem. Int. Ed. 2016;55:3073–3076. doi: 10.1002/anie.201509726. [DOI] [PubMed] [Google Scholar]
- 9.Hong C, Baek A, Hah SS, Jung W, Kim DE. Fluorometric Detection of MicroRNA Using Isothermal Gene Amplification and Graphene Oxide. Anal. Chem. 2016;88:2999–3003. doi: 10.1021/acs.analchem.6b00046. [DOI] [PubMed] [Google Scholar]
- 10.Zhang X, Liu C, Sun L, Duan X, Li Z. Lab on A Single Microbead: an Ultrasensitive Detection Strategy Enabling MicroRNA Analysis at the Single-Molecule Level. Chem. Sci. 2015;6:6213–6218. doi: 10.1039/c5sc02641e. [DOI] [PMC free article] [PubMed] [Google Scholar]
- 11.Lee JH, Kim JA, Kwon MH, Kang JY, Rhee WJ. In Situ Single Step Detection of Exosome MicroRNA Using Molecular Beacon. Biomaterials. 2015;54:116–125. doi: 10.1016/j.biomaterials.2015.03.014. [DOI] [PubMed] [Google Scholar]
- 12.Dai W, Dong H, Fugetsu B, Cao Y, Lu H, Ma X, Zhang X. Tunable Fabrication of Molybdenum Disulfide Quantum Dots for Intracellular MicroRNA Detection and Multiphoton Bioimaging. Small. 2015;11:4158. doi: 10.1002/smll.201500208. [DOI] [PubMed] [Google Scholar]
- 13.Duan R, Zuo X, Wang S, Quan X, Chen D, Chen Z, Jiang L, Fan C, Xia F. Quadratic Isothermal Amplification for the Detection of MicroRNA. Nat. Protoc. 2014;9:597–607. doi: 10.1038/nprot.2014.036. [DOI] [PubMed] [Google Scholar]
- 14.Boeri M, Verri C, Conte D, Roza L, Modena P, Facchinetti F, Calabrò E, Croce CM, Pastorino U, Sozzi G. MicroRNA Signatures in Tissues and Plasma Predict Development and Prognosis of Computed Tomography Detected Lung Cancer. Proc. Natl. Acad. Sci. U.S.A. 2011;108:3713–3718. doi: 10.1073/pnas.1100048108. [DOI] [PMC free article] [PubMed] [Google Scholar]
- 15.Zhang P, He Z, Wang C, Chen J, Zhao J, Zhu X, Li C-Z, Min Q, Zhu JJ. In Situ Amplification of Intracellular MicroRNA with MNAzyme Nanodevices for Multiplexed Imaging, Logic Operation, and Controlled Drug Release. ACS Nano. 2015;9:789–798. doi: 10.1021/nn506309d. [DOI] [PubMed] [Google Scholar]
- 16.Castoldi M, Schmidt S, Benes V, Hentze MW, Muckenthaler MU. MiChip: an Array-Based Method for MicroRNA Expression Profiling Using Locked Nucleic Acid Capture Probes. Nat. Protoc. 2008;3:321–329. doi: 10.1038/nprot.2008.4. [DOI] [PubMed] [Google Scholar]
- 17.Varallyay E, Burgyan J, Havelda Z. MicroRNA Detection by Northern Blotting Using Locked Nucleic Acid Probes. Nat. Protoc. 2008;3:190–196. doi: 10.1038/nprot.2007.528. [DOI] [PubMed] [Google Scholar]
- 18.Meyer S, Pfaffl M, Ulbrich S. Normalization Strategies for MicroRNA Profiling Experiments: A ‘Normal’ Way to A Hidden Layer of Complexity? Biotechnol. Lett. 2010;32:1777–1788. doi: 10.1007/s10529-010-0380-z. [DOI] [PubMed] [Google Scholar]
- 19.Ryoo SR, Lee J, Yeo J, Na HK, Kim YK, Jang H, Lee JH, Han SW, Lee Y, Kim VN, Min DH. Quantitative and Multiplexed MicroRNA Sensing in Living Cells Based on Peptide Nucleic Acid and Nano Graphene Oxide(PANGO) ACS Nano. 2013;7:5882–5891. doi: 10.1021/nn401183s. [DOI] [PubMed] [Google Scholar]
- 20.Li N, Chang C, Pan W, Tang B. A Multicolor Nanoprobe for Detection and Imaging of Tumor-Related mRNAs in Living Cells. Angew. Chem. Int. Ed. 2012;51:7426–7430. doi: 10.1002/anie.201203767. [DOI] [PubMed] [Google Scholar]
- 21.Qiu X, Hildebrandt N. Rapid and Multiplexed MicroRNA Diagnostic Assay Using Quantum Dot-Based Förster Resonance Energy Transfer. ACS Nano. 2015;9:8449–8457. doi: 10.1021/acsnano.5b03364. [DOI] [PubMed] [Google Scholar]
- 22.Wang L, Cheng Y, Wang H, Li Z. A Homogeneous Fluorescence Sensing Platform with Water-Soluble Carbon Nanoparticles for Detection of MicroRNA and Nuclease Activity. Analyst. 2012;137:3667–3672. doi: 10.1039/c2an35396b. [DOI] [PubMed] [Google Scholar]
- 23.Ávila-de BEF, Martín A, Soto F, Lopez-RamiRNAez MA, Campuzano S, Vásquez-Machado GM, Gao W, Zhang L, Wang J. Single Cell Real-Time miRNAs Sensing Based on Nanomotors. ACS Nano. 2015;9:6756–6764. doi: 10.1021/acsnano.5b02807. [DOI] [PubMed] [Google Scholar]
- 24.Xi Q, Zhou DM, Kan YY, Ge J, Wu ZK, Yu RQ, Jiang JH. Highly Sensitive and Selective Strategy for MicroRNA Detection Based on WS2 Nanosheet Mediated Fluorescence Quenching and Duplex-Specific Nuclease Signal Amplification. Anal. Chem. 2014;86:1361–1365. doi: 10.1021/ac403944c. [DOI] [PubMed] [Google Scholar]
- 25.Wu Y, Han J, Xue P, Xu R, Kang Y. Nano Metal–Organic Framework (NMOF)-Based Strategies for Multiplexed MicroRNA Detection in Solution and Living Cancer Cells. Nanoscale. 2015;7:1753–1759. doi: 10.1039/c4nr05447d. [DOI] [PubMed] [Google Scholar]
- 26.Yang RH, Jin JY, Chen Y, Shao N, Kang HZ, Xiao Z, Tang ZW, Wu YR, Zhu Z, Tan WH. Carbon Nanotube-Quenched Fluorescent Oligonucleotides: Probes that Fluoresce upon Hybridization. J. Am. Chem. Soc. 2008;130:8351–8358. doi: 10.1021/ja800604z. [DOI] [PubMed] [Google Scholar]
- 27.Yang RH, Tang ZW, Yan JL, Kang HZ, Kim YM, Zhu Z, Tan WH. Noncovalent Assembly of Carbon Nanotubes and Single-Stranded DNA: An Effective Sensing Platform for Probing Biomolecular Interactions. Anal. Chem. 2008;80:7408–7413. doi: 10.1021/ac801118p. [DOI] [PubMed] [Google Scholar]
- 28.Zhang LB, Tao L, Li BL, Jing L, Wang EK. Carbon Nanotube–DNA Hybrid Fluorescent Sensor for Sensitive and Selective Detection of Mercury(II) Ion. Chem. Commun. 2010;46:1476–1478. doi: 10.1039/b921191h. [DOI] [PubMed] [Google Scholar]
- 29.Song M, Liu T, Shi C, Zhang X, Chen X. Bioconjugated Manganese Dioxide Nanoparticles Enhance Chemotherapy Response by Priming Tumor-Associated Macrophages toward M1-like Phenotype and Attenuating Tumor Hypoxia. ACS Nano. 2016;10:633–647. doi: 10.1021/acsnano.5b06779. [DOI] [PMC free article] [PubMed] [Google Scholar]
- 30.Zhao Z, Fan H, Zhou G, Bai H, Liang H, Wang R, Zhang X, Tan W. Activatable Fluorescence/MRI Bimodal Platform for Tumor Cell Imaging via MnO2 Nanosheet–Aptamer Nanoprobe. J. Am. Chem. Soc. 2014;136:11220–11223. doi: 10.1021/ja5029364. [DOI] [PubMed] [Google Scholar]
- 31.Fan H, Zhao Z, Yan G, Zhang X, Yang C, Meng H, Chen Z, Liu H, Tan W. A Smart DNAzyme–MnO2 Nanosystem for Efficient Gene Silencing. Angew. Chem. Int. Ed. 2015;54:4801–4805. doi: 10.1002/anie.201411417. [DOI] [PubMed] [Google Scholar]
- 32.Fan W, Bu W, Shen B, He Q, Cui Z, Liu Y, Zheng X, Zhao K, Shi J. Intelligent MnO2 Nanosheets Anchored with Upconversion Nanoprobes for Concurrent pH-/H2O2-Responsive UCL Imaging and Oxygen-Elevated Synergetic Therapy. Adv. Mater. 2015;27:4155–4161. doi: 10.1002/adma.201405141. [DOI] [PubMed] [Google Scholar]
- 33.Yuan Y, Wu S, Shu F, Liu Z. An MnO2 Nanosheet as A Label-Free Nanoplatform for Homogeneous Biosensing. Chem. Commun. 2014;50:1095–1097. doi: 10.1039/c3cc47755j. [DOI] [PubMed] [Google Scholar]
- 34.Zhu W, Dong Z, Fu T, Liu J, Chen Q, Li Y, Zhu R, Xu L, Liu Z. Modulation of Hypoxia in Solid Tumor Microenvironment with MnO2 Nanoparticles to Enhance Photodynamic Therapy. Adv. Funct. Mater. 2016;26:5490–5498. [Google Scholar]
- 35.Volinia S, Calin GA, Liu CG, Ambs S, Cimmino A, Petrocca F, Visone R, Iorio M, Roldo C, Ferracin M, Prueitt RL, Yanaihara N, Lanza G, Scarpa A, Vecchione A, Negrini M, Harris CC, Croce CM. A microRNA Expression Signature of Human Solid Tumors Defines Cancer Gene Targets. Proc. Natl. Acad. Sci. U.S.A. 2006;103:2257–2261. doi: 10.1073/pnas.0510565103. [DOI] [PMC free article] [PubMed] [Google Scholar]
- 36.Yang G, He B, Zhao F, Guo W, Xue Q, Li H. High Performance Sponge MnO2 Nanotube Monoliths. RSC Adv. 2015;5:60831–60834. [Google Scholar]
- 37.Zhu C, Zeng Z, Li H, Li F, Fan C, Zhang H. Single-Layer MoS2-Based Nanoprobes for Homogeneous Detection of Biomolecules. J. Am. Chem. Soc. 2013;135:5998–6001. doi: 10.1021/ja4019572. [DOI] [PubMed] [Google Scholar]
- 38.Hwang C, Sinskey AJ, Lodish HF. Oxidized Redox State of Glutathione in the Endoplasmic Reticulum. Science. 1992;257:1496–1502. doi: 10.1126/science.1523409. [DOI] [PubMed] [Google Scholar]
- 39.Lee MH, Yang Z, Lim CW, Lee YH, Dongbang S, Kang C, Kim JS. Disulfide-Cleavage-Triggered Chemosensors and Their Biological Applications. Chem. Rev. 2013;113:5071–5109. doi: 10.1021/cr300358b. [DOI] [PubMed] [Google Scholar]
- 40.Han D, Hanawa N, Saberi B, Kaplowitz N. Mechanisms of Liver Injury. III. Role of Glutathione Redox Status in Liver Injury. Am. J. Physiol.: Gastrointest. Liver Physiol. 2006;291:G1–G7. doi: 10.1152/ajpgi.00001.2006. [DOI] [PubMed] [Google Scholar]
- 41.Sćibior D, Skrzycki M, Podsiad M, Czeczot H. Glutathione Level and Glutathione-Dependent Enzyme Activities in Blood Serum of Patients with Gastrointestinal Tract Tumors. Clin. Biochem. 2008;41:852–858. doi: 10.1016/j.clinbiochem.2008.03.005. [DOI] [PubMed] [Google Scholar]
- 42.Li H, Rothberg LJ. DNA Sequence Detection Using Selective Fluorescence Quenching of Tagged Oligonucleotide Probes by Gold Nanoparticles. Anal. Chem. 2004;76:5414–5417. doi: 10.1021/ac049173n. [DOI] [PubMed] [Google Scholar]
- 43.Li H, Tian J, Wang L, Zhang Y, Sun X. Nucleic Acid Detection Using Carbon Nanoparticles as A Fluorescent Sensing Platform. Chem. Commun. 2011;47:961–963. doi: 10.1039/c0cc04326e. [DOI] [PubMed] [Google Scholar]
- 44.Qiang W, Li W, Li X, Chen X, Xu D. Bioinspired Polydopamine Nanospheres: A Superquencher for Fluorescence Sensing of Biomolecules. Chem. Sci. 2014;5:3018–3024. [Google Scholar]
- 45.Liu S, Wang L, Luo Y, Tian J, Li H, Sun X. Polyaniline Nanofibres for Fluorescent Nucleic Acid Detection. Nanoscale. 2011;3:967–969. doi: 10.1039/c0nr00873g. [DOI] [PubMed] [Google Scholar]
- 46.Tian J, Cheng N, Liu Q, Xing W, Sun X. Cobalt Phosphide Nanowires: Efficient Nanostructures for Fluorescence Sensing of Biomolecules and Photocatalytic Evolution of Dihydrogen from Water under Visible Light. Angew. Chem. Int. Ed. 2015;54:5493–5497. doi: 10.1002/anie.201501237. [DOI] [PubMed] [Google Scholar]
- 47.Lu C, Yang H, Zhu C, Chen X, Chen G. A Graphene Platform for Sensing Biomolecules. Angew. Chem. Int. Ed. 2009;48:4785–4787. doi: 10.1002/anie.200901479. [DOI] [PubMed] [Google Scholar]
- 48.Wang L, Zhang Y, Tian J, Li H, Sun X. Conjugation Polymer Nanobelts: A Novel Fluorescent Sensing Platform for Nucleic Acid Netection. Nucleic Acids Res. 2011;39:e37–e39. doi: 10.1093/nar/gkq1294. [DOI] [PMC free article] [PubMed] [Google Scholar]
- 49.Zhu X, Zheng H, Wei X, Lin Z, Guo L, Qiu B, Chen G. Metal–Organic Framework (MOF): A Novel Sensing Platform for Biomolecules. Chem. Commun. 2013;49:1276–1278. doi: 10.1039/c2cc36661d. [DOI] [PubMed] [Google Scholar]
- 50.Yuan Y, Li R, Liu Z. Establishing Water-Soluble Layered WS2 Nanosheet as A Platform for Biosensing. Anal. Chem. 2014;86:3610–3615. doi: 10.1021/ac5002096. [DOI] [PubMed] [Google Scholar]
- 51.Wang C, Zhai W, Wang Y, Yu P, Mao L. MnO2 Nanosheets Based Fluorescent Sensing Platform with Organic Dyes as A Probe with Excellent Analytical Properties. Analyst. 2015;140:4021–4029. doi: 10.1039/c5an00581g. [DOI] [PubMed] [Google Scholar]
- 52.Liao X, Wang Q, Ju H. Simultaneous Sensing of Intracellular MicroRNAs with A Multi-Functionalized Carbon Nitride Nanosheet Probe. Chem. Commun. 2014;50:13604–13607. doi: 10.1039/c4cc05768f. [DOI] [PubMed] [Google Scholar]
- 53.Chen Y, Ye D, Wu M, Chen H, Zhang L, Shi J, Wang L. Break-up of Two-Dimensional MnO2 Nanosheets Promotes Ultrasensitive pH-Triggered Theranostics of Cancer. Adv. Mater. 2014;26:7019–7026. doi: 10.1002/adma.201402572. [DOI] [PubMed] [Google Scholar]
- 54.Chen Y, Chen H, Zhang S, Chen F, Sun S, He Q, Ma M, Wang X, Wu H, Zhang LX, Zhang LL, Shi J. Structure-property Relationships in Manganese Oxide-mesoporous Silica Nanoparticles Used for T1-Weighted MRI and Simultaneous Anti-cancer Drug Delivery. Biomaterials. 2012;33:2388–2398. doi: 10.1016/j.biomaterials.2011.11.086. [DOI] [PubMed] [Google Scholar]
- 55.Chen Y, Yin Q, Ji X, Zhang S, Chen H, Zheng Y, Sun Y, Qu H, Wang Z, Li Y, Wang X, Zhang K, Zhang L, Shi J. Manganese Oxide-Based Multifunctionalized Mesoporous Silica Nanoparticles for pH-Responsive MRI, Ultrasonography and Circumvention of MDR in Cancer Cells. Biomaterials. 2012;33:7126–7137. doi: 10.1016/j.biomaterials.2012.06.059. [DOI] [PubMed] [Google Scholar]
- 56.Dorazio SJ, Tsitovich PB, Siters KE, Spernyak JA, Morrow JR. Iron(II) PARACEST MRI Contrast Agents. J Am Chem Soc. 2011;36:14154–14156. doi: 10.1021/ja204297z. [DOI] [PMC free article] [PubMed] [Google Scholar]
Associated Data
This section collects any data citations, data availability statements, or supplementary materials included in this article.


