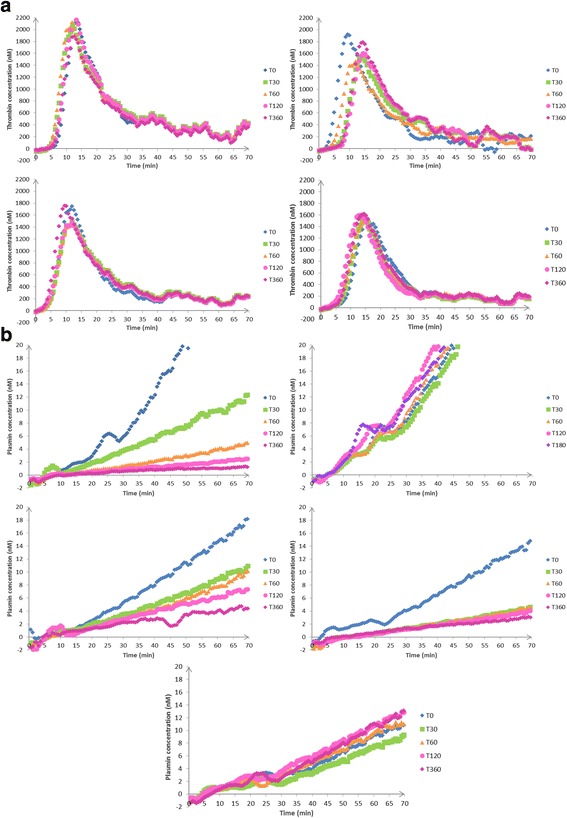
Fig. 6.

Time repeated profiles: evolution of thrombin (a) and plasmin (b) profiles over time points: T0, T30, T60, T120, and T360, in patients in the NH group, the H group, and TA group with increasing doses of TA: TA1/2: 0.5 g, TA1: 1 g, and TA2: 2 g. A-NH evolution of thrombin generation profile over time for a NH patient, B-NH evolution of plasmin generation profile over time for a NH patient, A-0 evolution of thrombin generation profile over time for a H patient receiving 0 g TA, B-0 evolution of plasmin generation profile over time for a H patient receiving 0 g TA, A-TA1/2 evolution of thrombin generation profile over time for a H patient receiving 0.5 g TA, B-TA1/2 evolution of plasmin generation profile over time for a H patient receiving 0.5 g TA, A-1 evolution of thrombin generation profile over time for a H patient receiving 1 g TA, B-1 evolution of plasmin generation profile over time for a H patient receiving 1 g TA, A-2 evolution of thrombin generation profile over time for a H patient receiving 2 g TA, B-2 evolution of plasmin generation profile over time for a H patient receiving 2 g TA
