Computer-aided diagnosis systems accurately classified 11 different focal liver lesion types as benign or malignant by analyzing 3-minute contrast-enhanced US cine clips acquired as a dual display to automatically extract hallmark sonographic, enhancement, and time-intensity curve features.
Abstract
Purpose
To assess the performance of computer-aided diagnosis (CAD) systems and to determine the dominant ultrasonographic (US) features when classifying benign versus malignant focal liver lesions (FLLs) by using contrast material–enhanced US cine clips.
Materials and Methods
One hundred six US data sets in all subjects enrolled by three centers from a multicenter trial that included 54 malignant, 51 benign, and one indeterminate FLL were retrospectively analyzed. The 105 benign or malignant lesions were confirmed at histologic examination, contrast-enhanced computed tomography (CT), dynamic contrast-enhanced magnetic resonance (MR) imaging, and/or 6 or more months of clinical follow-up. Data sets included 3-minute cine clips that were automatically corrected for in-plane motion and automatically filtered out frames acquired off plane. B-mode and contrast-specific features were automatically extracted on a pixel-by-pixel basis and analyzed by using an artificial neural network (ANN) and a support vector machine (SVM). Areas under the receiver operating characteristic curve (AUCs) for CAD were compared with those for one experienced and one inexperienced blinded reader. A third observer graded cine quality to assess its effects on CAD performance.
Results
CAD, the inexperienced observer, and the experienced observer were able to analyze 95, 100, and 102 cine clips, respectively. The AUCs for the SVM, ANN, and experienced and inexperienced observers were 0.883 (95% confidence interval [CI]: 0.793, 0.940), 0.829 (95% CI: 0.724, 0.901), 0.843 (95% CI: 0.756, 0.903), and 0.702 (95% CI: 0.586, 0.782), respectively; only the difference between SVM and the inexperienced observer was statistically significant. Accuracy improved from 71.3% (67 of 94; 95% CI: 60.6%, 79.8%) to 87.7% (57 of 65; 95% CI: 78.5%, 93.8%) and from 80.9% (76 of 94; 95% CI: 72.3%, 88.3%) to 90.3% (65 of 72; 95% CI: 80.6%, 95.8%) when CAD was in agreement with the inexperienced reader and when it was in agreement with the experienced reader, respectively. B-mode heterogeneity and contrast material washout were the most discriminating features selected by CAD for all iterations. CAD selected time-based time-intensity curve (TIC) features 99.0% (207 of 209) of the time to classify FLLs, versus 1.0% (two of 209) of the time for intensity-based features. None of the 15 video-quality criteria had a statistically significant effect on CAD accuracy—all P values were greater than the Holm-Sidak α-level correction for multiple comparisons.
Conclusion
CAD systems classified benign and malignant FLLs with an accuracy similar to that of an expert reader. CAD improved the accuracy of both readers. Time-based features of TIC were more discriminating than intensity-based features.
© RSNA, 2017
Introduction
Contrast material–enhanced ultrasonography (US) substantially improves the potential of US for the detection and characterization of focal liver lesions (FLLs) (1–6). It images the nonlinear response from intravenously injected microbubbles in real time, providing a dual display of contrast-specific and B-mode images (7,8). Normal liver parenchyma is fed primarily by the portal vein, while FLLs are predominantly fed by arterial vasculature. These differences create distinguishing enhancement patterns during the arterial, portal venous, and late phases after contrast material administration (eg, malignant primary or metastatic tumors typically show rapid arterial phase hyperenhancement followed by more rapid washout than liver parenchyma, whereas hemangiomas typically exhibit arterial phase peripheral nodular hyperenhancement with slow centripetal filling through the portal venous and late phases, with slower washout than liver parenchyma [2,4,9]). However, microbubble destruction and variations in tumor behavior and liver enhancement require experienced radiologists to reliably and accurately characterize tumors, but the number of radiologists experienced in performing and interpreting contrast-enhanced US studies is limited, and interobserver agreement remains an issue (10,11).
Computer-aided diagnosis (CAD) systems are a potential solution to these problems. Generally, CAD systems extract features from the B-mode and/or contrast-enhanced US videos and train machine learning algorithms to associate these features with the known diagnoses to predict the diagnoses of unknown lesions. Published CAD systems have generally captured time-intensity curves (TICs) from cine clips and calculated properties including peak enhancement, time to peak enhancement, and area under the curve (11–14). Additional features explored included relative enhancement between the lesion and the parenchyma (11–15), lesion rim versus lesion center (11,13–15), enhancement homogeneity (15), lesion morphology (11–13), and vessel morphology (13). Their performance, however, has been tested on a preselected set of three to five liver lesion types.
Because human observers look for hallmark B-mode appearances and enhancement patterns to detect and characterize FLLs, these patterns may allow CAD systems to accurately classify FLLs. The purpose of this study was to assess the performance of a CAD system and to determine the dominant US features when classifying benign versus malignant FLLs by using contrast-enhanced US cine clips.
Materials and Methods
Patient Population
Contrast-enhanced US cine clips of FLLs were retrospectively collected from all subjects enrolled at three independent sites (University of California San Diego, University of Alabama at Birmingham, and Southwoods Imaging [Youngstown, Ohio]) that were part of a Bracco Diagnostics (Princeton, NJ) multicenter trial (https://clinicialtrials.gov #NCT00788697). The primary study at all three sites had obtained institutional review board approval and written informed consent and admitted any subject with an FLL visible on the baseline US study. It was intended to evaluate the use of SonoVue (Bracco Imaging, Milan, Italy) in FLL characterization. Our retrospective review had institutional review board approval with waiver of informed consent for further analysis of de-identified cine clips, US images, and final diagnoses as benign, malignant, or indeterminate, without subject demographic or clinical data. Sponsorship from Bracco Diagnostics for the primary clinical trial at each site included the provision of financial support and contrast agents to the principle investigators. R.G.B. is on the advisory panel for Bracco. The entire data set from all three sites was provided with Bracco’s consent; however, Bracco neither had control over the data submitted for publication nor reviewed the manuscript prior to submission. C.N.T., A.C.K., and R.F.M. had full control of data and materials submitted for publication. Twenty-two of the cine clips included in this study were also included in our published study on motion correction algorithms (16).
SonoVue is an approximately 2.5-μm intravascular microbubble contrast agent with sulfur hexafluoride gas encapsulated in a phospholipid shell. The trial aimed to minimize performance variability across sites by prequalifying and training sonographers, investigators, and instruments. Three-minute cine clips were acquired between September 2009 and June 2012 as a dual-display of contrast-specific and B-mode images from the start of a 2.4-mL intravenous bolus injection of SonoVue through a 20-gauge catheter immediately followed by a 5-mL saline flush. All three sites used a Philips iU22 and C5–1 transducer (Philips Healthcare, Andover, Mass). Patients were imaged during quiet breathing, and the section plane was oriented to minimize out-of-plane motion whenever possible.
The truth standard was established by histologic examination—biopsy or surgery performed 1–30 days after contrast-enhanced US. When histologic examination was not possible, final diagnoses were established by well-accepted criteria at contrast-enhanced CT or contrast-enhanced magnetic resonance (MR) imaging performed 2–30 days before or 1–30 days after contrast-enhanced US for lesions 2 cm or larger. For smaller lesions, both modalities were required. In addition, subjects without histologic proof required imaging follow-up of 6 months or longer for confirmation. One lesion with indeterminate final diagnosis between benign and malignant was excluded from the study. All other lesions were included in this study. Benign lesions not specifically characterized (stable at imaging follow-up in subjects at low risk) were classified as benign and were referred to as benign indeterminate.
Feature Extraction and Automated Classification
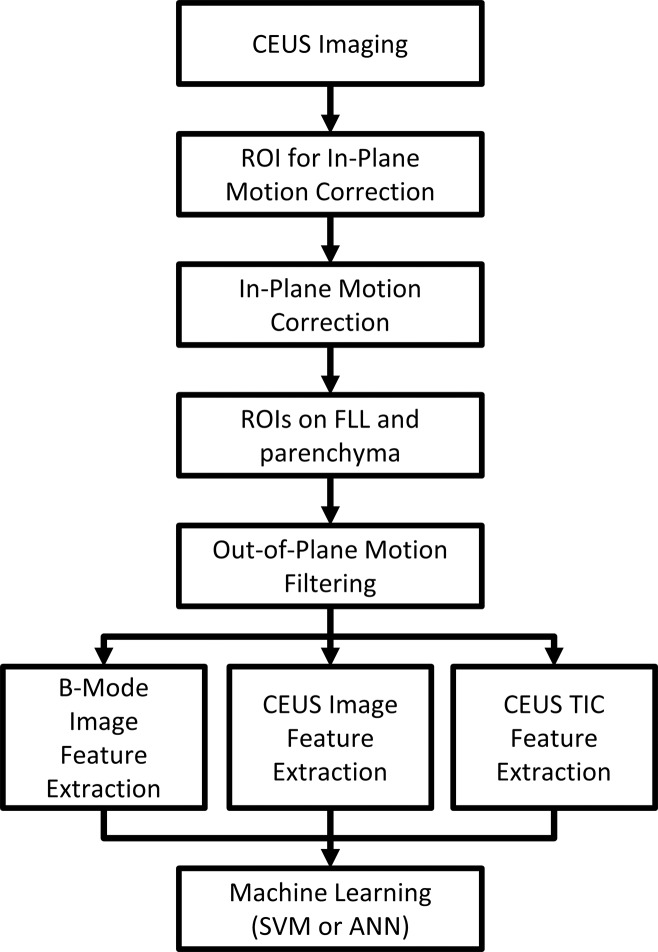
Motion correction and preprocessing.—Custom software was developed in Matlab R2015a (MathWorks, Natick, Mass) (Fig 1). To allow pixel-by-pixel analysis, in-plane motion correction and out-of-plane motion filtering were performed, as previously described (16). Briefly, in-plane motion correction was performed by first coregistering the single best correlated subreference frame from each motion cycle, followed by coregistering the remaining frames within each motion cycle to the nearest subreference frame. In-plane motion correction was followed by filtering out-of-plane frames whose correlation fell outside an automatic correlation threshold with the coregistered frames without affecting the time stamp of the remaining frames.
Figure 1:
Flowchart of CAD system. ANN = artificial neural network, CEUS = contrast-enhanced US, ROI = region of interest, SVM = support vector machine.
Two freehand ROIs were manually drawn on the B-mode images, one circumscribing the FLL and the other around normal liver parenchyma, excluding major vessels and rib shadowing and at the same depth as the FLL whenever possible. The FLL ROI was drawn to match the ROI selected by the investigator at each site (provided on separate B-mode images acquired before contrast material administration as part of the required clinical trial data set to identify the lesion and its depth and size). The ROIs were drawn by C.N.T., a PhD student, who followed the markers set by the investigator to highlight the FLL and also drew the liver ROI. The ROIs were reviewed by R.F.M., a radiologist with more than 30 years of experience in contrast-enhanced US, with some readjustments for difficult cine clips.
Feature extraction.—FLL morphologic features were extracted from the B-mode images of the dual display prior to microbubble arrival (see Appendix E1 [online] for details). The B-mode frames were averaged and blurred to reduce speckle, and FLL cross-sectional area, echogenicity and homogeneity, rim echogenicity, thickness, and nodularity were extracted.
Enhancement features were extracted from the contrast-specific images of the dual display. Three representative images were automatically calculated to represent the enhancement phases by averaging frames acquired when the liver enhanced between 4% and 50% of peak (arterial), 10 seconds at peak (portal venous), and the last 10 seconds of the 3-minute cine (late) (see Appendix E1 [online]). FLL enhancement features extracted from each image included enhancement relative to liver, homogeneity, fractional enhanced area, total unenhanced area, and rim thickness and nodularity. Dotted enhancement pattern and filling velocity were extracted during wash-in. In all, 20 contrast-specific features were extracted (Appendix E1 [online]).
Degree of enhancement was linearized to the echo power, and each pixel-TIC within the FLL ROI was calculated to measure perfusion parameters such as time of arrival and washout time (Table E1 [online]) (17). The spatial mean and standard deviation of each parameter represented overall FLL enhancement properties and heterogeneity, respectively. Pixel TICs were also characterized by their dynamic vascular patterns: unipolar positive, unipolar negative, bipolar positive-to-negative, and bipolar negative-to-positive, as previously described (18), and the fractional FLL area classified into each pattern was determined. In all, 66 TIC features were extracted (Appendix E1 [online]).
Machine learning.—SVMs and ANNs were used to classify benign or malignant lesions given the 92 B-mode, enhancement, and TIC features. Performance was assessed with 10-fold cross-validation testing, using the same partitions for both classifiers for comparison. Cross-validation testing is a standard method used to estimate CAD performance. Cines are randomly divided into 10 partitions, and the CAD is trained on all cines except for one partition that is used for testing (11–15,19,20). The process is repeated 10 times by using a different partition for testing. In each iteration of cross validation, feature selection was performed to reduce overfitting and to improve classifier generalizability. F-score filtering removed poorly discriminating features with a Fisher criterion below 10% of maximum (21); then, sequential forward feature selection iteratively added features minimizing the error rate until improvement ceased (22). The selected features were counted across all the iterations to measure the contribution of each feature for classification. A feed-forward ANN with one hidden layer containing four neurons with sigmoid transfer functions was trained by using resilient back propagation. SVM was performed by using LIBSVM with a linear kernel (cost = 1) (23).
The CAD systems’ classification confidence was calculated from the distance of the classifier decision value from the decision boundary. The confidence threshold was increased at every 5th percentile from the decision boundary, and accuracy was recalculated among predictions with decision values above the threshold.
Observer Classification
In addition to testing CAD performance in distinguishing benign from malignant FLLs, we aimed to compare its performance to that of two observers (Y.K. and M.E.), one experienced and one inexperienced, who independently viewed the anonymized contrast-enhanced US cine clips while blinded to the final diagnoses to assess CAD’s potential clinical use. In addition to classifying each FLL as benign or malignant, they rated their confidence as low, moderate, or high. The experienced observer had more than 20 years of performing and interpreting contrast-enhanced US. The inexperienced observer was a radiologist without prior contrast-enhanced US experience who attended a 1-hour workshop on interpreting contrast-enhanced US images using classic examples not included in this study.
CAD and observer performance were assessed by using standard characteristic descriptions of accuracy, sensitivity, specificity, positive predictive value, negative predictive value, and area under the receiver operating characteristic curve (AUC). Classification accuracy was recalculated within observer classifications with increasing confidence thresholds as follows: “low+” included all classifications (low-high confidence ratings), “moderate+” included only classifications with moderate and high confidence, and “high” included only high-confidence classifications.
To evaluate performance when relying on the CAD system to provide a second opinion to the observers, classification accuracy was calculated among lesions where the observer and CAD classifier agreed. When CAD disagreed with the inexperienced observer, the experienced reader’s classification was then used as the tie breaker to assess overall performance.
Cine Quality Assessment
To assess how image quality affected CAD performance, a third observer with more than 20 years of US experience (Y.T.O.) graded each cine clip on 15 criteria pertaining to motion, liver and FLL enhancement, and B-mode image quality (Table 1). Binary grades were assigned for each criterion, and the classification accuracy against the truth standard was compared between the videos where the criterion was present versus those where it was absent. Cines that could not be processed by the CAD systems were treated as inaccurate results (CAD errors).
Table 1.
The Effect of Image Quality on the Accuracy of Automated Diagnosis
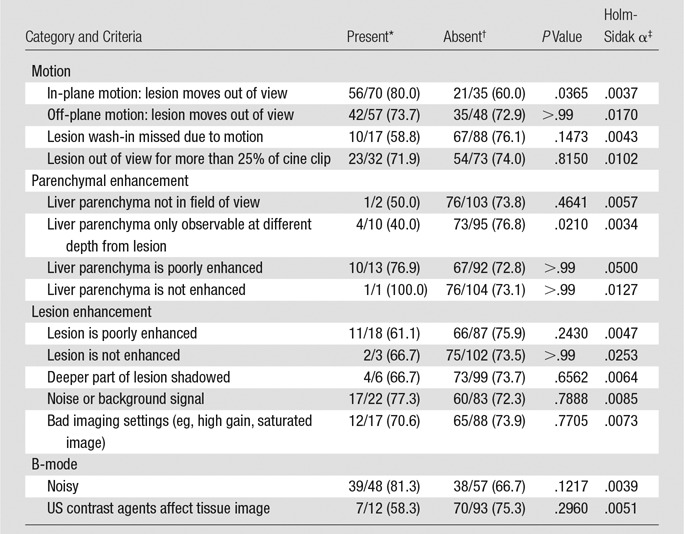
*Data are the number of correctly classified videos with the criteria/total number of videos with the criteria, with percentages in parentheses.
†Data are the number of correctly classified videos without the criteria/total number of videos without the criteria, with percentages in parentheses.
‡Values are the Holm-Sidak adjusted α criteria to be compared against unadjusted P values for significance testing with multiple comparisons (P values must be smaller than the adjusted α to be considered to indicate a statistically significant difference).
Statistical Analysis
Statistical analysis was performed in Matlab. Lesion sizes were compared by using a two-tailed t test; α = .05. Diagnostic performance was assessed with AUCs. 95% confidence intervals (CIs) for AUCs and accuracy were determined by 1000 iterations of bootstrapping using the bias-corrected and accelerated percentile method (24). To determine the relationship between confidence and classification accuracy, the Pearson correlation coefficient was evaluated; P values were calculated by using the Student t distribution (25), and α = .05. To determine if acquisition quality affected CAD performance, P values were calculated by using the Fisher exact test against the Holm-Sidak method for multiple comparisons.
Results
Patient Population
There were 106 subjects enrolled at all three sites with 54 malignant FLLs, 51 benign FLLs, and one indeterminate FLL; the indeterminate lesion was excluded from the study (Table 2), leaving 105 cine clips for analysis. Among the benign lesions, there were 30 hemangiomas, seven focal nodular hyperplasias, four instances of focal fatty sparing, two adenomas, one nodular regenerative hyperplasia, one fibrous scar, and six benign lesions not specifically characterized. Of the malignant lesions, there were 36 hepatocellular carcinomas, 16 metastases, one lymphoma, and one malignant spindle cell lesion. Average benign and malignant lesion sizes were 3.0 cm ± 1.8 (range: 1.1–9.4 cm) and 4.7 cm ± 2.9 (range: 1.1–17.1 cm), respectively, P < .001. Twenty lesions were between 1 and 2 cm, and 85 were 2 cm or larger.
Table 2.
Numbers and Largest Diameters of FLL Types in 106 Patients with 106 Lesions
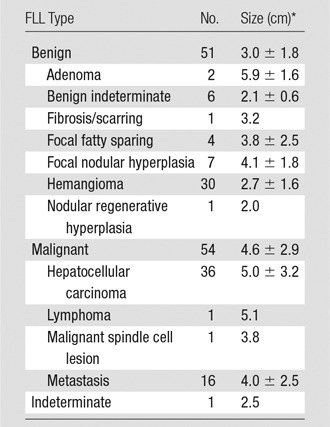
*Data are means ± standard deviations.
CAD Performance and Selected Features
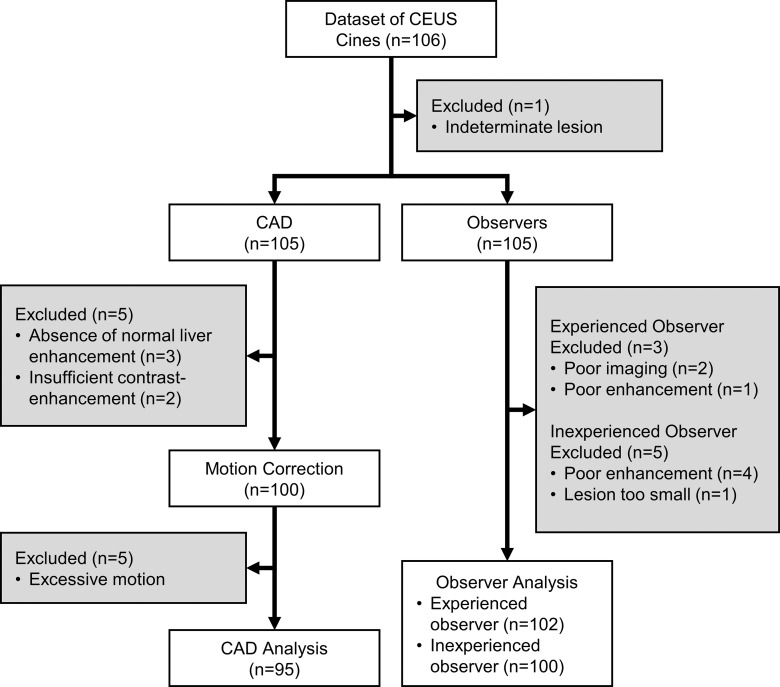
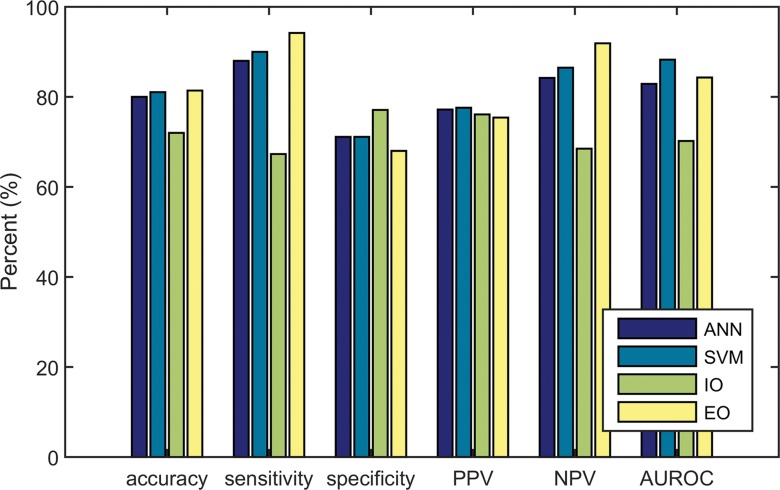
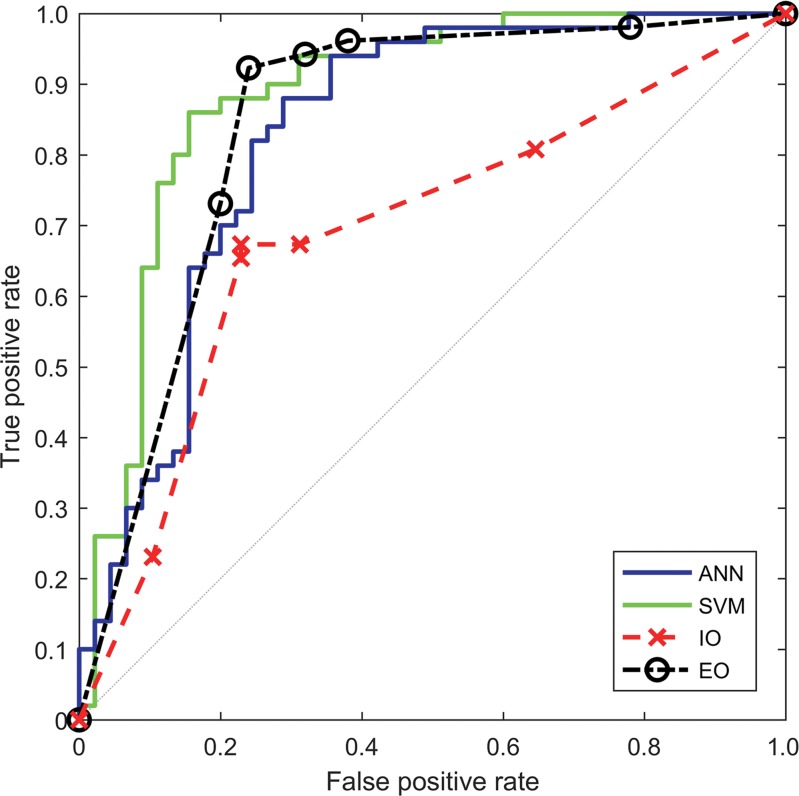
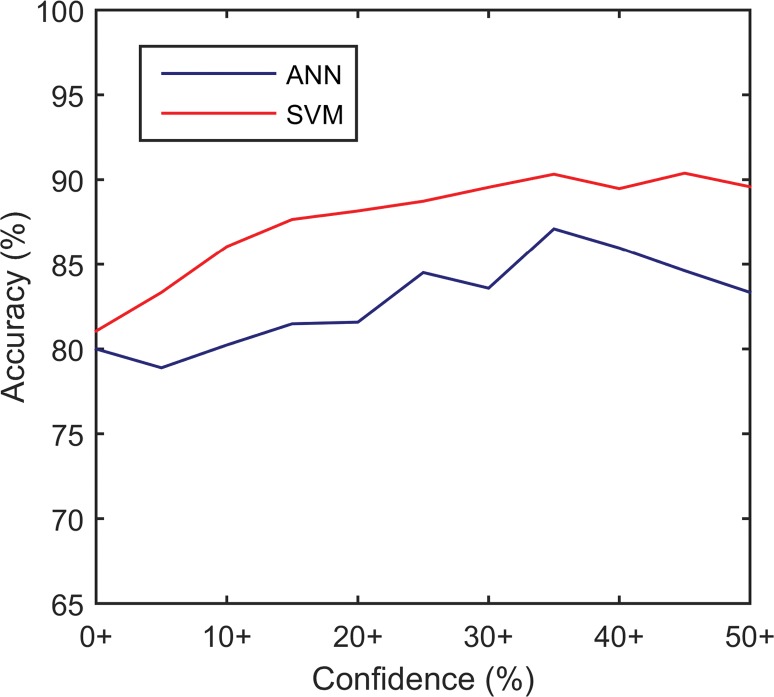
CAD systems were able to analyze 95 (90.5%) of 105 cine clips (50 in malignant FLLs, 45 in benign FLLs). CAD could not analyze some cine clips because of excessive motion (n = 5), absence of normal liver parenchymal enhancement (n = 3), or poor contrast enhancement (n = 2) (Fig 2). The mean sizes of ROIs for FLLs and normal liver were 8.7 cm2 (0.4–70 cm2) and 3.1 cm2 (0.5–9.2 cm2), respectively. Performance is summarized in Table 3 and Figure 3, and receiver operating characteristic curves are shown in Figure 4. The AUC for the SVM classifier was greater than that for the ANN classifier (0.883 [95% CI: 0.793, 0.940] vs 0.829 [95% CI: 0.724, 0.901]), but the difference was not statistically significant. Accuracy from both systems generally improved as the confidence threshold increased: r = 0.88, P < .001 for SVM; r = 0.81, P = .0027 for ANN (Fig 5a). When evaluating classifications at the 35th percentile in confidence or greater, the SVM and ANN systems achieved 90.3% (56 of 62) and 87.1% (54 of 62) accuracy, respectively. When treating the 10 excluded lesions as incorrect classifications, the SVM and ANN achieved accuracies of 73.3% (77 of 105; 95% CI: 63.8%, 81.0%) and 72.4% (76 of 105; 95% CI: 62.9%, 81.0%), respectively.
Figure 2:
Flowchart of videos included or excluded from the study. CEUS = contrast-enhanced US.
Table 3.
Diagnostic Performance of the ANN, the SVM, the Inexperienced Observer, and the Experienced Observer
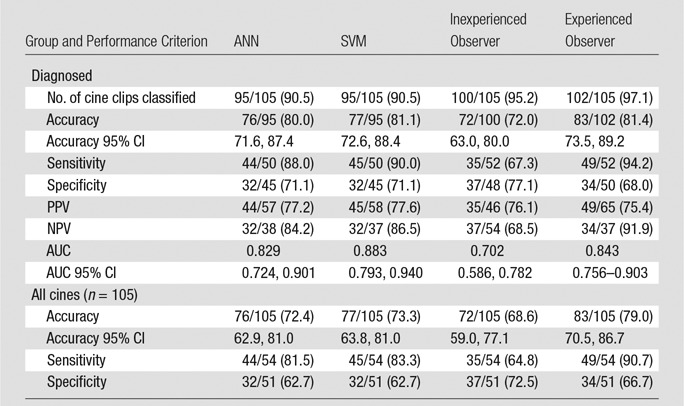
Note.—Because various cine clips were excluded by each method, accuracy, sensitivity, and specificity are presented relative to both the number of cine clips classified and all 105 cine clips, treating unclassified lesions as errors. Data in parentheses are percentages. NPV = negative predictive value, PPV = positive predictive value.
Figure 3:
Bar graph shows the diagnostic performance of the ANN, the SVM, the inexperienced observer (IO), and the experienced observer (EO). Accuracy, sensitivity, specificity, positive predictive value (PPV), negative predictive value (NPV), and AUC (AUROC) were evaluated.
Figure 4:
Graph shows receiver operating characteristic curves for the ANN classifier, the SVM classifier, the inexperienced observer (IO), and the experienced observer (EO). AUCs for the ANN, the SVM, the inexperienced observer, and the experienced observer were 0.829, 0.883, 0.702, and 0.843, respectively.
Figure 5a:
Graphs show effect of confidence on diagnostic accuracy for the (a) CAD systems and (b) observers. Accuracy was calculated within subsets containing the labeled confidence level and higher (eg, moderate+ = moderate and high confidence ratings). High-confidence subsets from the CAD classifiers were simulated by removing decision values nearest to the decision boundary. EO = experienced observer, IO = inexperienced observer.
The set of features selected are listed in Table E2 (online). For both SVM and ANN classifiers, FLL B-mode homogeneity was the most frequently selected parameter (selected in every iteration) for discriminating benign from malignant FLLs. At least one feature assessing contrast material washout time also appeared in all iterations. Features extracted from the TICs accounted for 209 (83.6%) of 250 feature selections by both CAD systems. Of all TIC features, time-based features accounted for 207 (99.0%) of 209 feature selections, while the area under the wash-in curve was the only intensity-based feature selected to discriminate among FLLs (two [1.0%] of 209 feature selections). Standard deviation–based features were selected by both CAD systems 109 (52.2%) of 209 times, while mean-based features were selected 100 (47.8%) of 209 times. Tumor size was selected only once. Mean processing time per cine clip with nonoptimized Matlab code running on an Intel Core i7–4720HQ 2.6-GHz CPU with 16.0 GB of RAM was 37.5 minutes for motion correction, 27.0 minutes for feature extraction, and less than 10 msec for prediction.
Observer Evaluation
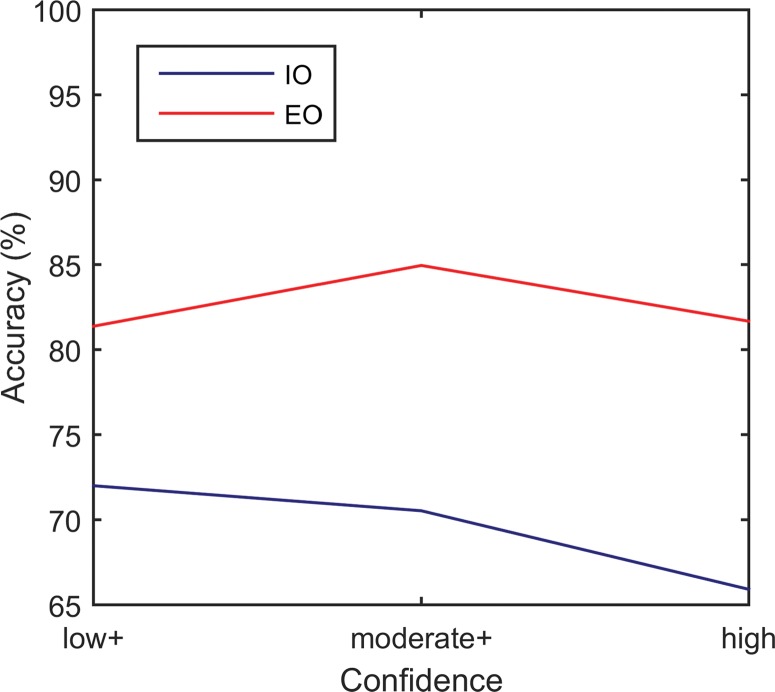
Performance and receiver operating characteristics of the two readers are displayed in Table 3 and Figures 3 and 4. The experienced observer was able to classify 102 cine clips. The other clips had poor image quality (n = 2) or poor enhancement (n = 1) (Fig 2). The AUC for this observer was 0.843 (95% CI: 0.756, 0.903). The inexperienced observer was able to classify 100 cine clips. The other clips had poor enhancement (n = 4) or the lesion was too small to characterize (n = 1). The AUC for this observer was 0.702 (95% CI: 0.586, 0.782). There was no significant correlation between each observer’s confidence level and accuracy (experienced reader: r = 0.07, P = .95; inexperienced reader: r = –0.96, P = .18) (Fig 5b). When treating the unclassified cine clips as incorrect classifications, the experienced and inexperienced observers achieved 79.0% (83 of 105; 95% CI: 70.5%, 86.7%) and 68.6% (72 of 105; 95% CI: 59.0%, 77.1%) accuracy, respectively.
Figure 5b:
Graphs show effect of confidence on diagnostic accuracy for the (a) CAD systems and (b) observers. Accuracy was calculated within subsets containing the labeled confidence level and higher (eg, moderate+ = moderate and high confidence ratings). High-confidence subsets from the CAD classifiers were simulated by removing decision values nearest to the decision boundary. EO = experienced observer, IO = inexperienced observer.
There were 94 lesions classified by the CAD SVM system and both observers. CAD was in agreement with the inexperienced and experienced readers for 65 and 72 lesions, respectively, increasing the accuracy of the inexperienced reader from 71.3% (67 of 94; 95% CI: 60.6%, 79.8%) to 87.7% (57 of 65; 95% CI: 78.5%, 93.8%) and that of the experienced reader from 80.9% (76 of 94; 95% CI: 72.3%, 88.3%) to 90.3% (65 of 72; 95% CI: 80.6%, 95.8%). When CAD disagreed with the inexperienced reader, the inexperienced reader’s and CAD’s accuracies were 34.5% (10 of 29; 95% CI: 20.7%, 51.7%) and 65.5% (19 of 29; 95% CI: 48.3%, 82.8%), respectively. When CAD disagreed with the experienced reader, the experienced reader’s and CAD’s accuracies were 50.0% (11 of 22; 95% CI: 27.3%, 72.7%) and 50.0% (11 of 22; 95% CI: 31.8%, 72.7%), respectively. For lesions in which CAD disagreed with the inexperienced reader, the experienced reader’s accuracy was 82.8% (24 of 29; 95% CI: 65.5%, 93.1%). For a simple majority vote between the two observers and CAD, overall accuracy was 86.2% (81 of 94; 95% CI: 77.7%, 92.6%).
Cine Quality Assessment
Because SVM outperformed the ANN classifier, the impact of cine quality was evaluated on VM performance. According to the Fisher exact test and Holm-Sidak adjusted α for multiple comparisons, none of the video quality criteria significantly affected the accuracy of the automated classification (Table 1).
Discussion
The primary aim of this study was to assess the ability of CAD systems to distinguish benign from malignant FLLs relative to the truth standard. They were able to classify over 90.5% (95 of 105) of cine clips collected at three sites of a multicenter trial that included sonographer and investigator training to minimize performance variations among sites. The multicenter trial was designed to assess the ability of experienced blinded observers and was not designed for computational analysis. When assessing the CAD classifiable FLLs, accuracy was 81.1% (77 of 95) and AUC was 0.883 (95% CI: 0.793, 0.940), which are less than those for other published systems, which range in accuracy from 86.4% to 92.7% when classifying lesions as benign or malignant (12,15,20) and from 84.8% to 88.3% when classifying FLLs by type (11,13–15). This is likely because our study included 11 FLL types and attempted to broadly classify them as either benign or malignant, while the published reports were limited to three to five lesion types. Including all lesion types in our study, some with only one or two samples each, obfuscated finding features common within each class. Furthermore, the 3-minute cine clips may have been too short to reveal late or mild washout in some hepatocellular carcinomas. The contrast-enhanced US Liver Imaging Reporting and Data System recommends intermittent imaging until clearance of contrast agents from the liver (5–7 minutes) for greater discrimination (2,4,9).
A secondary aim was to compare the performance of CAD relative to an experienced and inexperienced observer to assess its potential use in image interpretation. The CAD systems had better discrimination than the inexperienced reader and similar performance as the experienced reader. Both observers were able to classify more cines than the CAD systems (100 and 102 vs 95). When unclassifiable cines were treated as errors, the skilled observer had the highest accuracy (79.0% [95% CI: 70.5%, 86.7%], 83 of 105) followed by CAD (73.3% [95% CI: 63.8%, 81.0%], 77 of 105) and the inexperienced observer (68.6% [95% CI: 59.0%, 77.1%], 72 of 105). Because the cine clips were not acquired with computational analysis in mind, a few videos were intractable because of excessive transducer movement or lack of normal parenchyma within the field of view. If computational analysis is intended, these pitfalls can be avoided, or the acquisition repeated to optimize acquisition, because multiple contrast agent injections can be administered in the same imaging session.
CAD systems could provide a second opinion to improve confidence when classifications agree or to flag ambiguous lesions for additional review when they disagree. When the CAD classifier agreed with the reader, the accuracy of the experienced and inexperienced observers improved from 80.9% (76 of 94; 95% CI: 72.3%, 88.3%) to 90.3% (65 of 72; 95% CI: 80.6%, 95.8%) and from 71.3% (67 of 94; 95% CI: 60.6%, 79.8%) to 87.7% (57 of 65; 95% CI: 78.5%, 93.8%), respectively. When CAD disagreed with the inexperienced reader, adding the opinion of an experienced reader increased accuracy from 34.5% (10 of 29; 95% CI: 20.7%, 51.7%) to 82.8% (24 of 29; 95% CI: 65.5%, 93.1%). Furthermore, CAD accuracy improved when the calculated confidence thresholds were 35% or greater (r = 0.88 for SVM and r = 0.81 for ANN), reaching 90.3% (56 of 62) for SVM. This strong correlation could allow physicians to moderate their confidence on the basis of CAD confidence.
Another, secondary aim of this study was to determine which features had the greatest impact on FLL CAD classification. Interestingly, the most discriminating feature was the lesion’s B-mode homogeneity before contrast material administration. Given the importance of this metric and the fact that the B-mode images in contrast-enhanced US cine clips have suboptimal quality to reduce microbubble destruction, a high-quality B-mode image can be acquired before contrast-enhanced US acquisitions to improve classification. Of the many features describing FLL enhancement patterns and pixel-by-pixel TIC analysis, the most discriminating feature was the washout time, a known feature of malignant lesions. Time-dependent features across the 3-minute cine were more discriminating than intensity-dependent features, likely because intensity is highly influenced by many non-FLL dependent factors, including features such as contrast material dose, imaging settings, lesion depth, and shadowing. Features describing spatial enhancement heterogeneity (standard deviation) and overall perfusion (means) were similarly represented (52.2 [109 of 209] vs 47.8% [100 of 209]), suggesting that both overall perfusion and perfusion heterogeneity are important discriminators. There were multiple instances of similar features (eg, different metrics of wash-in or washout) being selected, which may be beneficial for robustness against noise or aberrational measurements. Despite statistically significant size differences, lesion size was infrequently selected as a discriminating factor.
This study had several limitations. With 105 lesions, this study had a relatively small sample size, where classification algorithms generally do not perform as well. Additionally with small sample sizes, diagnostic performance metrics may be sharply affected by a small number of incorrect observations, and interaction effects would be difficult to discern. Although CAD performance was evaluated by using cross-validation testing, because we used our own sample to set and test performance, this may overestimate real-world performance. All three recruiting sites used the same equipment manufacturer and model, contrast agent, dosage, and imaging guidelines. Additional studies that use a variety of imaging systems and contrast agents will be necessary to assess generalizability. A limited number of lesions were smaller than 2 cm (20 of 105 lesions). Additional studies will be needed to accurately assess CAD performance when classifying small lesions. In addition, features of the liver background (eg, cirrhosis, fatty liver) were not assessed, and this could affect performance. The system developed here classified FLLs solely on the basis of contrast-enhanced US imaging data; however, we anticipate that the inclusion of pretest probability factors (eg, Child-Pugh score, serum α-fetoprotein levels, CT or MR imaging findings, history of prior malignancy) will improve diagnostic accuracy. Processing time was slow in this study, averaging 64.5 minutes per cine clip. However, the code was not optimized. It can be accelerated considerably with general-purpose graphics processing unit programming and by extracting only the discriminating features defined in this study. Although CAD systems are designed to minimize operator intervention, this system required an operator to draw ROIs to identify the target lesion and liver parenchyma. Recent advancements in automated segmentation algorithms could eliminate this requirement (12,15,26–28).
In conclusion, CAD systems accurately classified 11 different FLL types as benign or malignant by analyzing 3-minute contrast-enhanced US cine clips acquired as a dual display to automatically extract hallmark sonographic, enhancement, and TIC features. Two CAD systems were developed by using ANNs and SVMs and were tested after in-plane motion correction and out-of-plane image filtering. The CAD SVM system achieved 81.1% (77 of 95) accuracy and an AUC of 0.883. Equally important, when CAD classification was in agreement with that of an experienced or inexperienced reader, it increased their accuracy to nearly 90%. FLL B-mode homogeneity precontrast and time-dependent postcontrast enhancement features—most notably, washout features—were the most discriminating.
Advances in Knowledge
■ Computer-aided diagnosis (CAD) systems can classify benign and malignant focal liver lesions (FLLs) in contrast-enhanced US cine recordings; the area under the receiver operating characteristic curve of the described CAD systems was comparable to that of an experienced blinded observer.
■ When CAD was in agreement with the experienced or the inexperienced reader, it improved their accuracy, from 80.9% (76 of 94) to 90.3% (65 of 72) and from 71.3% (67 of 94) to 87.7% (57 of 65), respectively; when CAD was in disagreement with the inexperienced reader, the opinion of an experienced reader increased accuracy from 34.5% (10 of 29) to 82.8% (24 of 29); and when CAD disagreed with the experienced reader, they were both 50.0% accurate (11 of 22).
■ B-mode homogeneity precontrast and time-intensity curve washout time features were always selected by the CAD system as most important for classifying benign and malignant FLLs; temporal-based features were selected 207 (99.0%) of 209 times, compared with only one intensity-based feature (area under the early wash-in curve), which was selected twice.
■ Standard deviation–based features were slightly more frequently selected than mean-based features (52.2% [109 of 209] vs 47.8% [100 of 209], respectively), indicating that feature heterogeneity is as important as mean changes for classifying FLLs.
Implication for Patient Care
■ CAD systems that accurately analyze contrast-enhanced US cine clips to distinguish benign from malignant FLLs can be integrated into the diagnostic workflow to confirm observer diagnoses or to flag lesions for further review to improve overall diagnostic accuracy.
APPENDIX
SUPPLEMENTAL FIGURES
Received February 14, 2017; revision requested April 11; revision received June 23; accepted July 25; final version accepted August 14.
This study received support from the National Cancer Institute (F31CA177199, R25CA153915); the Center for Cross Training Translation Cancer Researchers in Nanotechnology (R25 CA153915); the Cancer Prevention Research Institute of Texas (CPRIT-RR150010); and Bracco Diagnostics, which permitted the use of the contrast-enhanced US cine clips originally acquired in their sponsored clinical trial.
Disclosures of Conflicts of Interest: C.N.T. disclosed no relevant relationships. Y.K. disclosed no relevant relationships. M.E. disclosed no relevant relationships. Y.T.O. disclosed no relevant relationships. M.L.R. Activities related to the present article: disclosed no relevant relationships. Activities not related to the present article: institution has received money from Philips for new equipment evaluation; has been paid by Bracco for internal Bracco sales meeting lectures. Other relationships: disclosed no relevant relationships. R.G.B. Activities related to the present article: disclosed no relevant relationships. Activities not related to the present article: is on the speakers bureau of Philips Ultrasound; has received grants from Siemens Ultrasound, SuperSonic Imagine, and B and K Ultrasound; is on the advisory panel of Lantheus Medical; receives royalties from Thieme Publishers. Other relationships: disclosed no relevant relationships. A.C.K. disclosed no relevant relationships. R.F.M. Activities related to the present article: disclosed no relevant relationships. Activities not related to the present article: is an unpaid member of the scientific board of Samumed; has received an Established Investigator Award from CPRIT; has received fees from Bracco Diagnostic for attending a marketing meeting. Other relationships: disclosed no relevant relationships.
Abbreviations:
- ANN
- artificial neural network
- AUC
- area under the receiver operating characteristic curve
- CAD
- computer-aided diagnosis
- CI
- confidence interval
- FLL
- focal liver lesion
- ROI
- region of interest
- SVM
- support vector machine
- TIC
- time-intensity curve
References
- 1.Bartolotta TV, Taibbi A, Midiri M, Matranga D, Solbiati L, Lagalla R. Indeterminate focal liver lesions incidentally discovered at gray-scale US: role of contrast-enhanced sonography. Invest Radiol 2011;46(2):106–115. [DOI] [PubMed] [Google Scholar]
- 2.Claudon M, Dietrich CF, Choi BI, et al. Guidelines and good clinical practice recommendations for Contrast Enhanced Ultrasound (CEUS) in the liver - update 2012: a WFUMB-EFSUMB initiative in cooperation with representatives of AFSUMB, AIUM, ASUM, FLAUS and ICUS. Ultrasound Med Biol 2013;39(2):187–210. [DOI] [PubMed] [Google Scholar]
- 3.Friedrich-Rust M, Klopffleisch T, Nierhoff J, et al. Contrast-enhanced ultrasound for the differentiation of benign and malignant focal liver lesions: a meta-analysis. Liver Int 2013;33(5):739–755. [DOI] [PubMed] [Google Scholar]
- 4.Jang JY, Kim MY, Jeong SW, et al. Current consensus and guidelines of contrast enhanced ultrasound for the characterization of focal liver lesions. Clin Mol Hepatol 2013;19(1):1–16. [DOI] [PMC free article] [PubMed] [Google Scholar]
- 5.von Herbay A, Westendorff J, Gregor M. Contrast-enhanced ultrasound with SonoVue: differentiation between benign and malignant focal liver lesions in 317 patients. J Clin Ultrasound 2010;38(1):1–9. [DOI] [PubMed] [Google Scholar]
- 6.Westwood M, Joore M, Grutters J, et al. Contrast-enhanced ultrasound using SonoVue® (sulphur hexafluoride microbubbles) compared with contrast-enhanced computed tomography and contrast-enhanced magnetic resonance imaging for the characterisation of focal liver lesions and detection of liver metastases: a systematic review and cost-effectiveness analysis. Health Technol Assess 2013;17(16):1–243. [DOI] [PMC free article] [PubMed] [Google Scholar]
- 7.Ferrara K, Pollard R, Borden M. Ultrasound microbubble contrast agents: fundamentals and application to gene and drug delivery. Annu Rev Biomed Eng 2007;9:415–447. [DOI] [PubMed] [Google Scholar]
- 8.Qin S, Caskey CF, Ferrara KW. Ultrasound contrast microbubbles in imaging and therapy: physical principles and engineering. Phys Med Biol 2009;54(6):R27–R57. [DOI] [PMC free article] [PubMed] [Google Scholar]
- 9.Liver Imaging Reporting and Data System . American College of Radiology. http://www.acr.org/quality-safety/resources/LIRADS. Updated June 24, 2016. Accessed October 6, 2016.
- 10.Li W, Wang W, Liu GJ, et al. Differentiation of atypical hepatocellular carcinoma from focal nodular hyperplasia: diagnostic performance of contrast-enhanced US and microflow imaging. Radiology 2015;275(3):870–879. [DOI] [PubMed] [Google Scholar]
- 11.Sugimoto K, Shiraishi J, Tanaka H, et al. Computer-aided diagnosis for estimating the malignancy grade of hepatocellular carcinoma using contrast-enhanced ultrasound: an ROC observer study. Liver Int 2016;36(7):1026–1032. [DOI] [PubMed] [Google Scholar]
- 12.Gatos I, Tsantis S, Spiliopoulos S, et al. A new automated quantification algorithm for the detection and evaluation of focal liver lesions with contrast-enhanced ultrasound. Med Phys 2015;42(7):3948–3959. [DOI] [PubMed] [Google Scholar]
- 13.Shiraishi J, Sugimoto K, Moriyasu F, Kamiyama N, Doi K. Computer-aided diagnosis for the classification of focal liver lesions by use of contrast-enhanced ultrasonography. Med Phys 2008;35(5):1734–1746. [DOI] [PMC free article] [PubMed] [Google Scholar]
- 14.Streba CT, Ionescu M, Gheonea DI, et al. Contrast-enhanced ultrasonography parameters in neural network diagnosis of liver tumors. World J Gastroenterol 2012;18(32):4427–4434. [DOI] [PMC free article] [PubMed] [Google Scholar]
- 15.Liang X, Lin L, Cao Q, Huang R, Wang Y. Recognizing focal liver lesions in CEUS with dynamically trained latent structured models. IEEE Trans Med Imaging 2016;35(3):713–727. [DOI] [PubMed] [Google Scholar]
- 16.Ta CN, Eghtedari M, Mattrey RF, Kono Y, Kummel AC. 2-tier in-plane motion correction and out-of-plane motion filtering for contrast-enhanced ultrasound. Invest Radiol 2014;49(11):707–719. [DOI] [PMC free article] [PubMed] [Google Scholar]
- 17.Ta CN, Kono Y, Barback CV, Mattrey RF, Kummel AC. Automating tumor classification with pixel-by-pixel contrast-enhanced ultrasound perfusion kinetics. J Vac Sci Technol B Nanotechnol Microelectron 2012;30(2):2C103. [DOI] [PMC free article] [PubMed] [Google Scholar]
- 18.Rognin NG, Arditi M, Mercier L, et al. Parametric imaging for characterizing focal liver lesions in contrast-enhanced ultrasound. IEEE Trans Ultrason Ferroelectr Freq Control 2010;57(11):2503–2511. [DOI] [PubMed] [Google Scholar]
- 19.Kohavi R. A study of cross-validation and bootstrap for accuracy estimation and model selection. Proceedings of the 14th International Joint Conference on Artificial Intelligence, Montreal, Quebec, Canada. San Francisco, Calif: Morgan Kaufmann, 1995; 1137–1143. [Google Scholar]
- 20.Wu KZ, Chen X, Ding MY. Deep learning based classification of focal liver lesions with contrast-enhanced ultrasound. Optik (Stuttg) 2014;125(15):4057–4063. [Google Scholar]
- 21.Chen YW, Lin CJ. Combining SVMs with various feature selection strategies. In: Guyon I, Nikravesh M, Gunn S, Zadeh LA, eds. Feature extraction: foundations and applications. Berlin, Germany: Springer, 2006; 315–324. [Google Scholar]
- 22.Jain A, Zongker D. Feature selection: Evaluation, application, and small sample performance. IEEE Trans Pattern Anal 1997;19(2):153–158. [Google Scholar]
- 23.Chang CC, Lin CJ. LIBSVM: a library for support vector machines. ACM Trans Intel Syst Tec 2011;2(3). [Google Scholar]
- 24.Efron B. Better bootstrap confidence-intervals. J Am Stat Assoc 1987;82(397):171–185. [Google Scholar]
- 25.Glantz SA. Primer of biostatistics. 6th ed. New York, NY: McGraw-Hill Medical, 2005. [Google Scholar]
- 26.Cvancarova M, Albregtsen F, Brabrand K, Samset E. Segmentation of ultrasound images of liver tumors applying snake algorithms and GVF. Int Congr Ser 2005;1281:218–223. [Google Scholar]
- 27.Noble JA, Boukerroui D. Ultrasound image segmentation: a survey. IEEE Trans Med Imaging 2006;25(8):987–1010. [DOI] [PubMed] [Google Scholar]
- 28.Bakas S, Makris D, Sidhu PS, Chatzimichail K. Automatic identification and localisation of potential malignancies in contrast-enhanced ultrasound liver scans using spatio-temporal features. Lect Notes Comput Sci 2014;8676:13–22. [Google Scholar]
Associated Data
This section collects any data citations, data availability statements, or supplementary materials included in this article.


