

Mn-PyC3A is a newly developed manganese-based MR imaging contrast agent that produces comparable MR angiographic contrast enhancement to the commercially available gadolinium-based contrast agent gadopentetate dimeglumine in a baboon model at 3.0 T, is cleared via a mixed renal and hepatobiliary pathway, and is rapidly excreted without any observable metabolism.
Abstract
Purpose
To compare intravascular contrast enhancement produced by the manganese-based magnetic resonance (MR) imaging contrast agent manganese-N-picolyl-N,N’,N’-trans-1,2-cyclohexenediaminetriacetate (Mn-PyC3A) to gadopentetate dimeglumine (Gd-DTPA) and to evaluate the excretion, pharmacokinetics, and metabolism of Mn-PyC3A.
Materials and Methods
Contrast material–enhanced MR angiography was performed in baboons (Papio anubis; n = 4) by using Mn-PyC3A and Gd-DTPA. Dynamic imaging was performed for 60 minutes following Mn-PyC3A injection to monitor distribution and elimination. Serial blood sampling was performed to quantify manganese and gadolinium plasma clearance by using inductively coupled plasma mass spectrometry and to characterize Mn-PyC3A metabolism by using high-performance liquid chromatography. Intravascular contrast enhancement in the abdominal aorta and brachiocephalic artery was quantified by measuring contrast-to-noise ratios (CNRs) versus muscle at 9 seconds following Mn-PyC3A or Gd-DTPA injection. Plasma pharmacokinetics were modeled with a biexponential function, and data were compared with a paired t test.
Results
Aorta versus muscle CNR (mean ± standard deviation) with Mn-PyC3A and Gd-DTPA was 476 ± 77 and 538 ± 120, respectively (P = .11). Brachiocephalic artery versus muscle CNR was 524 ± 55 versus 518 ± 140, respectively (P = .95). Mn-PyC3A was eliminated via renal and hepatobiliary excretion with similar pharmacokinetics to Gd-DTPA (area under the curve between 0 and 30 minutes, 20.2 ± 3.1 and 17.0 ± 2.4, respectively; P = .23). High-performance liquid chromatography revealed no evidence of Mn-PyC3A biotransformation.
Conclusion
Mn-PyC3A enables contrast-enhanced MR angiography with comparable contrast enhancement to gadolinium-based agents and may overcome concerns regarding gadolinium-associated toxicity and retention.
© RSNA, 2017
Introduction
Gadolinium-based contrast agents (GBCAs) provide positive contrast material enhancement on magnetic resonance (MR) images to help diagnose tissue and vascular abnormalities that may be otherwise missed on nonenhanced images (1–9). Accordingly, GBCAs are an integral component of modern radiologic care. The previous decade has seen an increase in safety concerns regarding the use of GBCAs. In 2007, an association between GBCA-enhanced MR imaging and nephrogenic systemic fibrosis was observed in patients with impaired renal function (10,11). The U.S. Food and Drug Administration (FDA) issued a contraindication against three of the eight commercially available GBCAs in patients with a glomerular filtration rate of less than 30 mL/min/1.73 m2, and current American College of Radiology guidelines advise against using any GBCA in patients with a glomerular filtration rate of less than 40 mL/min/1.73 m2 (12,13). Patients with renal insufficiency can also be adversely affected by iodinated contrast agents, in some cases requiring hemodialysis (14). Consequently, patients with advanced chronic kidney disease or acute kidney injury are often denied valuable contrast-enhanced examinations.
The previous 3 years have seen the emergence of GBCA-related safety concerns in patients with normal renal function. A series of reports beginning in 2014 confirm long-term gadolinium retention in the central nervous system (CNS) and skin of patients who underwent contrast material–enhanced examinations (15–18). Moreover, in 2016, four cases of nephrogenic systemic fibrosis were reported in patients with normal renal function who had received GBCAs (19). The implications of gadolinium retention in the CNS remain unclear. The European Medicines Agency recently recommended the suspension of marketing authorizations for four GBCAs in response to the discovery of gadolinium accumulation in the CNS (20). The FDA recently released a statement to reiterate that no evidence exists of toxicity arising from gadolinium accumulation in the CNS, but also urged continued caution and restraint when ordering GBCA-enhanced examinations (21).
It is believed that nephrogenic systemic fibrosis and gadolinium accumulation in the CNS are the result of gadolinium release from the GBCA. Nephrogenic systemic fibrosis incidence and CNS accumulation are greater following exposure to the linear GBCAs, which in general are less resistant to gadolinium release than are the macrocyclic GBCAs. The three GBCAs that are contraindicated according to FDA guidelines in patients with a glomerular filtration rate of less than 30 mL/min/1.73 m2 are all in the linear class of agents, as are the four GBCAs recently recommended for market withdrawal by the European Medicines Agency. A manganese-based contrast agent manganese-N-picolyl-N,N’,N’-trans-1,2-cyclohexenediaminetriacetate (Mn-PyC3A) was reported as an alternative to GBCAs in 2015 (22). PyC3A is a hexadentate chelator that was rationally designed to complex manganese in a manner that simultaneously provides high relaxivity and is largely resistant to manganese dissociation. The PyC3A chelator is derived from a highly rigid trans-1,2-cyclohexanediamine backbone that is believed to strongly disfavor molecular transition states that lead to manganese release. For instance, Mn-PyC3A was 20 times more inert to metal ion release than was gadopentetate dimeglumine (Gd-DTPA) when challenged with an excess of zinc ions (Zn2+). PyC3A stably chelates the manganese ion (Mn2+) but leaves one site available for water to bind to the Mn2+ ion, which results in relaxivity that is comparable to that of GBCAs (R1 of 3.8 mmol · L−1 · sec−1 for Mn-PyC3A compared with 3.6 mmol · L−1 · sec−1 for gadoterate meglumine (Gd-DOTA) and 4.1 mmol · L−1 · sec−1 for Gd-DTPA in blood plasma, 37°C, 1.5 T [22,23]). Mn-PyC3A also possesses an aromatic pyridine ring that promotes partial hepatobiliary clearance, a feature that may be important in patients with impaired renal function. Contrast-enhanced MR imaging in mice showed fast blood clearance, mixed renal and hepatobiliary elimination, and complete excretion of injected manganese when measured at 24 hours after injection.
In our study, to test the hypothesis that Mn-PyC3A could serve as a viable replacement for GBCA, MR angiography with both Mn-PyC3A and Gd-DTPA was performed in nonhuman primates with a 3.0-T clinical imager. The purpose of our study was to compare the intravascular contrast enhancement produced by the manganese-based MR imaging contrast agent Mn-PyC3A to that of Gd-DTPA and to evaluate the excretion, pharmacokinetics, and metabolism of Mn-PyC3A.
Materials and Methods
E.M.G. and P.C. are cofounders of Reveal Pharmaceuticals (which has a licensing agreement for the patents covering Mn-PyC3A) and hold greater than 5% equity in the company. The authors had control of the data and the information submitted for publication. All experiments were performed in accordance with the National Institutes of Health’s Guide for the Care and Use of Laboratory Animals, 8th Edition, and were approved by the institutional animal care and use committee of Massachusetts General Hospital. Synthesis of Na(Mn-PyC3A) was prepared by using a previously reported protocol (22). Gd-DTPA (Bayer, Whippany, NJ) was diluted to 0.25 M by using sterile water.
Experimental Protocol
Two female baboons (Papio anubis; weight, 14.2 kg and 17.4 kg) were included in our study (n = 2). Each animal underwent two imaging sessions on two separate days (four total injections per compound). Animals were fasted for 12 hours prior to the study. Anesthesia was induced with intramuscular ketamine (10 mg/kg) and xylazine (0.4 mg/kg) and maintained with 1%–1.5% isoflurane. A dose of intramuscular yobine (0.11 mg/kg) was given prior to imaging to reverse the effects of ketamine and xylazine. Bilateral saphenous veins were cannulated for contrast agent delivery and blood draw, respectively, and the animals were transferred to a cradle customized for the imaging studies. Contrast agents were formulated at 0.25 M. Animals were imaged prior to, during, and following contrast agent injection for a total period of 60 minutes following Mn-PyC3A injection and 30 minutes following Gd-DTPA injection. End-tidal carbon dioxide, oxygen saturation, heart rate, and respiration rate were monitored continuously during the course of the imaging. Serial blood draws were performed throughout the course of the imaging experiment, and a sample of the first urine passed following the imaging study (>100 minutes after Mn-PyC3A injection) was collected for analysis.
MR Imaging Protocol
MR imaging data were acquired with a 3.0-T clinical whole-body MR imager (Siemens Biograph mMR; Erlangen, Germany) by using a three-dimensional free-breathing coronal T1-weighted single gradient-echo sequence with the following parameters: repetition time msec/echo time msec, 4.32/1.42; flip angle, 25°; field of view, 480 mm; phase field of view, 78.1% (in-plane resolution, 1.4 mm × 1.1 mm); section thickness, 1.5 mm; and number of sections, 64. After baseline imaging, Mn-PyC3A (0.1 mmol/kg, 1.5 mL/sec injection rate) was administered, and imaging was repeated in a dynamic fashion for 60 minutes. Then Gd-DTPA was injected at the same dose, injection volume, and injection rate, and the animal was imaged for another 30 minutes.
Image Analysis
MR images were analyzed by using open-source software (OsiriX; https://www.osirix-viewer.com). Regions of interest were drawn in the abdominal aorta directly below the renal arteries, brachiocephalic artery, psoas muscle, pectoralis muscle, kidneys, and liver and signal intensity was quantified. Visual assessment of the origins and proximal course of the branch vessels of the thoracic aorta was performed by a reader with 18 years of clinical experience (D.E.S.). Noise was quantified as the standard deviation of the signal measured in the air outside of the animal (SDair). Contrast-to-noise ratio (CNR) was calculated from the difference in signal intensity (SI) between the artery (abdominal aorta, brachiocephalic artery) (SIartery) and adjacent muscle (SImuscle) according to the following equation: CNR = (SIartery − SImuscle)/SDair. Signal-to-noise ratio (SNR) was calculated by using the following equation: SI/SDair. Normalized SNR was calculated by taking the SNR after contrast agent injection and dividing it by the SNR prior to injection.
Relaxivity of Contrast Agents
Relaxivity measurements for Mn-PyC3A and Gd-DTPA in human plasma at 3.0 T and 37°C were performed by using a clinical imager (Siemens Skyra; Erlangen, Germany). Relaxivity was determined by plotting R1 as a function of agent concentration from 0.15–0.60 mmol/L. R1 was measured on phantoms encased in a 37°C thermal jacket by using an inversion-recovery spin-echo sequence with nine recovery times varying between 50 msec and 3000 msec.
Blood Plasma and Urine Analysis
Manganese and gadolinium content in plasma were determined by using an inductively coupled plasma mass spectrometry system (Agilent 8800-QQQ; Santa Clara, Calif). The plasma samples were diluted with 0.1% Triton X-100 in 5% nitric acid. A linear calibration curve for each metal ranging from 0.1 ppb to 200 ppb was generated daily for the quantification. Plasma manganese and gadolinium clearance data were fit to a biexponential model: Cp (t) = Aexp (−αt) + Bexp (−βt), where Cp (t) is plasma metal concentration at time t, α and β are the distribution and elimination rates, respectively, and A and B are the distribution and elimination coefficients, respectively. Area under the curve was estimated by integrating the clearance data between 0–t, and Cp (0) was estimated from the sum of A + B. Blood plasma and urine were also analyzed by using high-performance liquid chromatography interfaced to the inductively coupled plasma mass spectrometry system as a detector.
Statistical Analysis
Comparisons of CNR and pharmacokinetic parameters between Mn-PyC3A and Gd-DTPA were performed by using a two-sided paired t test. P values less than .05 were considered to indicate statistical significance (GraphPad Prism; https://www.graphpad.com/scientific-software/prism).
Results
Relaxivity Measurements
The measured T1 relaxivities of Mn-PyC3A and Gd-DTPA in human blood plasma at 3.0 T and 37°C were 3.4 mmol · L−1 · sec−1 ± 0.03 and 4.2 mmol · L−1 · sec−1 ± 0.38, respectively.
MR Imaging
Both contrast agents produced strong intravascular contrast enhancement. The abdominal aorta and renal arteries were well delineated with both Mn-PyC3A and Gd-DTPA during their arterial phase (Fig 1). The abdominal aorta versus adjacent muscle CNR was 476 ± 77 (mean ± standard deviation) for Mn-PyC3A and 538 ± 120 for Gd-DTPA (P = .11; Table 1). Likewise, Figure 2 shows an axial view of the branch vessels of the aortic arch prior to and 9 seconds after the injection of Mn-PyC3A or Gd-DTPA, respectively. The brachiocephalic artery versus adjacent muscle CNR was 524 ± 55 for Mn-PyC3A and 518 ± 140 for Gd-DTPA (P = .95; Table 1). All branch vessels were observed with both agents. CNR values for Mn-PyC3A and Gd-DTPA in the abdominal aorta and brachiocephalic artery are tabulated in Table 1 and demonstrate comparable enhancement between the two agents in their MR angiographic properties.
Figure 1:

Multiplanar reformatted coronal images from three-dimensional T1-weighted gradient-echo (volume-interpolated breath-hold examination) sequence acquired at 3.0 T show abdominal aorta and renal arteries, A, prior to injection of contrast agent, B, 9 seconds after injection of 0.1 mmol/kg Mn-PyC3A, and, C, 9 seconds after injection of 0.1 mmol/kg Gd-DTPA.
Table 1.
Comparison of CNR 9 Seconds after Injection of Mn-PyC3A versus Gd-DTPA Demonstrates a Similar Degree of Intravascular Contrast Enhancement
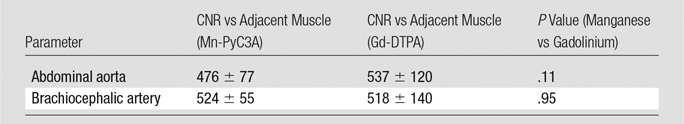
Note.—Data are means ± standard deviation.
Figure 2:

Axial T1-weighted images show branch arteries of thoracic aorta, A, 9 seconds after injection of Mn-PyC3A and, B, 9 seconds after injection of Gd-DTPA. Images were acquired at, C, level of green line intersecting the coronal thoracic image.
Dynamic MR imaging showed that Mn-PyC3A undergoes mixed renal and hepatobiliary clearance. Figure 3, A–D, are multiplanar reformatted images of the kidneys prior to, 9 seconds, 20 minutes, and 40 minutes after Mn-PyC3A injection. There was immediate strong enhancement of the kidneys and ureters following Mn-PyC3A injection, which diminished with time. Figure 3, E–H, are multiplanar reformatted images of the liver and biliary tree. Hepatic enhancement was delayed but increased after 2 minutes (liver-to-muscle CNRs prior to and 2 minutes following Mn-PyC3A injection were 9.0 ± 8.2 and 67.2 ± 15.4, respectively) and then remained largely unchanged throughout the course of the imaging experiment. Biliary enhancement was apparent at 20 minutes after injection and increased with time. Figure 3, I–K, depict the normalized SNR in the blood, kidney, and liver as a function of time following Mn-PyC3A injection. The blood and kidneys were strongly enhanced immediately after injection, after which normalized SNR decreased biexponentially. The time course of blood and kidney signal enhancement following Mn-PyC3A injection was similar to that observed following Gd-DTPA injection (Fig E1 [online]).
Figure 3:

Pharmacokinetics and elimination of Mn-PyC3A via kidneys (top row) and liver (second row). Multiplanar reformatted serial images in top and middle panels show, A–D, urogenital system and, E–H, liver, respectively. Images were acquired, A, E, before Mn-PyC3A injection and, B, F, at 9 seconds, C, G, at 20 minutes, and, D, H, at 40 minutes after injection. A–D, Images depict kidneys, abdominal aorta, renal arteries, and ureters (arrows). Rapid renal filtration is evidenced by strong renal enhancement 9 seconds after injection and by limited enhancement at 20 minutes. Clearance into urine is also evident by signal enhancement in ureter. E–H, Images depict liver, common bile duct (white arrowhead), and duodenum (black arrowhead). Hepatobiliary clearance is evident by delayed liver enhancement and biliary excretion starting at 20 minutes. I–K, Graphs show normalized SNR (nSNR) time course in blood, kidney, and liver, respectively, that was recorded out to 60 minutes after Mn-PyC3A injection. Solid lines are biexponential fits to the data.
Pharmacokinetics
Table 2 shows the pharmacokinetic parameters estimated from the Mn-PyC3A and Gd-DTPA plasma clearance data. For Mn-PyC3A, the compound exhibits a biexponential clearance typical of extracellular contrast agents with a half-life of distribution of 1.2 minutes ± 0.3 and a half-life of elimination of 40.1 minutes ± 3.2. Because blood sampling following Gd-DTPA injection was only performed for 30 minutes, a reliable estimation of the elimination half-life of Gd-DTPA could not be obtained. The agents exhibit similar plasma clearance profiles during the window of 0–30 minutes available for comparison (Fig E2 [online]). The area under the curve between 0 and 30 minutes calculated from the Mn-PyC3A and Gd-DTPA plasma clearance data are nearly identical (20.2 ± 3.1 vs 17.0 ± 2.4, respectively; P = .23) and indicate that the two agents distribute and are eliminated from the blood with similar pharmacokinetics.
Table 2.
Distribution and Elimination Half-Lives and AUC0–30 Recorded for Injection of 0.1 mmol/kg Mn-PyC3A and Gd-DTPA
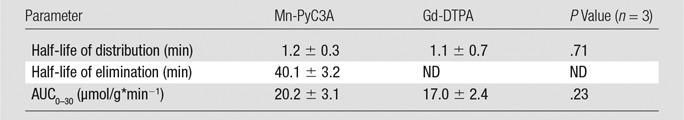
Note.—Data are means ± standard deviation. AUC0–30 = area under the curve between 0 and 30 minutes. ND = not determined because of insufficient data.
Metabolism
Mn-PyC3A exists as a mixture of two interconvertible diastereomers in solution that arise from the manner in which the ligand wraps about the manganese ion (22). These isomers, found in an equilibrium ratio of 1:13, can be separated by high-performance liquid chromatography and are shown in Figure 4, A, with retention times of 7.5 minutes and 8.3 minutes, respectively. In plasma, the only manganese-containing species present after Mn-PyC3A injection are the two Mn-PyC3A isomers (Fig 4, B) and both isomers clear from the plasma at the same rate. Figure 4, C, shows high-performance liquid chromatography traces of the first urine passed after the imaging experiment, which occurred more than 100 minutes after Mn-PyC3A injection. As in the serum, the only manganese species present are the Mn-PyC3A isomers.
Figure 4:

High-performance liquid chromatography with inductively coupled plasma mass spectrometry to detect traces of manganese in blood plasma and urine following Mn-PyC3A injection reveal no evidence of metabolism. A, Trace recorded from solution of injected material; the species eluting at 7.3 minutes and 8.5 minutes are the two interconvertible diastereomers of Mn-PyC3A. B, Traces recorded from blood plasma drawn at 0, 1, 2, 5, 10, 15, 30, 45, and 60 minutes (front to back) after Mn-PyC3A injection. C, Trace recorded from urine collected after imaging experiment (>100 minutes after injection). Mn-PyC3A is the only manganese-containing species identified in the blood and urine.
Discussion
Our imaging and pharmacokinetics data support the hypothesis that Mn-PyC3A is a potentially viable alternative to GBCAs. The relaxivity of Mn-PyC3A is comparable to that of the commercially available GBCA Gd-DTPA, and MR angiography demonstrated that Mn-PyC3A performs comparably to Gd-DTPA for blood vessel imaging. Dynamic imaging of the abdomen revealed rapid blood clearance and mixed renal and hepatobiliary elimination of Mn-PyC3A. The imaging study was performed at 3.0 T, but the plasma relaxivity of Mn-PyC3A at lower field (3.8 mmol · L−1 · sec−1 at 1.4 T, 37°C) is also similar to relaxivities of most GBCAs at 1.5 T (22,23). We anticipate that Mn-PyC3A will perform similarly to GBCAs at the lower field strength as well. Indeed, the relaxivity of Mn-PyC3A is within 10% of the reported plasma relaxivities of gadopentetate, gadoteridol, and gadoterate at 1.5 T and 3.0 T (23).
The pharmacokinetic behavior of Mn-PyC3A is consistent with an extracellular distribution, which is expected for a small, hydrophilic, anionic chelate. Ex vivo analysis of blood and urine collected following Mn-PyC3A injection strongly suggest that Mn-PyC3A does not undergo significant dissociation, but is rather excreted intact. Only intact Mn-PyC3A was detected in blood and urine. Free, dissociated Mn2+ is known to accumulate in the myocardium and pancreas in addition to hepatobiliary uptake (24–27). Dynamic MR imaging showed that Mn-PyC3A is transported through the liver and into the bile. However, there was no persistent contrast enhancement of the myocardium or of the pancreas, which suggests that it is intact Mn-PyC3A and not free Mn2+ that is being taken up by hepatocytes. The absence of observable metabolism or dissociation indicates that the dynamics of signal change following Mn-PyC3A injection will solely reflect contrast agent distribution and further supports interchangeability between Mn-PyC3A and GBCAs. In the context of renal insufficiency, the hepatobiliary clearance may prove valuable in eliminating the contrast agent.
There is already precedence for the safe and effective use of manganese-based contrast agents. The contrast agent manganese dipyridoxyl diphosphate has an FDA indication for imaging liver lesions, although the product is discontinued (28–31). Manganese dipyridoxyl diphosphate is dissociated on injection, releasing free manganese into the bloodstream (32) that is then rapidly taken up by the liver, pancreas, and myocardium. The dipyridoxyl diphosphate chelator recovered from the urine is near completely stripped of manganese (32). Despite functioning by releasing free Mn2+ ion, manganese dipyridoxyl diphosphate has been used safely in tens of thousands of patients. Because Mn-PyC3A is rapidly eliminated and is highly resistant to manganese release, it is reasonable to anticipate that any potential free Mn2+ exposure resulting from intravenous injection of 0.1 mmol/kg Mn-PyC3A will lie within the threshold of manganese tolerability.
There were some limitations to our study. Although comparable MR angiographic contrast enhancement is observed between Mn-PyC3A and Gd-DTPA, the study was not sufficiently powered to demonstrate equivalency. Another limitation arose from the fact that the animals were not sacrificed after the imaging study, and thus quantitative manganese biodistribution data are unavailable. Additionally, the experimental design did not allow quantification of Mn-PyC3A fractional excretion in the urine and feces. The experimental design also lacked a means to examine whether Mn-PyC3A excreted via hepatobiliary path undergoes biotransformation. Despite these limitations, the comparable contrast enhancement observed between Gd-DTPA and MnPyC3A, the mixed renal and hepatobiliary clearance, the rapid elimination, and the metabolic stability of Mn-PyC3A together support the hypothesis that Mn-PyC3A is a potentially viable alternative to GBCAs in MR angiography.
The results of our study indicate further evaluation of Mn-PyC3A as an alternative to GBCAs. The molecular size and pharmacokinetics of Mn-PyC3A suggest that it will also be effective in detecting pathologies with enhanced endothelial permeability and extracellular volume, such as tumors. The hepatobiliary elimination of Mn-PyC3A may also prove useful for detection of liver pathologies by using delayed-phase liver imaging. Future work should address the ability of Mn-PyC3A to function comparably to GBCAs in other disease-state models. In parallel, a detailed study of the preclinical safety of Mn-PyC3A is warranted to advance this compound to clinical evaluation.
In summary, Mn-PyC3A is a newly developed manganese-based MR imaging contrast agent that produces MR angiographic contrast enhancement comparable to that of the commercially available GBCA Gd-DTPA in a baboon model at 3.0 T, is cleared via a mixed renal and hepatobiliary pathway, and is rapidly excreted without any observable metabolism.
Advances in Knowledge
■ The manganese-based contrast agent Mn-PyC3A produces intravascular contrast enhancement that is comparable to that of the commercially available gadolinium-based contrast agent gadopentetate dimeglumine (Gd-DTPA) in a nonhuman primate model.
■ Mn-PyC3A is cleared via both renal and hepatobiliary excretion and is eliminated from blood plasma with comparable pharmacokinetics to Gd-DTPA.
■ High-performance liquid chromatography examination of blood plasma and urine reveals that Mn-PyC3A is cleared intact without undergoing metabolism or degradation.
Implication for Patient Care
■ Mn-PyC3A may enable contrast-enhanced MR angiography in patients with renal insufficiency who are currently contraindicated for gadolinium-based contrast agents.
SUPPLEMENTAL FIGURES
Received April 28, 2017; revision requested June 21; revision received July 17; accepted July 29; final version accepted September 7.
Supported by National Center for Research Resources (P41RR14075, S10RR023385); National Heart, Lung, and Blood Institute (K25HL128899, U54HL119145); National Institute of Biomedical Imaging and Bioengineering (R01EB009062, R21EB022804); National Institutes of Health Office of the Director (S10OD010650).
Disclosures of Conflicts of Interest: E.M.G. Activities related to the present article: disclosed no relevant relationships. Activities not related to the present article: is founder and holds stock in Reveal Pharmaceuticals. Other relationships: has two patents pending. H.Y.W. disclosed no relevant relationships. I.R. disclosed no relevant relationships. Y.F.Y. disclosed no relevant relationships. D.E.S. disclosed no relevant relationships. P.C. Activities related to the present article: disclosed no relevant relationships. Activities not related to the present article: reports consultancies for Guerbet and Collagen Medical; grant money paid to institution by Pfizer; is founder and holds stock in Collagen Medical and Reveal Pharmaceuticals. Other relationships: disclosed no relevant relationships.
Abbreviations:
- CNR
- contrast-to-noise ratio
- CNS
- central nervous system
- FDA
- Food and Drug Administration
- GBCA
- gadolinium-based contrast agent
- Gd-DTPA
- gadopentetate dimeglumine
- Mn-PyC3A
- manganese-N-picolyl-N,N’,N’-trans-1,2-cyclohexenediaminetriacetate
- SNR
- signal-to-noise ratio
References
- 1.Moon M, Cornfeld D, Weinreb J. Dynamic contrast-enhanced breast MR imaging. Magn Reson Imaging Clin N Am 2009;17(2):351–362. [DOI] [PubMed] [Google Scholar]
- 2.Essig M, Dinkel J, Gutierrez JE. Use of contrast media in neuroimaging. Magn Reson Imaging Clin N Am 2012;20(4):633–648. [DOI] [PubMed] [Google Scholar]
- 3.Yang S, Law M, Zagzag D, et al. Dynamic contrast-enhanced perfusion MR imaging measurements of endothelial permeability: differentiation between atypical and typical meningiomas. AJNR Am J Neuroradiol 2003;24(8):1554–1559. [PMC free article] [PubMed] [Google Scholar]
- 4.Chandra T, Pukenas B, Mohan S, Melhem E. Contrast-enhanced magnetic resonance angiography. Magn Reson Imaging Clin N Am 2012;20(4):687–698. [DOI] [PubMed] [Google Scholar]
- 5.Leiner T, Michaely H. Advances in contrast-enhanced MR angiography of the renal arteries. Magn Reson Imaging Clin N Am 2008;16(4):561–572, vii. [DOI] [PubMed] [Google Scholar]
- 6.Keston P, Murray AD, Jackson A. Cerebral perfusion imaging using contrast-enhanced MRI. Clin Radiol 2003;58(7):505–513. [DOI] [PubMed] [Google Scholar]
- 7.Lima JAC. Myocardial viability assessment by contrast-enhanced magnetic resonance imaging. J Am Coll Cardiol 2003;42(5):902–904. [DOI] [PubMed] [Google Scholar]
- 8.Catalano OA, Manfredi R, Vanzulli A, et al. MR arthrography of the glenohumeral joint: modified posterior approach without imaging guidance. Radiology 2007;242(2):550–554. [DOI] [PubMed] [Google Scholar]
- 9.Andreisek G, Duc SR, Froehlich JM, Hodler J, Weishaupt D. MR arthrography of the shoulder, hip, and wrist: evaluation of contrast dynamics and image quality with increasing injection-to-imaging time. AJR Am J Roentgenol 2007;188(4):1081–1088. [DOI] [PubMed] [Google Scholar]
- 10.Grobner T. Gadolinium—a specific trigger for the development of nephrogenic fibrosing dermopathy and nephrogenic systemic fibrosis? Nephrol Dial Transplant 2006;21(4):1104–1108. [DOI] [PubMed] [Google Scholar]
- 11.Marckmann P, Skov L, Rossen K, et al. Nephrogenic systemic fibrosis: suspected causative role of gadodiamide used for contrast-enhanced magnetic resonance imaging. J Am Soc Nephrol 2006;17(9):2359–2362. [DOI] [PubMed] [Google Scholar]
- 12.Yang L, Krefting I, Gorovets A, et al. Nephrogenic systemic fibrosis and class labeling of gadolinium-based contrast agents by the Food and Drug Administration. Radiology 2012;265(1):248–253. [DOI] [PubMed] [Google Scholar]
- 13.American College of Radiology . ACR manual on contrast media v10.1. Reston, Va: American College of Radiology, 2015; 83–92. [Google Scholar]
- 14.Solomon RJ, Natarajan MK, Doucet S, et al. Cardiac Angiography in Renally Impaired Patients (CARE) study: a randomized double-blind trial of contrast-induced nephropathy in patients with chronic kidney disease. Circulation 2007;115(25):3189–3196. [DOI] [PubMed] [Google Scholar]
- 15.Kanda T, Fukusato T, Matsuda M, et al. Gadolinium-based contrast agent accumulates in the brain even in subjects without severe renal dysfunction: evaluation of autopsy brain specimens with inductively coupled plasma mass spectroscopy. Radiology 2015;276(1):228–232. [DOI] [PubMed] [Google Scholar]
- 16.Kanda T, Ishii K, Kawaguchi H, Kitajima K, Takenaka D. High signal intensity in the dentate nucleus and globus pallidus on unenhanced T1-weighted MR images: relationship with increasing cumulative dose of a gadolinium-based contrast material. Radiology 2014;270(3):834–841. [DOI] [PubMed] [Google Scholar]
- 17.McDonald RJ, McDonald JS, Kallmes DF, et al. Intracranial gadolinium deposition after contrast-enhanced MR imaging. Radiology 2015;275(3):772–782. [DOI] [PubMed] [Google Scholar]
- 18.Roberts DR, Lindhorst SM, Welsh CT, et al. High levels of gadolinium deposition in the skin of a patient with normal renal function. Invest Radiol 2016;51(5):280–289. [DOI] [PubMed] [Google Scholar]
- 19.Semelka RC, Commander CW, Jay M, Burke LMB, Ramalho M. Presumed gadolinium toxicity in subjects with normal renal function: a report of 4 cases. Invest Radiol 2016;51(10):661–665. [DOI] [PubMed] [Google Scholar]
- 20.European Medicines Agency . PRAC concludes assessment of gadolinium agents used in body scans and recommends regulatory action, including suspension for some marketing authorisations. https://www.ema.europa.eu/docs/en_GB/document_library/Press_release/2017/03/WC500223209.pdf. Published March 10, 2017. Accessed April 10, 2017.
- 21.U.S. Food and Drug Administration . FDA identifies no harmful effects to date with brain retention of gadolinium-based contrast agents for MRIs; review to continue. https://www.fda.gov/Drugs/DrugSafety/ucm559007.htm. Published May 22, 2017. Last updated June 5, 2017. Accessed April 10, 2017.
- 22.Gale EM, Atanasova IP, Blasi F, Ay I, Caravan P. A manganese alternative to gadolinium for MRI contrast. J Am Chem Soc 2015;137(49):15548–15557. [DOI] [PMC free article] [PubMed] [Google Scholar]
- 23.Rohrer M, Bauer H, Mintorovitch J, Requardt M, Weinmann HJ. Comparison of magnetic properties of MRI contrast media solutions at different magnetic field strengths. Invest Radiol 2005;40(11):715–724. [DOI] [PubMed] [Google Scholar]
- 24.Ni Y, Petré C, Bosmans H, et al. Comparison of manganese biodistribution and MR contrast enhancement in rats after intravenous injection of MnDPDP and MnCl2. Acta Radiol 1997;38(4 Pt 2):700–707. [DOI] [PubMed] [Google Scholar]
- 25.Storey P, Danias PG, Post M, et al. Preliminary evaluation of EVP 1001-1: a new cardiac-specific magnetic resonance contrast agent with kinetics suitable for steady-state imaging of the ischemic heart. Invest Radiol 2003;38(10):642–652. [DOI] [PubMed] [Google Scholar]
- 26.Antkowiak PF, Tersey SA, Carter JD, et al. Noninvasive assessment of pancreatic beta-cell function in vivo with manganese-enhanced magnetic resonance imaging. Am J Physiol Endocrinol Metab 2009;296(3):E573–E578. [DOI] [PMC free article] [PubMed] [Google Scholar]
- 27.Antkowiak PF, Stevens BK, Nunemaker CS, McDuffie M, Epstein FH. Manganese-enhanced magnetic resonance imaging detects declining pancreatic β-cell mass in a cyclophosphamide-accelerated mouse model of type 1 diabetes. Diabetes 2013;62(1):44–48. [DOI] [PMC free article] [PubMed] [Google Scholar]
- 28.Elizondo G, Fretz CJ, Stark DD, et al. Preclinical evaluation of MnDPDP: new paramagnetic hepatobiliary contrast agent for MR imaging. Radiology 1991;178(1):73–78. [DOI] [PubMed] [Google Scholar]
- 29.Hamm B, Vogl TJ, Branding G, et al. Focal liver lesions: MR imaging with Mn-DPDP—initial clinical results in 40 patients. Radiology 1992;182(1):167–174. [DOI] [PubMed] [Google Scholar]
- 30.Jung G, Heindel W, Krahe T, et al. Influence of the hepatobiliary contrast agent mangafodipir trisodium (MN-DPDP) on the imaging properties of abdominal organs. Magn Reson Imaging 1998;16(8):925–931. [DOI] [PubMed] [Google Scholar]
- 31.Vogl TJ, Hamm B, Schnell B, et al. Mn-DPDP enhancement patterns of hepatocellular lesions on MR images. J Magn Reson Imaging 1993;3(1):51–58. [DOI] [PubMed] [Google Scholar]
- 32.Toft KG, Hustvedt SO, Grant D, et al. Metabolism and pharmacokinetics of MnDPDP in man. Acta Radiol 1997;38(4 Pt 2):677–689. [DOI] [PubMed] [Google Scholar]
Associated Data
This section collects any data citations, data availability statements, or supplementary materials included in this article.