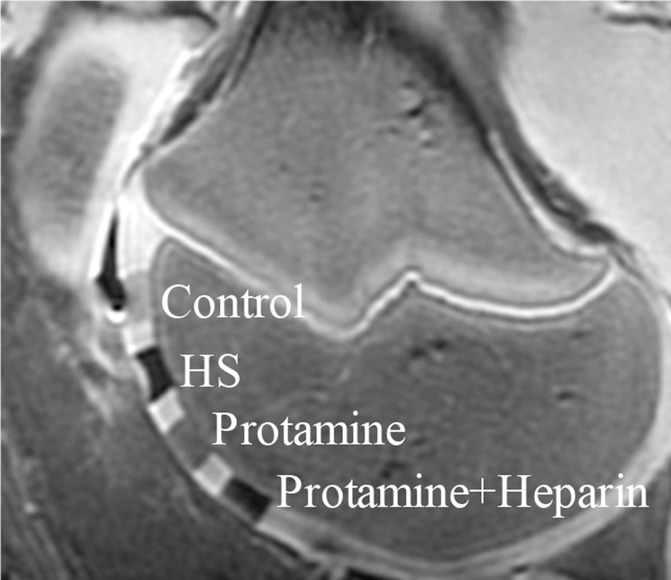
Figure 5e:
In vitro and ex vivo MR signal of labeled and unlabeled hMSCs at 3.0 T. (a) Axial T2-weighted MR image of 2 × 10⁶ hMSCs in test tubes with 50 μL Ficoll. Unlabeled control cells show positive (bright) T2 signal, while cells labeled with ferumoxytol in FBS, HS, and StemPro media show negative (dark) T2 signal. (b) Corresponding T2 relaxation times show significant T2 shortening in hMSCs labeled with ferumoxytol in HS-containing media compared with FBS and StemPro media, as well as protamine and protamine plus heparin transfection media. Data are displayed as mean data of three experiments in each group with standard errors. (c) Representative sagittal MR image of unlabeled hMSCs and hMSCs with ferumoxytol in FBS, HS, and StemPro media, seeded in an agarose scaffold and implanted in cartilage defects of a pig femur. (d) Corresponding T2 relaxation times of unlabeled (Ctrl) and labeled hMSCs implants. (e) Representative sagittal MR image of unlabeled hMSCs and hMSCs labeled with ferumoxytol in HS, protamine, and protamine plus heparin media, seeded in an agarose scaffold and implanted in cartilage defects of a pig femur.

