

US and MR elastographic techniques have developed into accurate methods for quantitative, noninvasive diagnosis of liver fibrosis in a wide range of etiologies; however, interpretation of results should take into account potential confounding factors, pitfalls, and technical limitations.
Abstract
Chronic liver diseases often result in the development of liver fibrosis and ultimately, cirrhosis. Treatment strategies and prognosis differ greatly depending on the severity of liver fibrosis, thus liver fibrosis staging is clinically relevant. Traditionally, liver biopsy has been the method of choice for fibrosis evaluation. Because of liver biopsy limitations, noninvasive methods have become a key research interest in the field. Elastography enables the noninvasive measurement of tissue mechanical properties through observation of shear-wave propagation in the tissue of interest. Increasing fibrosis stage is associated with increased liver stiffness, providing a discriminatory feature that can be exploited by elastographic methods. Ultrasonographic (US) and magnetic resonance (MR) imaging elastographic methods are commercially available, each with their respective strengths and limitations. Here, the authors review the technical basis, acquisition techniques, and results and limitations of US- and MR-based elastography techniques. Diagnostic performance in the most common etiologies of chronic liver disease will be presented. Reliability, reproducibility, failure rate, and emerging advances will be discussed.
© RSNA, 2018
Learning Objectives:
After reading the article and taking the test, the reader will be able to:
■ Describe the basic principles of elastography methods
■ Describe the current performance of elastography in liver disease
■ Identify pitfalls and confounders of liver stiffness measurements using US and MR imaging
Accreditation and Designation Statement
The RSNA is accredited by the Accreditation Council for Continuing Medical Education (ACCME) to provide continuing medical education for physicians. The RSNA designates this journal-based SA-CME activity for a maximum of 1.0 AMA PRA Category 1 Credit™. Physicians should claim only the credit commensurate with the extent of their participation in the activity.
Disclosure Statement
The ACCME requires that the RSNA, as an accredited provider of CME, obtain signed disclosure statements from the authors, editors, and reviewers for this activity. For this journal-based CME activity, author disclosures are listed at the end of this article.
Introduction
Chronic liver diseases are a major cause of morbidity and mortality in the United States and worldwide. The most prevalent etiologies of chronic liver diseases include chronic hepatitis B virus (HBV) infection, chronic hepatitis C virus (HCV) infection, nonalcoholic fatty liver disease (NAFLD), and alcohol abuse (1). In the United States, chronic liver diseases affect approximately 360 per 100 000 persons and are the 12th leading cause of death, with an estimated mortality of 12 deaths per 100 000 persons (2,3) and a projected financial burden exceeding $100 billion annually, mostly from NAFLD and chronic HCV infection (4,5). Chronic liver diseases can lead to liver fibrosis, which is the result of chronic liver injury (6). The end-stage of liver fibrosis is cirrhosis, which has potential complications including portal hypertension, liver failure, and hepatocellular carcinoma (HCC). There is evidence that when the underlying cause is removed, liver fibrosis may regress or stabilize (7). Accurate staging of liver fibrosis may be beneficial in monitoring treatment efficacy, disease progression, and in establishing prognosis.
Until recently, liver fibrosis was primarily assessed with liver biopsy, which is the reference standard for staging of liver fibrosis and grading of necroinflammatory changes, by using various semiquantitative scoring systems (8–15). The most commonly used scoring systems include the METAVIR score in chronic HBV or HCV infections and the Brunt score in nonalcoholic steatohepatitis (NASH) (8,9). All scoring systems (except the Ishak score) range from F0 to F4, where F0 indicates no fibrosis; F1, mild fibrosis; F2, moderate fibrosis; F3, advanced fibrosis, and F4, cirrhosis. Despite its strengths, liver biopsy has several drawbacks: liver biopsy is relatively invasive and associated with a low rate of complications (approximately 3%) such as pain and bleeding, which reduce patient acceptance and limit its suitability for repeated measurements and disease monitoring. Also, biopsy enables the analysis of only a small portion of the liver, about 1/50 000th of the total parenchyma, introducing sampling variability and possible diagnostic errors (16,17). Inter- and intraobserver variability have also been suggested as limitations to biopsy, which may be linked to the inconsistency in the definition of some pathologic features (8,16,18). Finally, liver biopsy lacks dynamic information about the speed of disease progression. All of these limitations make liver biopsy an imperfect reference standard. An important ramification of these limitations is the difficulty in validating noninvasive tests with use of biopsy as the reference standard, as the inherent flaws of biopsy can cause misinterpretation of results.
Alternative, noninvasive methods of evaluating liver health are being developed, such as serum markers and ultrasonographically (US) and magnetic resonance (MR) imaging–based elastography. Serum markers include simple markers—such as platelet count, aspartate aminotransferase-to-platelet radio index, or APRI (19), FIB-4 (20)—and more complex, patented composite scores, such as FibroTest/FibroSure (BioPredictive, Paris, France) (21), the enhanced liver fibrosis, or ELF (Siemens Healthineers, Erlangen, Germany), test (22), and FibroMeter (Echosens, Paris, France) (23). Though simple to perform, these tests have limited accuracy in intermediate levels of fibrosis (24), and they are generally considered less accurate than elastographic methods (25).
Principles of Elastography
Elastography, first coined by Ophir et al (26), describes the noninvasive assessment of tissue mechanical properties such as elasticity, which describes the resistance to deformation of a tissue to an applied stress. In quantitative elastography methods, the stress is applied via shear-wave propagation, generated transiently, for example, via single mechanical impulse, or dynamically, for example, via continuous application of acoustic waves. US and MR elastographic methods are available clinically and are summarized in Figure 1 and Table 1. A more comprehensive overview of the elastographic methods to be reviewed is included in the Appendix E1 (online).
Figure 1:

Illustrations of US elastography techniques, including TE (FibroScan, Echosens), pSWE (Virtual Touch Quantification, Siemens Acuson S2000), 2D SWE (Aixplorer, Supersonic Imagine), and MR elastography. Sampling area for each method is depicted by enclosed green area. TE and pSWE have a fixed sampling area size, though pSWE allows the depth and location to be chosen. Two-dimensional SWE has the ability of pSWE sampling area placement with the additional ability to change the size. MR elastography offers (near) full organ coverage. Corresponding example images for each method are also shown. TE = transient elastography, pSWE = point shear-wave elastography, 2D SWE = two-dimensional shear-wave elastography.
Table 1.
Comparison of Quantitative Elastography Methods
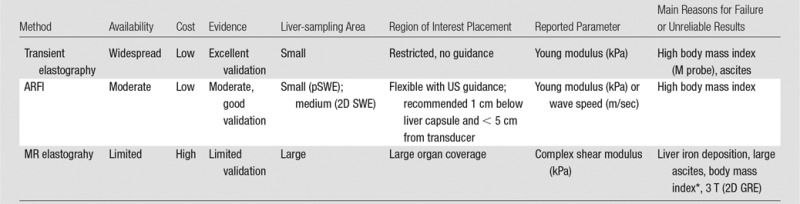
Note.— ARFI = acoustic radiation force impulse, GRE = gradient recalled echo, pSWE = point shear-wave elastography, SWE = shear-wave elastography, 2D = two-dimensional.
*Conflicting evidence reported regarding MR elastography failure in patients with high body mass index.
Quantitative US elastography methods include transient elastography (TE) and acoustic radiation force impulse (ARFI) techniques such as point shear-wave elastography (pSWE) and two-dimensional (2D) shear-wave elastography (SWE). The FibroScan system (Echosens, Paris, France) was the first commercially available TE system, introduced in Europe in 2003 and approved in the United States by the Food and Drug Administration in 2013. The FibroScan probe delivers a 50-Hz mechanical impulse to the skin surface and then measures the velocity of the generated shear wave (Figs 1, 2). There are several probes available, with the M probe being used for standard examinations and the XL probe introduced to increase the reliability of TE measurements in overweight patients. The XL probe records the measurement at a greater depth than does the M probe (35–75 mm vs 25–65 mm), with a lower operating frequency (2.5 MHz vs 3.5 MHz). ARFI elastography techniques use focused US “push” pulses to deform internal tissue and generate shear waves (27). The nomenclature for ARFI elastography in the literature is not standardized. Though pSWE and 2D SWE both utilize ARFI to generate shear waves, pSWE is often referred to as ARFI elastography in published studies. To avoid confusion, in this review we use ARFI to describe the method of wave generation and refer to the respective implementations as pSWE and 2D SWE.
Figure 2:

Transient elastography images. Left: image in a 39-year-old woman with chronic hepatitis C virus infection with no fibrosis (stage F0) (liver stiffness, 3.2 kPa; M probe). Middle: image in a 59-year-old man with chronic hepatitis B virus infection with stage F2 fibrosis (liver stiffness, 8.7 kPa; M probe), Right: Image in a 57-year-old man with nonalcoholic fatty liver disease with cirrhosis (liver stiffness, 27.0 kPa; XL probe). Liver stiffness measurement (Young modulus, median value of 10 measurements), interquartile range, and median value percentage are automatically calculated. An elastographic image (red box) shows axial displacement in terms of depth (y-axis) and time (x-axis). In stiffer tissues, the shear wave propagates more quickly and produces a steeper time-depth gradient (arrows).
Originally available clinically with Siemens (pSWE, Virtual Touch Quantification) and Supersonic Imagine (2D SWE) systems, ARFI methods are now integrated into clinical systems by other major vendors such as Philips (28,29), GE (30), Hitachi (31), Toshiba (32), Esaote (33), and Samsung (34) (Figs 3, 4). Two-dimensional SWE has now been incorporated into Siemens clinical US systems to complement the pSWE method (Fig 4). Clinical US elastography systems report “stiffness” values in terms of the Young modulus (E, in kilopascals), others as shear-wave speed (in meters per second), and others with options for both. Under simplifying assumptions of incompressibility, shear-wave speed and E are related by the following mathematical equation: E = 3ρc2, where c is the shear-wave speed and ρ is the density of tissue, assumed to be that of water. The 2017 European Federation of Societies for Ultrasound in Medicine and Biology, or EFSUMB, guidelines recommend that pSWE and 2D SWE measurements be performed at least 1 cm below the liver capsule to obtain the best results (35). In contrast to US elastographic systems, which generate shear waves and image them with the same probe, MR elastography requires external hardware to generate shear waves in the tissue of interest. Tissue mechanical properties are quantified through inversion of the visualized “wave field” into a map of the mechanical parameter of interest without the intermediate step of measuring shear-wave speed (Fig 5). Commercial MR elastography implementations report the shear stiffness of tissue, which is the magnitude of the complex shear modulus, |G*|. MR elastography was first described in 1995 by Muthupillai et al (36) and was approved by the Food and Drug Administration in 2009. Initially introduced with GE systems, the technique has since become available with Siemens and Philips MR systems. Care must be taken when comparing results between US and MR elastography due to the different output parameters reported.
Figure 3:

A, Successful and, B, unsuccessful point shear-wave elastographic acquisition (Siemens Acuson S3000) in a 58-year-old man with chronic hepatitis C virus infection and stage F2 liver fibrosis. Unsuccessful measurement (displaying as X.XX m/s) related to poor breath hold. In the successful measurement, wave speed was measured at 1.10 m/sec.
Figure 4:

Images obtained with the same system (Siemens Acuson S3000) in a 50-year-old woman with grade 2 steatosis without fibrosis. A, Point shear-wave elastographic image demonstrates placement of fixed-size region of interest in the right hepatic lobe, with measured wave speed of 1.17 m/sec. B, During the same examination, two-dimensional shear-wave elastographic image shows placement of larger size region of interest in the same area, with color elasticity map, and measured wave speed of 1.33 m/sec with interquartile range of 0.21 m/sec.
Figure 5:

MR elastography performed by using a two-dimensional gradient-recalled-echo sequence and a two-dimensional inversion algorithm in a 52-year-old woman with advanced liver fibrosis (stage F3) secondary to nonalcoholic steatohepatitis. A, Transverse magnitude image with intravoxel phase dispersion (arrows) present under the actuator (which is not visible on MR images). B, Transverse image with waves visible in liver parenchyma. C, Transverse colorized wave image shows wave propagation through liver parenchyma. D, Transverse gray-scale elastogram. E, Transverse colorized elastogram (0–8-kPa scale). F, Transverse colorized elastogram (0–8-kPa scale) with 95% confidence grid overlaid highlighting areas of reliable liver stiffness measurement. Liver stiffness was increased (5.3 KPa).
Liver fibrosis leads to increased stiffness. As shear waves travel through a tissue, the speed of the wave depends on the tissue stiffness (37). In stiffer tissues, the shear-wave speed is greater, enabling estimation of the degree of liver fibrosis from measuring the speed of a shear wave. In MR elastography, increased wavelength is evident in stiffer tissues. An obstacle to direct comparison between techniques is the frequency dependence of biologic tissue. Higher frequency shear waves produce higher stress and strain rates, resulting in higher stiffness measurements (38). This can be problematic when comparing US elastographic techniques, as TE operates at 50 Hz whereas ARFI methods operate at frequencies of 100–500 Hz (39). Thus, the frequency dependence, method of measurement, and parameter reported (wave speed, E, or G*) should be considered when comparing elastography techniques.
Reliability and Failure Rates of Elastographic Methods
TE Method
The failure rate and reliability of TE were assessed in a study of 13 369 examinations by using the M probe (40). The technique failed in 3.1% of cases; however, unreliable measurements were acquired in a further 15.8% of cases. Body mass index was identified as a significant contributory factor to failed and/or unreliable measurements. The introduction of the XL probe has improved the reliability of TE in patients with NAFLD (41–46). For example, in a study of 276 patients, reliable measurements were obtained in 73% of patients with the XL probe compared with only 50% of patients with the M probe (41).
Excellent interobserver variability has been reported for TE, with intraclass correlation coefficient (ICC) of 0.98 in a cohort of 188 patients with chronic HCV in whom two measurements were performed by two operators on the same day (47).
pSWE and 2D SWE Methods
The reliability of both pSWE and 2D SWE was compared in 79 patients with measurements performed by three radiologists (48). Failure rate was low for both methods (5% for 2D SWE and 1% for pSWE) and intraobserver agreement was higher for pSWE than 2D SWE (0.915 vs 0.829). Scan-rescan repeatability of 2D SWE measurements performed on the same day by the same operator has been shown to be excellent, with ICC of 0.95 and 0.93 for an expert and novice operator, respectively (49). However, intraobserver reproducibility between measurements performed in the same subject on different days revealed ICC values of 0.84 and 0.65 for an expert and novice operator, respectively. There is further evidence to suggest that operator experience has an effect on pSWE measurements (50), thus operators are recommended to be suitably trained. With the introduction of pSWE and 2D SWE into commercial US systems by many manufacturers, interplatform variability may be an issue. The Quantitative Imaging Biomarkers Alliance, or QIBA, has formed a committee tasked with establishing reproducibility across US elastography systems (51).
MR Elastography
The failure rate of MR elastography is low, with the largest series to date reporting a failure rate of only 5.6% when using a 2D GRE sequence (52). The majority of these failures (71%) were attributed to iron deposition. Another large cohort study found a similarly low failure rate at 1.5 T (3.5%); however, at 3T the rate of failure was higher (15.3%) (53). In the same study, failure was also significantly associated with iron deposition, the presence of large ascites, and increased body mass index (see below) (53). The use of MR elastography in children is also reliable, with a recent study reporting a failure rate of 4% with use of the 2D GRE sequence (54). The test-retest repeatability of MR elastography is high (55–59), with reported ICC of 0.95 (56). A recent meta-analysis of 274 patients concluded that a change in stiffness of 22% or greater measured at the same site by using the same equipment signified a true change in stiffness with 95% confidence (60). Lee et al (61) showed that a large region of interest representing approximately 70% of the liver, including the greatest part of the liver parenchyma excluding hepatic hilar vessels, increased the interobserver reproducibility, while a placement of a 1-cm region of interest in each liver segment optimized the intraobserver reproducibility. Similarly, with precise definition of region of interest placement, including all the pixels with confidence index higher than 95%, Yasar et al (62) found almost perfect inter- and intraobserver reproducibility, with ICC higher than 0.97 and Bland-Atman limits of agreement range lower than 15.9% and 4.2%, respectively.
To become a widely accepted method for diagnosis and staging of fibrosis, MR elastography must produce consistent results regardless of the MR system used. Good interplatform reproducibility was reported with use of a 2D GRE sequence at 1.5 T, with ICC between 0.82 and 0.99 (62–64). At 3 T, between-vendor ICC was 0.71 for the 2D GRE sequence and 0.69 for the 2D spin-echo echo-planar imaging sequence (64). In the same study, the variance in liver stiffness based on technical factors was reported to be only 0.042 kPa, with corresponding coefficient of variation of 10.7%. The reproducibility of spleen stiffness measurement using MR elastography has been less well studied, with a study reporting ICC greater than 0.88 (62). The QIBA has formed a committee (65) dedicated to standardizing MR elastography through identifying bias in measurements and identifying a suitable phantom for characterization of data acquired from different MR elastography systems.
In summary, MR elastography and 2D SWE appear to produce the highest rate of successful measurements; however, the introduction of the XL probe has improved the applicability of TE in overweight patients. Reproducibility is good to excellent among all elastographic techniques.
Diagnostic Performance of Elastographic Methods for Staging Liver Fibrosis
Diagnostic accuracy for liver fibrosis staging in chronic liver diseases, including chronic HBV or HCV infections, and NAFLD for select publications across Europe, Asia, and the United States, are presented for TE (43,46,66–77) (Table 2), ARFI elastographic methods (46,72,77–83) (Table 3), and MR elastography (38,81,84–94) (Table 4). Publications have been selected on the basis of reporting of diagnostic accuracy, historical primacy, cohort size, and geographic distribution. The TE technique has been thoroughly researched and validated for diagnosis of liver fibrosis in large cohort studies, mostly in Europe.
Table 2.
Reported Diagnostic Performance of Prospective Transient Elastography Studies for Liver Fibrosis Staging in Chronic HBV or HCV and NAFLD
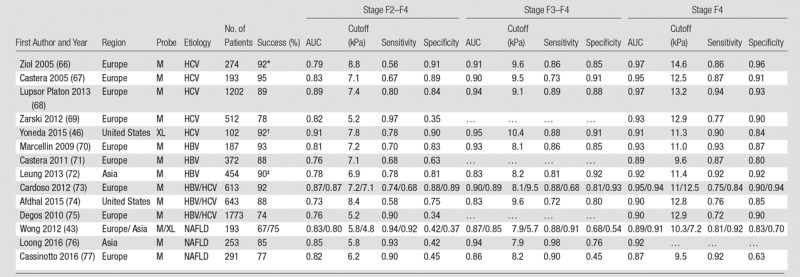
Note.— AUC = area under the receiver operating characteristic curve, HBV = hepatitis B virus, HCV = hepatitis C virus, NAFLD = nonalcoholic fatty liver disease. Successful measurements exclude failures and unreliable results.
*Performance for 188 patients reported.
†Combined failure rate for two-dimensional shear-wave elastography and transient elastography. Transient elastography only data not available.
‡Performance for 226 patients reported.
Table 3.
Reported Diagnostic Performance of Prospective pSWE and 2D SWE Studies for Liver Fibrosis Staging in Chronic HBV or HCV and NAFLD
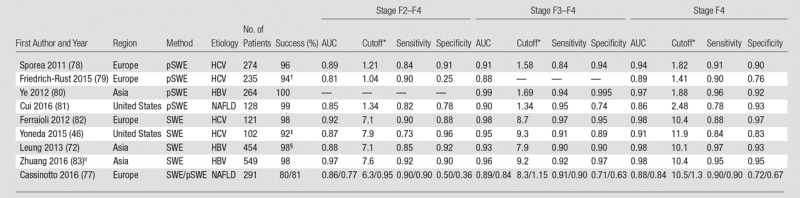
Note.— AUC = area under the receiver operating characteristic curve, HBV = hepatitis B virus, HCV = hepatitis C virus, NAFLD = nonalcoholic fatty liver disease, pSWE = point shear-wave elastography, SWE = shear-wave elastography, 2D = two-dimensional.
*Cutoff values in kilopascals for 2D SWE and in meters per second for pSWE. Successful measurements exclude failures and unreliable results.
†Reported for 182.
‡Combined failure rate for 2D SWE and TE. Two-dimensional SWE only data not available.
§Reported for 226.
||Training set (n = 304) results reported. Scheuer scoring system used.
Table 4.
Reported Diagnostic Performance of MR Elastography for Liver Fibrosis Staging in Mixed-Etiology Cohorts, Chronic HBV or HCV, and NAFLD
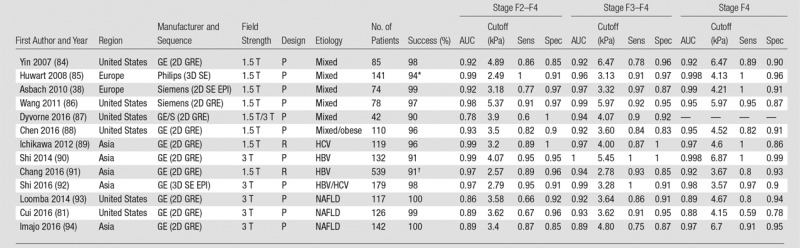
Note.—AUC = area under the receiver operating characteristic curve, GE = General Electric, GRE = gradient recalled echo, HBV = hepatitis B virus, HCV = hepatitis C virus, NAFLD = nonalcoholic fatty liver disease, P = prospective, R = retrospective, SE = spin echo, Sens = sensitivity, Spec = specificity, 3D = three-dimensional, 2D = two-dimensional.
*Reported for 96.
†Reported for 270.
In the following sections, diagnostic performance of US and MR elastographic methods will be discussed for the major etiologies of liver disease. Summary statements are included to provide condensed conclusions.
Chronic HBV and HCV Infections
Knowledge of liver fibrosis stage in chronic HBV and HCV infections is beneficial for prognosis, follow-up, and treatment decisions. The combination of powerful direct-acting antivirals recently developed in chronic HCV infection (95) and the recent increased use of noninvasive tests for liver fibrosis staging as proposed in the most recent European Association for the Study of the Liver, or EASL, guidelines on chronic HCV infection (96) have decreased the use of liver biopsy in chronic HCV infection (97). The American Association for the Study of Liver Diseases, or AASLD, guidelines on chronic HBV infection state that staging of liver disease is important to inform therapy decisions and cite the utility of TE for noninvasive staging of fibrosis, especially in excluding advanced fibrosis (98).
TE Technique
Several early studies reported excellent diagnostic performance of TE for the detection of advanced fibrosis and cirrhosis in chronic HCV infection, with areas under the receiver operating characteristic curve (AUCs) of 0.88–0.99 (37,66,67) (Table 2, Fig 2). Similar results were subsequently reported by other studies in chronic HCV and HBV infections (68,70,71,73,75,99–101), though in some cases the performance of TE was decreased compared with serum markers owing to a high proportion of unreliable results (69). Several meta-analyses (102–109) have confirmed the excellent diagnostic accuracy of TE for diagnosing cirrhosis (AUC, 0.93–0.96), better than that for detecting moderate fibrosis (F2–F4) (AUC, 0.83–0.88), with cutoffs ranging from 7.0–7.9 kPa for the diagnosis of moderate fibrosis (F2–F4) and 11.3–15.6 kPa for the diagnosis of cirrhosis (F4) (105,107–109). These results suggest that TE is better at ruling out rather than ruling in liver cirrhosis, with negative predictive value greater than 90%. These results have been confirmed in a North American study (74). The EASL-Asociación Latinoamericana para el Estudio del Hígado guidelines (110) recommend that a combination of TE and serum markers be used to diagnose moderate fibrosis (F2–F4) in chronic HCV infection. These guidelines were recently validated in chronic HCV infection (111). The guidelines also recommend TE as a noninvasive method to diagnose fibrosis in treatment-naïve chronically HBV-infected patients (110).
pSWE Technique
ARFI methods have become available more recently than TE, thus are less well investigated, with data in chronic HBV (112–118) and HCV (78,79,119–127) infections showing high accuracy for liver fibrosis staging (Table 3, Fig 3). For example, in a study of 274 patients with chronic HCV (78), AUCs of 0.91 and 0.94 were reported for diagnosing stage F3–F4 and cirrhosis, respectively. A study in chronic HBV infection (83) also reported excellent diagnostic performance, with AUC greater than 0.95 for Scheuer stage S3–S4 and S4. A recent meta-analysis (128) comprising 21 studies (2691 patients) with chronic HBV or HCV infections reported AUCs of 0.88 and 0.91 for stage F2–F4 and F4, respectively. Recent guidelines from the National Health Service in the United Kingdom (129) recommend the adoption of pSWE for the diagnosis and monitoring of liver fibrosis in patients with chronic HBV or HCV infections. The National Health Service report suggested that pSWE has similar or higher performance than TE in diagnosing liver fibrosis.
Two-dimensional SWE
Two-dimensional SWE is also a highly accurate method in chronically HBV- or HCV-infected populations (72,82,130–132) (Table 3); however, less well studied than pSWE and TE. Two-dimensional SWE has been found to be an equivalent, if not better, diagnostic tool than TE in chronic HCV cohorts (82,133). A meta-analysis based on seven 2D SWE studies reported AUC values of 0.91 for stage F2–F4 and 0.95 for cirrhosis (134). Thus, at present, 2D SWE can be used with equivalent diagnostic results to TE; however, further validation is required to establish cutoffs for HCV and HBV populations.
MR Elastography
Given the limited availability and recent clinical use of MR elastography, less published data are available compared with TE and pSWE, with a smaller number of prospective studies, many in cohorts of mixed etiologies of liver disease (52,55,84,86–88,135–138), and lack of studies including validation cohorts (Table 4, Fig 6). From the published studies in chronic HCV or HBV infections (58,89–91,139–144), 2D GRE MR elastography has shown excellent accuracy in diagnosing liver fibrosis or cirrhosis, with AUCs for the diagnosis of fibrosis stages F2–F4, F3–F4, and F4 of 0.95–0.99, 0.94–1, and 0.92–1, respectively (89–91,140–143). A meta-analysis of data from patients with chronic HCV and chronic HBV report accuracy equivalent to, or slightly lower than (in early fibrosis stages), that in published studies, with AUCs for stage F2–F4, F3–F4, and F4 of 0.88, 0.94, and 0.92 in HCV infection and 0.94 (stage F2–F4) and 0.97 (stage F3–F4) in HBV infection (145). Several studies also showed that necroinflammation may increase liver stiffness (90,146,147). Currently, there are limited data on the performance of 2D spin-echo echo-planar imaging and three-dimensional spin-echo echo-planar imaging MR elastography in chronic HBV and HCV; however, similar diagnostic accuracy as that with TE and 2D GRE MR elastography has been reported in a few studies (92,148).
Figure 6:

Transverse T2-weighted half-Fourier acquisition single-shot turbo spin-echo, or HASTE, anatomic images (top) and transverse MR elastograms (bottom) depict increasing liver stiffness with increasing fibrosis in patients with chronic hepatitis C virus infection: stage F1 in a 51-year-old man, stage F2 in a 67-year-old man, stage F3 in a 46-year-old man, and stage F4 in a 65-year-old woman. Anatomic images depict no significant liver nodularity in patients with stage F3–F4 fibrosis, while MR elastograms reveal increasing stiffness (yellow and red colored areas).
In summary, TE is the most validated technique for diagnosing liver fibrosis and cirrhosis in chronic HCV and HBV infections and has been incorporated in several guidelines for management of chronic HBV and HCV infections. Emerging data suggest that pSWE methods are equivalent to or possibly superior to TE in viral hepatitis, with the integration of pSWE in the National Health Service guidelines in the United Kingdom. Two-dimensional SWE and MR elastography show promising results in chronic HBV and HCV infections; however, the available data are limited. In the case of MR elastography, studies have often included mixed etiologies, with a lack of prospective studies with validation cohorts. All elastographic methods have higher accuracy for diagnosing advanced fibrosis and cirrhosis than lower fibrosis stages.
NAFLD and NASH
NASH is becoming a widespread problem in the United States due to the increasing prevalence of obesity and NAFLD (149,150). Liver fibrosis has been shown to be the strongest predictor of complications in NAFLD patients (151), which motivates the need for reliable noninvasive techniques for detection of liver fibrosis and will be of major interest for clinicians and in terms of public health perspective.
TE Method
The current EASL guidelines for the management of NAFLD recommend TE as a noninvasive method for liver fibrosis assessment and monitoring, while liver biopsy is still recommended to confirm advanced fibrosis and cirrhosis (152). The use of TE in patients with NAFLD is challenging owing to the poor reliability of the technique in overweight or obese patients when the standard M probe is used. The range of unreliable measures is large, with reported unreliable and/or failed measurements in 3.8%–50% of patients (41,76,153). A meta-analysis of the TE performance using the M probe in NAFLD (n = 854) (154) reported pooled sensitivity and specificity of 79% and 75% for F2–F4, 85% and 82% for F3–F4, and 92% and 92% for stage F4. Pooled AUC was not reported, though AUC ranges for the included studies were 0.79–0.87 for F2–F4, 0.76–0.98 for F3–F4, and 0.91–0.99 for stage F4. As in chronic HBV or HCV infections, TE is more accurate in higher fibrosis stages. The introduction of the XL probe has led to more reliable results than with the M probe in overweight or obese patients (155), with lower stiffness values compared with the M probe which may necessitate revalidated cutoffs (42–45).
pSWE Method
A preliminary study in NAFLD patients (156) found that pSWE performed very well when diagnosing fibrosis stage F3–F4 and F4, with AUC greater than 0.97 (Fig 4). Subsequent studies have reported similar high accuracy in diagnosing fibrosis and differentiating NASH from simple steatosis (157–159). In a comparative study of pSWE and TE (with the M and XL probes) (160), no significant difference was found, although pSWE achieved a significantly higher reliability rate. A more recent study found that while pSWE reported AUCs greater than 0.85 for discriminating fibrosis stages F2 or greater, it was outperformed by MR elastography (81).
Two-dimensional SWE
Two-dimensional SWE is less well validated than pSWE and TE in NAFLD patients (Fig 4). Recently, a prospective study in NAFLD (n = 291) evaluated 2D SWE, pSWE, and TE using the M probe (77). When accounting for unreliable results, all techniques had a similar amount of successful measurements (80%, 77%, and 81% for 2D SWE, TE, and pSWE, respectively). Two-dimensional SWE performed better than pSWE for the diagnosis of moderate fibrosis (stage F2–F4), with AUC of 0.85 versus 0.76. In a prospective study of overweight patients with mixed etiologies, 2D SWE of the right lobe performed similarly to TE with the XL probe, with AUC greater than 0.90 for fibrosis stages F2 or greater (46).
MR Elastography
A small number of retrospective or prospective studies have focused on NAFLD and/or NASH populations (25,81,93,94,161–164), with reported AUCs greater than or equal to 0.86 (Table 4; Figs 5, 7). A recent meta-analysis of nine studies with 232 patients (165) reported AUCs of 0.90 or greater for the diagnosis of fibrosis stages F3–F4 and F4, with associated cutoffs of 3.77 kPa and 4.09 kPa, respectively. As they were derived from a meta-analysis, these cutoffs are probably the most applicable at this time, but further validation studies are needed. There is also evidence that MR elastography may be able to differentiate NASH and simple steatosis in NAFLD patients (161), with a reported AUC of 0.93, but this needs further confirmation.
Figure 7:

Top row, images in 43-year-old woman with nonalcoholic steatohepatitis and advanced fibrosis (stage F3) at liver biopsy. A, Transverse PDFF image demonstrates mild steatosis (PDFF, 14.6%). B, Transverse wave image obtained with MR elastography demonstrates increased wavelength (thicker waves) in liver parenchyma. C, Transverse elastogram demonstrates increased liver stiffness (4.33 kPa). Bottom row, images in a 29-year-old woman with nonalcoholic fatty liver disease with no fibrosis (stage F0) at liver biopsy. D, Transverse PDFF image demonstrates mild steatosis (PDFF, 9.2%). E, Transverse wave image obtained with MR elastography demonstrates short wavelengths in the liver (thinner waves) parenchyma. F, Transverse elastogram demonstrates normal liver stiffness (2.22 kPa). PDFF = proton density fat fraction.
Other Etiologies of Liver Disease
TE has also been applied in the study of autoimmune liver disease, with excellent diagnostic performance (166), though several studies have reported that acute inflammation as a result of autoimmune hepatitis may affect liver stiffness (167,168). TE has also been shown to be an accurate method for staging fibrosis in primary biliary cirrhosis (169–171), primary sclerosing cholangitis (172,173), and alcoholic liver disease (174–176). pSWE methods have been applied in autoimmune liver disease and alcoholic liver disease in a small number of studies (177–181). Two-dimensional SWE has also been applied in alcoholic liver disease, with similar accuracy to TE reported (176). Excellent diagnostic accuracy of MR elastography has been reported in autoimmune hepatitis (182) and primary sclerosing cholangitis (183); however, the method has not been applied in the study of alcoholic liver disease thus far.
In summary, patients with NAFLD and NASH are more likely to be overweight, which is an important factor to consider for elastography measurements. The TE M probe is prone to unreliable results and/or increased risk of failure in these subjects, and this has been improved with the XL probe. In these subjects, ARFI methods are less susceptible to failure than TE. MR elastography is the most robust technique in overweight or obese patients, with reported high accuracy for fibrosis staging, although published data are still limited.
Additional and Evolving Applications
Assessment of Degree of Portal Hypertension, Risk of Hepatic Decompensation and HCC
Liver cirrhosis can be further categorized into compensated or decompensated cirrhosis. Decompensated cirrhosis is primarily diagnosed on the basis of the presence of variceal bleeding and ascites and is associated with a significantly increased risk of mortality (184). Recent data suggest that liver and spleen stiffness may represent potential biomarkers for hepatic decompensation and HCC risk.
TE.—Many studies have shown the ability of baseline liver stiffness measurement (172,185–199) to help predict hepatic decompensation in patients with chronic liver disease. Two studies also looked at the evolution of liver stiffness values over time (172,197) and found that patients with increasing liver stiffness (1–1.5 kPa per year) were at higher risk of developing complications, with one study estimating a 10-fold increase in complications (172). In a meta-analysis of six studies that reported hepatic decompensation as an outcome, each unit increase in liver stiffness was associated with a 7% increased decompensation risk (200). TE can also help diagnose portal hypertension, with another meta-analysis reporting excellent diagnostic performance of TE for diagnosing the presence of clinically significant portal hypertension (defined by hepatic venous pressure gradient ≥ 10 mm Hg), with an area under the hierarchical summary receiver operating characteristic curve (HSROC) of 0.93 (201). Scores combining liver stiffness with platelet count and spleen diameter at US, referred as LSPS (for liver stiffness spleen-diameter-to-platelet-ratio score) (202) or portal hypertension risk score (203), have also been proposed to increase the diagnostic accuracy.
The performance of TE in predicting the presence and size of esophageal varices based on liver stiffness measurements is also promising. A meta-analysis of 12 studies (2049 patients) (201) found the HSROC of TE to be 0.84 for diagnosing esophageal varices. When evaluating the predictive value of TE for diagnosing large esophageal varices (in nine studies comprising 2168 patients), the HSROC was 0.78. The Baveno VI consensus workshop recommendations (204) state that liver stiffness measured with TE may be useful for classifying patients with portal hypertension. Spleen stiffness has been also suggested as a marker of severity of portal hypertension (205) with a reasonable accuracy (AUC, 0.78–0.90) in predicting the presence of esophageal varices (206–208). However, the measurement of spleen stiffness is difficult with TE and requires concomitant conventional US guidance.
A correlation between liver stiffness measured by TE and the risk of developing HCC has been reported by several longitudinal prospective studies (187,195,209–219). For example, a large prospective Japanese study (n = 866) (214) reported increased cumulative incidence of HCC within 3 years (38.5% among patients with baseline liver stiffness values > 25 kPa, compared with 0.4% among patients with values ≤ 10 kPa).
pSWE.—So far, published data show similar prognostic ability between pSWE and TE in predicting hepatic decompensation (220). Due to the integration into conventional US systems, pSWE methods are more suitable for measuring spleen stiffness than is TE. A study of 393 patients with median follow up of 44 months found that liver and spleen stiffness measured with pSWE were associated with decompensation (hazard ratios of 2.53 and 16.58 per unit increase in stiffness, respectively) (221). In patients with chronic HCV infection, pSWE outperformed serum markers in the prediction of esophageal varices (AUC, 0.89 vs 0.75) (222). Diagnostic performance was also excellent for the diagnosis of high-risk esophageal varices, with AUC of 0.87 versus 0.74 for pSWE and serum markers, respectively. Few preliminary studies have evaluated pSWE for the prediction of HCC development (223,224), indicating that liver stiffness measured with pSWE is a significant predictor of HCC development. More studies are needed to validate these results.
Two-dimensional SWE.—Liver and spleen stiffness measured with 2D SWE have also been shown to correlate with hepatic venous pressure gradient measurement (225,226). In a cirrhotic population (227), 2D SWE outperformed TE for diagnosing clinically significant portal hypertension (AUC, 0.87 vs 0.78, respectively). Two-dimensional SWE spleen stiffness measurements have been significantly associated with the presence of esophageal varices (228), though a high failure rate in spleen measurements (∼ 30%) is a limitation. There is little published data on the ability of 2D SWE to predict HCC development. In one retrospective study (229), the authors noted significantly higher liver stiffness in patients with HCC than those without; however, prospective studies are required for validation.
MR elastography.—To date, few studies have investigated the role of MR elastography in predicting hepatic decompensation (183,230,231). In a retrospective study of 266 patients with primary sclerosing cholangitis, Eaton et al (183) found that liver stiffness was a significant predictor of risk of decompensation (hazard ratio, 1.24–1.30 per unit increase in liver stiffness). MR elastography measurement of predictive markers of portal hypertension is an emerging field of research (232–236). The cross-sectional imaging volume available with MR elastography enables simultaneous acquisition of liver and spleen MR elastography data via the use of an additional actuator placed on the left side (62,237) and may allow the development of composite diagnostic tests by using both measurements as has been implemented with TE (238). Spleen stiffness measured by means of MR elastography has been associated with the presence of esophageal varices (233,235) and found to correlate with hepatic venous pressure gradient (Fig 8) (234). Though the available data suggest that MR elastography may be beneficial in predicting risk of decompensation and diagnosis of portal hypertension, more studies are required to confirm the findings.
Figure 8:

A, Transverse T2-weighted half-Fourier acquisition single-shot turbo spin-echo, or HASTE, MR anatomic image with arrows indicating actuator position and, B, transverse stiffness map in a 27-year-old healthy woman with normal liver stiffness (2.1 kPa) and spleen stiffness measured at 4.3kPa. C, Transverse anatomic image with arrows indicating actuator position and, D, transverse stiffness map in a 61-year-old female patient with cirrhosis (secondary to chronic hepatitis C virus infection) and clinically significant portal hypertension (hepatic venous pressure gradient of 15 mmHg) demonstrate elevated liver stiffness (7.5 kPa) and spleen stiffness (9.9 kPa).
A small number of studies to date have evaluated MR elastography as a predictive tool for the development of HCC, with conflicting data (239,240). While one retrospective study (240) reported elevated liver stiffness in patients with HCC compared with those without HCC, another study did not (239). Thus, more data are needed to predict risk of HCC with MR elastography.
Monitoring of Chronic HCV Infection after Antiviral Therapy
The introduction of direct-acting antivirals has revolutionized therapy in chronically HCV-infected patients, with excellent cure rates reported in most genotypes (241) and subsequent reduction in liver transplant waiting lists (242). Determination of residual fibrotic burden in patients who have achieved sustained virological response is important for both prognosis and surveillance for complications such as HCC. Several studies have reported reduction in liver stiffness of up to 35% (243) following direct-acting antiviral therapy as measured by TE (243–248) and ARFI methods (249,250). The clinical significance of reduced liver stiffness following sustained virological response has not been established, as few longitudinal studies incorporating biopsy and noninvasive tests have been performed. One study investigated the longitudinal changes in liver stiffness with paired liver biopsies in HCV/HIV-coinfected patients treated with antiretroviral therapy and anti-HCV drugs (in a portion of the population). Patients with progressing fibrosis were found to have significantly increased liver stiffness at 3 years after baseline, while liver stiffness was unchanged or reduced in stable patients (251). There is no published MR elastography study assessing changes in liver stiffness after antiviral therapy. Further studies are required to establish the utility of noninvasive tests in the longitudinal monitoring of HCV patients undergoing antiviral therapy.
HCC Characterization
Liver lesion characterization is beyond the scope of this review. Briefly, there are some data assessing the role of US and MR elastographic methods in quantifying tumor stiffness for the purpose of liver lesion characterization (252–266), with a trend toward increased stiffness in malignant lesions, such as HCC (Fig 9). A recent study reported higher tumor stiffness values in well or moderately differentiated HCCs compared with poorly differentiated HCCs (267). Another preliminary study has reported a significant correlation between tumor stiffness and degree of tumor necrosis and enhancement in HCC after local-regional therapy (268). A drawback of MR elastography investigation of tumors is the limited spatial resolution and coverage of current 2D MR elastography implementations (269). Nonlinear inversion algorithms (270) paired with three-dimensional MR elastography (265) may help to address the problem.
Figure 9:

Transverse T2-weighted half-Fourier acquisition single-shot turbo spin-echo, or HASTE, anatomic image (left) and transverse MR elastogram (right) in a 59-year-old man with chronic hepatitis C virus infection and infiltrative hepatocellular carcinoma in right hepatic lobe (arrows). MR elastography demonstrates increased stiffness (7.7 kPa) compared with background liver parenchyma (3.2 kPa). Another hepatocellular carcinoma nodule is present in left lateral hepatic lobe (arrowheads), also demonstrating increased stiffness.
In summary, the available data suggest that elastographic techniques may be viable methods for prediction of portal hypertension and hepatic decompensation, although further research is needed to understand how the results should be used to inform patient care. Spleen stiffness appears to be a useful biomarker for portal hypertension and prediction of esophageal varices. Finally, TE has been applied in the monitoring of patients undergoing antiviral therapy in chronic HCV; however, the utility of the technique in this role has yet to be established.
Comparison of MR Elastography to US Elastography and Other Noninvasive Tests
A few comparative studies investigating the diagnostic accuracy of MR elastographic and US elastographic methods have been published. Though MR elastography was generally found to be superior to TE in diagnosing fibrosis in mixed cohorts (85,87,271) and NAFLD patients (94,164), other studies have found both techniques to perform similarly (88,148). Less literature on the comparison of MR elastography with ARFI methods is available. A meta-analysis assessing the diagnostic accuracy of pSWE (15 studies, 2128 patients) and MR elastography (11 studies, 982 patients) for staging fibrosis found that MR elastography is more accurate than pSWE, particularly in diagnosing early stages of fibrosis (272). MR elastography has also been compared with 2D SWE in a mixed-etiology cohort (138), with comparable diagnostic accuracy for both techniques in staging fibrosis. A recent study used MR elastography as the reference standard and found the 2D SWE and MR elastography measurements to be well correlated (273). MR elastography has also been shown to outperform serum markers (25,87,89,141,143,162), morphologic features (137), and diffusion measurements (86,87,266,274–276).
When evaluating US elastographic methods alone, a meta-analysis of 13 studies including 1163 patients found that pSWE had a similar predictive value as that of TE for advanced fibrosis and cirrhosis while producing a higher rate of reliable measurements (277). Studies comparing TE to pSWE (278) and 2D SWE (72,82) have found ARFI methods to provide similar or superior diagnostic performance to TE. In comparisons of all three methods, pSWE, 2D SWE, and TE (77,279,280), 2D SWE was the slightly superior method for staging fibrosis (77), with variable reliability compared with pSWE (279,280).
Limitations of Elastographic Techniques
Although each elastographic method has its own limitations, some drawbacks apply to all techniques. For example, liver stiffness values increase after meal intake (59,281–286); therefore, elastographic examinations should be performed after fasting for at least 2 hours (110), though fasting for 4–6 hours prior to measurement has also been recommended (39). Similarly, cholestasis has been shown to cause increased liver stiffness in TE (287), pSWE (288), and MR elastography (183). A further difficulty in establishing cutoff values for fibrosis staging is the influence of the underlying etiology of liver disease on measured stiffness values; for example, the cutoffs for predicting esophageal varices in patients with cirrhosis using TE is higher in those with alcoholic cirrhosis than in those with liver cirrhosis of viral etiology (289). The cause of this variance has not been conclusively established. Factors such as alanine aminotransferase levels have been suggested (290); however, the inherent morphologic differences in collagen distribution caused by increases in myofibroblasts, which are associated with the various etiologies of fibrotic liver disease, could also be a reason for the discrepancy in cutoff values, even for livers with the same “stage” of fibrosis (291,292). Also, cutoff values are generally established on the basis of receiver operating characteristic analysis of a single-study population and so are affected by the prevalence and severity of fibrosis and cirrhosis in that population (35). Elastography methods are useful as tools to generally stratify patient risk; however, intermediate fibrosis stages can be difficult to delineate. The Society of Radiologists in Ultrasound consensus report of 2015 (39) highlighted the overlap of pSWE shear-wave speeds at intermediate fibrosis levels (sourced from a meta-analysis [293]) and therefore suggests using thresholds to define population groups, which are unlikely to require follow-up (stage F0–F2), those at high risk (some F3 and F4), and those in between who may require further testing, including MR elastography, to inform treatment decisions.
Breathing motion may also affect US elastography and MR elastography measurements. In US elastography, taking a deep breath or using the Valsalva maneuver can change liver stiffness (294,295). The 2017 EFSUMB guidelines recommend that measurement be performed during breath hold, while avoiding deep inspiration (35). Also, it has been recently suggested that inspiration statically deforms the liver, which is expected to alter the observed stiffness due to nonlinearity in elasticity of biologic tissues (296). In 2D GRE MR elastography, a four-section acquisition generally requires four breath holds of approximately 15 seconds each. Three-dimensional MR elastography acquisitions also require that multiple breath holds be performed. For accurate determination of liver stiffness over the liver volume, breath holding should be performed in expiration to minimize positional changes between breath holds.
Because the liver is surrounded by a nonelastic envelope (Glisson capsule), additional space-occupying tissue abnormalities, such as edema, inflammation, or congestion, can interfere with measurements of liver stiffness, independently of fibrosis. A further consideration when utilizing elastographic methods is the additional cost of the examination above standard clinical examinations. In the United States, TE has recently become a reimbursable medical examination with the creation of a Current Procedural Terminology (CPT) code 91200 for the procedure (297). A CPT code 0346T for pSWE and 2D SWE methods can be added to the regular US code. MR elastography, the most expensive method, has not yet been granted a CPT code, but its increasing use may motivate the introduction of one. More specific limitations for US elastography and MR elastography are discussed below.
Limitations of US Elastography Methods
Two-dimensional SWE and pSWE can be performed with one probe in all patients, independent of body weight, as the region of interest can be positioned manually at different depths in the liver. As compared with TE, ascites is not a limitation for ARFI US methods, enabling its performance in decompensated liver cirrhosis for prognostic reasons. TE is not suited for spleen measurements owing to the need for external guidance from another US system. The risk of overestimating liver stiffness values has been reported, with other confounding factors including alanine aminotransferase flares (298–300), congestive heart failure (301), excessive alcohol intake (302–304), and acute viral hepatitis (298,305). Some work has been done to establish cutoffs that account for these confounding factors (306), though further validation is required. The influence of steatosis is still a matter of debate with conflicting results, some studies suggest a detrimental effect (307,308), whereas others do not (309,310). In summary, US elastographic techniques need to be performed by using a standardized protocol and with critically interpreted results, taking confounding factors into account (110).
Limitations of MR Elastography
Although considered a highly accurate technique, MR elastography has several limitations. The primary drawback of liver MR elastography is the sensitivity of 2D GRE sequence to iron deposition. The short T2* time of the liver affected by iron deposition means that signal-to-noise ratio from a standard GRE sequence is too low, and thus unable to resolve wave propagation (311). This has been addressed by the introduction of spin-echo and spin-echo echo-planar imaging–based sequences, which are instead primarily sensitive to T2 relaxation and thus provide higher signal-to-noise ratio even in slightly longer echo times (312) (Fig 10). A study comparing 2D GRE and spin-echo echo-planar sequences found both sequences produced consistent liver stiffness measurements, with the spin-echo echo-planar sequence producing reliable results in subjects in whom the GRE sequence failed due to iron deposition and larger reliable regions of interest (311). Another study found 2D GRE and spin-echo echo-planar MR acquisitions to produce reasonably consistent results at 1.5 T and 3.0 T with ICCs ranging 0.73–0.9 across manufacturers (64).
Figure 10:

Images in a 61-year-old man with cirrhosis secondary to chronic hepatitis C virus infection and secondary hemosiderosis causing failure of two-dimensional gradient-recalled-echo (GRE) MR elastography (MRE) at 1.5 T. The shortened liver T2* (4.7 msec) due to iron deposition causes low signal-to-noise ratio, with disorganized wave propagation pattern and no areas of reliable stiffness measurement. Two-dimensional echo-planar imaging (EPI) sequence performed during the same MR imaging examination is less sensitive to T2* effects, allowing successful wave propagation and liver stiffness measurement (5.6 kPa).
There is conflicting evidence on the effect of body mass index on MR elastography measurements: A recent study found that body mass index was not a contributing factor in failure (88), but found waist circumference to be a significant factor of failure. In contrast, a recent large retrospective study investigating the cause of MR elastography failure using a 2D GRE sequence (53) found that body mass index, iron deposition, massive ascites, and use of 3 T were significantly associated with MR elastography failure (Fig 11). The overall failure rate was low (3.5%) at 1.5 T though it increased to 15.3% at 3 T, likely due to increased T2* relaxation at higher field strength. Other potential causes of failure include poor actuator placement, coupling to the body, or tube disconnection, which require the examination to be repeated, and abnormal physiology. MR elastography is also costlier and less available than US elastography.
Figure 11:

Images in a 57-year-old man with decompensated cirrhosis (secondary to chronic hepatitis C virus infection) and large ascites causing two-dimensional gradient-recalled-echo MR elastography failure. A, Transverse T2-weighted half-Fourier acquisition single-shot turbo spin-echo, or HASTE, image shows cirrhotic liver (liver contour outlined in white) and large ascites (arrows). B, Transverse wave image shows propagation in subcutaneous fat and fluid but disrupted waves in liver parenchyma, resulting in no reliable areas of stiffness measurement on, C, transverse elastogram.
New Technical Developments
Measurement of Liver Steatosis with TE
A more recent application of TE is the controlled attenuation parameter (CAP) (313). CAP, which is available on both M and XL probes, estimates the attenuation of the US signal in units of dBm−1 and is used as a method to grade steatosis. A recent meta-analysis of a mixed-etiology cohort using the M probe (314) reported excellent accuracy for detecting steatosis based on histopathologic findings. A small pilot study using the XL probe (315) found that performance was similar between the M and XL probes for detecting liver fat. Further validation in large cohorts is required to determine the performance of CAP, particularly with the XL probe. A benefit of MR imaging when assessing NAFLD patients is the high accuracy of liver fat quantification using advanced confounder-corrected chemical shift–encoded methods now available with all scanner manufacturers (316), which can be combined with liver stiffness measurement for a comprehensive examination of liver health (Fig 6). In the study by Imajo et al (94), the combination of MR elastography and liver fat quantification outperformed TE and CAP for staging fibrosis and fat quantification, respectively. Further comparison studies are required between MR-based fat quantification and elastography and US-based TE and CAP for combined staging of fibrosis and steatosis.
Three-dimensional MR Elastography
Though the acquisition of all three directions of motion is not a new development (317), advances in inversion algorithms and the increasing availability of research three-dimensional MR elastography imaging sequences has made the technique more accessible. Three-dimensional MR elastography enables the determination of additional parameters compared with 2D owing to the acquisition of the full wave field and fewer assumptions about the material model during inversion. These parameters, such as volumetric strain, which has been shown to be sensitive to pressure-related changes (318) and may have applications in the diagnosis of portal hypertension, are still being evaluated to establish clinical benefit. The acquisition of all three motion directions also addresses the issue of artificially increased wavelengths due to oblique 2D waves violating the planar wave assumption (319). Further details on three-dimensional MR elastography are included in the Appendix E1 (online).
A comparison of the diagnostic accuracies of 2D GRE and three-dimensional spin-echo echo-planar imaging MR elastography in 73 patients with chronic liver disease found 2D and three-dimensional sequences to perform similarly (320). However, three-dimensional MR elastography parameter results were significantly lower than those of 2D MR elastography. A similar result was reported from a study of patients with NAFLD performed at 60 Hz and 40 Hz vibration frequencies (163). Diagnostic accuracy for diagnosing F3–F4 fibrosis in 2D and three-dimensional MR elastography at 60 Hz vibration frequency was not significantly different. Three-dimensional MR elastography data acquired at 40 Hz showed improved diagnostic accuracy with a significantly higher AUC than 2D measurements (AUC, 0.98 vs 0.92). Three-dimensional spin-echo echo-planar imaging MR elastography failure rate has been reported as lower than that of 2D GRE MR elastography, as the spin-echo echo-planar imaging sequence is expected to perform better in hepatic iron deposition (92). Spleen stiffness has also been assessed with three-dimensional MR elastography (235), with liver stiffness and spleen stiffness significantly associated with the presence of esophageal varices.
Multifrequency MR Elastography
Generally, MR elastography examinations are performed by imaging shear waves at a single frequency (typically at 60 Hz). The stiffness of tissue is dependent on the frequency of the imaged waves, so examinations at a frequency other than 60 Hz will result in a different stiffness measurement. The use of multifrequency MR elastography, where acquisitions acquired at multiple frequencies are performed, may lead to the development of parameters that are independent of frequency through viscoelastic modeling (38,321,322) or via analysis of the regression line of stiffness and frequency (323). Another application of multifrequency data is combining the wave fields from each frequency to improve the resulting elastogram. This is achieved by accounting for areas of low displacement and wave nodes that are present in each wave field, but the location of which varies depending on frequency (324–326). A downside of the acquisition of multiple frequencies is the increased imaging time, as each additional frequency incrementally increases the imaging time limiting clinical adoption, and the associated challenges with increased wave attenuation at higher frequencies. Thus, the diagnostic benefit of multifrequency over single-frequency MR elastography must be established.
Conclusion
US and MR elastographic techniques have developed into accurate methods for quantitative, noninvasive diagnosis of liver fibrosis in a wide range of etiologies. Interpretation of results should take into account potential confounding factors of liver stiffness measurements, pitfalls, and technical limitations. MR elastography has equivalent to slightly better diagnostic accuracy than TE and ARFI methods, while providing stiffness measurement over a larger area of the liver; however, the method requires wider validation, and the higher cost and limited availability may limit adoption worldwide. In liver referral centers performing a large number of MR imaging examinations, it is feasible to incorporate MR elastography into the standard imaging protocols to provide a fibrosis-staging tool. The weight of published data on TE has allowed the establishment of measurement cutoffs for most etiologies. ARFI methods have shown similar diagnostic ability to TE, and it is reasonable to assume that once sufficient data have been acquired to fully validate ARFI methods they will also become a recommended noninvasive measurement tool for staging of liver fibrosis. The emergence of advanced techniques such as three-dimensional MR elastography– and US-based controlled attenuation parameter measurement may increase the accuracy of fibrosis and steatosis staging in liver disease, although more data are needed.
Essentials
■ Elastographic methods are accurate tools for diagnosing liver fibrosis and cirrhosis in a wide range of etiologies.
■ US-based transient elastography is the most validated elastographic technique.
■ Acoustic radiation force impulse elastographic methods are integrated into clinical US systems allowing elastography to be performed in routine clinical examinations.
■ MR elastography offers excellent diagnostic accuracy, although it is less well validated and less available than US elastographic methods.
■ Liver stiffness measurement can be affected by a variety of confounding factors, such as hepatic inflammation, congestion, cholestasis (for all elastographic methods), and steatosis (at least for transient elastography).
APPENDIX
Received March 29, 2017; revision requested May 3; final revision received July 20; accepted August 2; final version accepted September 7.
C.W.H. and C.B.S. supported by National Institute of Biomedical Imaging and Bioengineering (T32EB005970) and National Institute of Diabetes and Digestive and Kidney Diseases (R01DK087877, R01DK088925, R01DK106419). P.K. and B.T. supported by National Cancer Institute (U01 CA172320) and National Institute of Diabetes and Digestive and Kidney Diseases (R01DK087877).
Disclosures of Conflicts of Interest: P.K. disclosed no relevant relationships. M.W. Activities related to the present article: disclosed no relevant relationships. Activities not related to the present article: consultancy fees from Olea Medical. Other relationships: disclosed no relevant relationships. L.C. Activities related to the present article: disclosed no relevant relationships. Activities not related to the present article: lecture fees from Echosens. Other relationships: disclosed no relevant relationships. C.W.H. disclosed no relevant relationships. C.L.J. disclosed no relevant relationships. C.B.S. Activities related to the present article: disclosed no relevant relationships. Activities not related to the present article: grants from Gilead, GE Healthcare, Siemens, Boehringer Ingelheim Pharma; speaking services for GE Healthcare, Bayer; member of scientific committee/advisory board for Bayer and Advanced MR Analytics (AMRA); and lab service agreements with Gilead, Shire, Virtualscopics, Intercept. Other relationships: disclosed no relevant relationships. B.T. Activities related to the present article: disclosed no relevant relationships. Activities not related to the present article: grants from Guerbet and Bayer, equipment support from Siemens. Other relationships: disclosed no relevant relationships.
Abbreviations:
- ARFI
- acoustic radiation force impulse
- AUC
- area under the receiver operating characteristic curve
- GRE
- gradient recalled echo
- HBV
- hepatitis B virus
- HCC
- hepatocellular carcinoma
- HCV
- hepatitis C virus
- ICC
- intraclass correlation coefficient
- NAFLD
- nonalcoholic fatty liver disease
- NASH
- nonalcoholic steatohepatitis
- pSWE
- point SWE
- SWE
- shear-wave elastography
- TE
- transient elastography
- 2D
- two-dimensional
References
- 1.Tsochatzis EA, Bosch J, Burroughs AK. Liver cirrhosis. Lancet 2014;383(9930):1749–1761. [DOI] [PubMed] [Google Scholar]
- 2.Kim WR, Brown RS, Jr, Terrault NA, El-Serag H. Burden of liver disease in the United States: summary of a workshop. Hepatology 2002;36(1):227–242. [DOI] [PubMed] [Google Scholar]
- 3.Centers for Disease Control and Prevention . Chronic liver disease and cirrhosis. http://www.cdc.gov/nchs/fastats/liver-disease.htm. Accessed February 24, 2017.
- 4.Razavi H, Elkhoury AC, Elbasha E, et al. Chronic hepatitis C virus (HCV) disease burden and cost in the United States. Hepatology 2013;57(6):2164–2170. [DOI] [PMC free article] [PubMed] [Google Scholar]
- 5.Younossi ZM, Blissett D, Blissett R, et al. The economic and clinical burden of nonalcoholic fatty liver disease in the United States and Europe. Hepatology 2016;64(5):1577–1586. [DOI] [PubMed] [Google Scholar]
- 6.Sebastiani G, Gkouvatsos K, Pantopoulos K. Chronic hepatitis C and liver fibrosis. World J Gastroenterol 2014;20(32):11033–11053. [DOI] [PMC free article] [PubMed] [Google Scholar]
- 7.Calvaruso V, Craxì A. Regression of fibrosis after HBV antiviral therapy. Is cirrhosis reversible? Liver Int 2014;34(Suppl 1):85–90. [DOI] [PubMed] [Google Scholar]
- 8.Intraobserver and interobserver variations in liver biopsy interpretation in patients with chronic hepatitis C. The French METAVIR Cooperative Study Group. Hepatology 1994;20(1 Pt 1):15–20. [PubMed] [Google Scholar]
- 9.Brunt EM, Janney CG, Di Bisceglie AM, Neuschwander-Tetri BA, Bacon BR. Nonalcoholic steatohepatitis: a proposal for grading and staging the histological lesions. Am J Gastroenterol 1999;94(9):2467–2474. [DOI] [PubMed] [Google Scholar]
- 10.Bravo A, Sheth S, Chopra S. Liver biopsy. N Engl J Med 2001;344(7):465–500. [DOI] [PubMed] [Google Scholar]
- 11.Rockey DC, Caldwell SH, Goodman ZD, Nelson RC, Smith AD; American Association for the Study of Liver Diseases. Liver biopsy. Hepatology 2009;49(3):1017–1044. [DOI] [PubMed] [Google Scholar]
- 12.Bedossa P, Carrat F. Liver biopsy: the best, not the gold standard. J Hepatol 2009;50(1):1–3. [DOI] [PubMed] [Google Scholar]
- 13.Knodell RG, Ishak KG, Black WC, et al. Formulation and application of a numerical scoring system for assessing histological activity in asymptomatic chronic active hepatitis. Hepatology 1981;1(5):431–435. [DOI] [PubMed] [Google Scholar]
- 14.Ishak KG. Chronic hepatitis: morphology and nomenclature. Mod Pathol 1994;7(6):690–713. [PubMed] [Google Scholar]
- 15.Batts KP, Ludwig J. Chronic hepatitis: an update on terminology and reporting. Am J Surg Pathol 1995;19(12):1409–1417. [DOI] [PubMed] [Google Scholar]
- 16.Regev A, Berho M, Jeffers LJ, et al. Sampling error and intraobserver variation in liver biopsy in patients with chronic HCV infection. Am J Gastroenterol 2002;97(10):2614–2618. [DOI] [PubMed] [Google Scholar]
- 17.Bedossa P, Dargère D, Paradis V. Sampling variability of liver fibrosis in chronic hepatitis C. Hepatology 2003;38(6):1449–1457. [DOI] [PubMed] [Google Scholar]
- 18.Rousselet MC, Michalak S, Dupré F, et al. Sources of variability in histological scoring of chronic viral hepatitis. Hepatology 2005;41(2):257–264. [DOI] [PubMed] [Google Scholar]
- 19.Wai CT, Greenson JK, Fontana RJ, et al. A simple noninvasive index can predict both significant fibrosis and cirrhosis in patients with chronic hepatitis C. Hepatology 2003;38(2):518–526. [DOI] [PubMed] [Google Scholar]
- 20.Vallet-Pichard A, Mallet V, Nalpas B, et al. FIB-4: an inexpensive and accurate marker of fibrosis in HCV infection. comparison with liver biopsy and fibrotest. Hepatology 2007;46(1):32–36. [DOI] [PubMed] [Google Scholar]
- 21.Imbert-Bismut F, Ratziu V, Pieroni L, et al. Biochemical markers of liver fibrosis in patients with hepatitis C virus infection: a prospective study. Lancet 2001;357(9262):1069–1075. [DOI] [PubMed] [Google Scholar]
- 22.Rosenberg WM, Voelker M, Thiel R, et al. Serum markers detect the presence of liver fibrosis: a cohort study. Gastroenterology 2004;127(6):1704–1713. [DOI] [PubMed] [Google Scholar]
- 23.Calès P, Oberti F, Michalak S, et al. A novel panel of blood markers to assess the degree of liver fibrosis. Hepatology 2005;42(6):1373–1381. [DOI] [PubMed] [Google Scholar]
- 24.Parkes J, Guha IN, Roderick P, Rosenberg W. Performance of serum marker panels for liver fibrosis in chronic hepatitis C. J Hepatol 2006;44(3):462–474. [DOI] [PubMed] [Google Scholar]
- 25.Cui J, Ang B, Haufe W, et al. Comparative diagnostic accuracy of magnetic resonance elastography vs. eight clinical prediction rules for non-invasive diagnosis of advanced fibrosis in biopsy-proven non-alcoholic fatty liver disease: a prospective study. Aliment Pharmacol Ther 2015;41(12):1271–1280. [DOI] [PMC free article] [PubMed] [Google Scholar]
- 26.Ophir J, Céspedes I, Ponnekanti H, Yazdi Y, Li X. Elastography: a quantitative method for imaging the elasticity of biological tissues. Ultrason Imaging 1991;13(2):111–134. [DOI] [PubMed] [Google Scholar]
- 27.Sarvazyan AP, Rudenko OV, Swanson SD, Fowlkes JB, Emelianov SY. Shear wave elasticity imaging: a new ultrasonic technology of medical diagnostics. Ultrasound Med Biol 1998;24(9):1419–1435. [DOI] [PubMed] [Google Scholar]
- 28.Ferraioli G, Maiocchi L, Lissandrin R, et al. Accuracy of the ElastPQ technique for the assessment of Liver fibrosis in patients with chronic hepatitis C: a “real life” single center study. J Gastrointestin Liver Dis 2016;25(3):331–335. [DOI] [PubMed] [Google Scholar]
- 29.Mare R, Sporea I, Lupuşoru R, et al. The value of ElastPQ for the evaluation of liver stiffness in patients with B and C chronic hepatopathies. Ultrasonics 2017;77:144–151. [DOI] [PubMed] [Google Scholar]
- 30.Sporea I, Bende F, Sirli R, et al. The performance of 2D SWE.GE compared to transient elastography for the evaluation of liver stiffness. Ultraschall Med 2016;37(S 01):SL19_3. [Google Scholar]
- 31.Dietrich CF, Dong Y. Shear wave elastography with a new reliability indicator. J Ultrason 2016;16(66):281–287. [DOI] [PMC free article] [PubMed] [Google Scholar]
- 32.Yang YP, Xu XH, Guo LH, et al. Qualitative and quantitative analysis with a novel shear wave speed imaging for differential diagnosis of breast lesions. Sci Rep 2017;7:40964. [DOI] [PMC free article] [PubMed] [Google Scholar]
- 33.Mulazzani L, Salvatore V, Matassoni F, et al. Point shear wave ultrasound elastography to quantify liver stiffness with Esaote MyLab Twice compared to 2D-shear wave elastography with supersonic imaging. Ultraschall Med 2016;37(S 01):PS4_08. [Google Scholar]
- 34.Piscaglia F, Salvatore V, Mulazzani L, et al. Differences in liver stiffness values obtained with new ultrasound elastography machines and Fibroscan: a comparative study. Dig Liver Dis 2017;49(7):802–808. [DOI] [PubMed] [Google Scholar]
- 35.Dietrich CF, Bamber J, Berzigotti A, et al. EFSUMB Guidelines and Recommendations on the Clinical Use of Liver Ultrasound Elastography, Update 2017 (Long Version). Ultraschall Med 2017;38(04):e16–e47. [DOI] [PubMed] [Google Scholar]
- 36.Muthupillai R, Lomas DJ, Rossman PJ, Greenleaf JF, Manduca A, Ehman RL. Magnetic resonance elastography by direct visualization of propagating acoustic strain waves. Science 1995;269(5232):1854–1857. [DOI] [PubMed] [Google Scholar]
- 37.Sandrin L, Fourquet B, Hasquenoph JM, et al. Transient elastography: a new noninvasive method for assessment of hepatic fibrosis. Ultrasound Med Biol 2003;29(12):1705–1713. [DOI] [PubMed] [Google Scholar]
- 38.Asbach P, Klatt D, Schlosser B, et al. Viscoelasticity-based staging of hepatic fibrosis with multifrequency MR elastography. Radiology 2010;257(1):80–86. [DOI] [PubMed] [Google Scholar]
- 39.Barr RG, Ferraioli G, Palmeri ML, et al. Elastography assessment of liver fibrosis: Society of Radiologists in Ultrasound Consensus Conference Statement. Radiology 2015;276(3):845–861. [DOI] [PubMed] [Google Scholar]
- 40.Castéra L, Foucher J, Bernard PH, et al. Pitfalls of liver stiffness measurement: a 5-year prospective study of 13,369 examinations. Hepatology 2010;51(3):828–835. [DOI] [PubMed] [Google Scholar]
- 41.Myers RP, Pomier-Layrargues G, Kirsch R, et al. Feasibility and diagnostic performance of the FibroScan XL probe for liver stiffness measurement in overweight and obese patients. Hepatology 2012;55(1):199–208. [DOI] [PubMed] [Google Scholar]
- 42.Şirli R, Sporea I, Deleanu A, et al. Comparison between the M and XL probes for liver fibrosis assessment by transient elastography. Med Ultrason 2014;16(2):119–122. [DOI] [PubMed] [Google Scholar]
- 43.Wong VW, Vergniol J, Wong GL, et al. Liver stiffness measurement using XL probe in patients with nonalcoholic fatty liver disease. Am J Gastroenterol 2012;107(12):1862–1871. [DOI] [PubMed] [Google Scholar]
- 44.de Lédinghen V, Wong VW, Vergniol J, et al. Diagnosis of liver fibrosis and cirrhosis using liver stiffness measurement: comparison between M and XL probe of FibroScan®. J Hepatol 2012;56(4):833–839. [DOI] [PubMed] [Google Scholar]
- 45.Friedrich-Rust M, Hadji-Hosseini H, Kriener S, et al. Transient elastography with a new probe for obese patients for non-invasive staging of non-alcoholic steatohepatitis. Eur Radiol 2010;20(10):2390–2396. [DOI] [PubMed] [Google Scholar]
- 46.Yoneda M, Thomas E, Sclair SN, Grant TT, Schiff ER. Supersonic shear imaging and transient elastography with the XL probe accurately detect fibrosis in overweight or obese patients with chronic liver disease. Clin Gastroenterol Hepatol 2015;13(8):1502–1509.e5. [DOI] [PubMed] [Google Scholar]
- 47.Neukam K, Recio E, Camacho A, et al. Interobserver concordance in the assessment of liver fibrosis in HIV/HCV-coinfected patients using transient elastometry. Eur J Gastroenterol Hepatol 2010;22(7):801–807. [DOI] [PubMed] [Google Scholar]
- 48.Woo H, Lee JY, Yoon JH, Kim W, Cho B, Choi BI. Comparison of the reliability of acoustic radiation force impulse imaging and supersonic shear imaging in measurement of liver stiffness. Radiology 2015;277(3):881–886. [DOI] [PubMed] [Google Scholar]
- 49.Ferraioli G, Tinelli C, Zicchetti M, et al. Reproducibility of real-time shear wave elastography in the evaluation of liver elasticity. Eur J Radiol 2012;81(11):3102–3106. [DOI] [PubMed] [Google Scholar]
- 50.Ferraioli G, Tinelli C, Lissandrin R, et al. Ultrasound point shear wave elastography assessment of liver and spleen stiffness: effect of training on repeatability of measurements. Eur Radiol 2014;24(6):1283–1289. [DOI] [PubMed] [Google Scholar]
- 51.Quantitative Imaging Biomarkers Alliance . Ultrasound SWS Biomarker Ctte. http://qibawiki.rsna.org/index.php/Ultrasound_SWS_Biomarker_Ctte. Accessed March 5, 2017.
- 52.Yin M, Glaser KJ, Talwalkar JA, Chen J, Manduca A, Ehman RL. Hepatic MR elastography: clinical performance in a series of 1377 consecutive examinations. Radiology 2016;278(1):114–124. [DOI] [PMC free article] [PubMed] [Google Scholar]
- 53.Wagner M, Corcuera-Solano I, Lo G, et al. Technical failure of MR elastography examinations of the liver: experience from a large single-center study. Radiology 2017;284(2):401–412. [DOI] [PMC free article] [PubMed] [Google Scholar]
- 54.Joshi M, Dillman JR, Towbin AJ, Serai SD, Trout AT. MR elastography: high rate of technical success in pediatric and young adult patients. Pediatr Radiol 2017;47(7):838–843. [DOI] [PubMed] [Google Scholar]
- 55.Hines CD, Bley TA, Lindstrom MJ, Reeder SB. Repeatability of magnetic resonance elastography for quantification of hepatic stiffness. J Magn Reson Imaging 2010;31(3):725–731. [DOI] [PMC free article] [PubMed] [Google Scholar]
- 56.Yj Lee, Lee JM, Lee JE, et al. MR elastography for noninvasive assessment of hepatic fibrosis: reproducibility of the examination and reproducibility and repeatability of the liver stiffness value measurement. J Magn Reson Imaging 2014;39(2):326–331. [DOI] [PubMed] [Google Scholar]
- 57.Shi Y, Guo Q, Xia F, Sun J, Gao Y. Short- and midterm repeatability of magnetic resonance elastography in healthy volunteers at 3.0 T. Magn Reson Imaging 2014;32(6):665–670. [DOI] [PubMed] [Google Scholar]
- 58.Shire NJ, Yin M, Chen J, et al. Test-retest repeatability of MR elastography for noninvasive liver fibrosis assessment in hepatitis C. J Magn Reson Imaging 2011;34(4):947–955. [DOI] [PMC free article] [PubMed] [Google Scholar]
- 59.Jajamovich GH, Dyvorne H, Donnerhack C, Taouli B. Quantitative liver MRI combining phase contrast imaging, elastography, and DWI: assessment of reproducibility and postprandial effect at 3.0 T. PLoS One 2014;9(5):e97355. [DOI] [PMC free article] [PubMed] [Google Scholar]
- 60.Serai SD, Obuchowski NA, Venkatesh SK, et al. Repeatability of MR elastography of liver: a meta-analysis. Radiology 2017;285(1):92–100. [DOI] [PMC free article] [PubMed] [Google Scholar]
- 61.Lee DH, Lee JM, Han JK, Choi BI. MR elastography of healthy liver parenchyma: normal value and reliability of the liver stiffness value measurement. J Magn Reson Imaging 2013;38(5):1215–1223. [DOI] [PubMed] [Google Scholar]
- 62.Yasar TK, Wagner M, Bane O, et al. Interplatform reproducibility of liver and spleen stiffness measured with MR elastography. J Magn Reson Imaging 2016;43(5):1064–1072. [DOI] [PMC free article] [PubMed] [Google Scholar]
- 63.Serai SD, Yin M, Wang H, Ehman RL, Podberesky DJ. Cross-vendor validation of liver magnetic resonance elastography. Abdom Imaging 2015;40(4):789–794. [DOI] [PMC free article] [PubMed] [Google Scholar]
- 64.Trout AT, Serai S, Mahley AD, et al. Liver stiffness measurements with MR elastography: agreement and repeatability across imaging systems, field strengths, and pulse sequences. Radiology 2016;281(3):793–804. [DOI] [PubMed] [Google Scholar]
- 65.Quantitative Imaging Biomarkers Alliance . MRE Biomarker Ctte. http://qibawiki.rsna.org/index.php/MRE_Biomarker_Ctte. Accessed March 4, 2017.
- 66.Ziol M, Handra-Luca A, Kettaneh A, et al. Noninvasive assessment of liver fibrosis by measurement of stiffness in patients with chronic hepatitis C. Hepatology 2005;41(1):48–54. [DOI] [PubMed] [Google Scholar]
- 67.Castéra L, Vergniol J, Foucher J, et al. Prospective comparison of transient elastography, Fibrotest, APRI, and liver biopsy for the assessment of fibrosis in chronic hepatitis C. Gastroenterology 2005;128(2):343–350. [DOI] [PubMed] [Google Scholar]
- 68.Lupsor Platon M, Stefanescu H, Feier D, Maniu A, Badea R. Performance of unidimensional transient elastography in staging chronic hepatitis C: results from a cohort of 1,202 biopsied patients from one single center. J Gastrointestin Liver Dis 2013;22(2):157–166. [PubMed] [Google Scholar]
- 69.Zarski JP, Sturm N, Guechot J, et al. Comparison of nine blood tests and transient elastography for liver fibrosis in chronic hepatitis C: the ANRS HCEP-23 study. J Hepatol 2012;56(1):55–62. [DOI] [PubMed] [Google Scholar]
- 70.Marcellin P, Ziol M, Bedossa P, et al. Non-invasive assessment of liver fibrosis by stiffness measurement in patients with chronic hepatitis B. Liver Int 2009;29(2):242–247. [DOI] [PubMed] [Google Scholar]
- 71.Castéra L, Bernard PH, Le Bail B, et al. Transient elastography and biomarkers for liver fibrosis assessment and follow-up of inactive hepatitis B carriers. Aliment Pharmacol Ther 2011;33(4):455–465. [DOI] [PubMed] [Google Scholar]
- 72.Leung VY, Shen J, Wong VW, et al. Quantitative elastography of liver fibrosis and spleen stiffness in chronic hepatitis B carriers: comparison of shear-wave elastography and transient elastography with liver biopsy correlation. Radiology 2013;269(3):910–918. [DOI] [PubMed] [Google Scholar]
- 73.Cardoso AC, Carvalho-Filho RJ, Stern C, et al. Direct comparison of diagnostic performance of transient elastography in patients with chronic hepatitis B and chronic hepatitis C. Liver Int 2012;32(4):612–621. [DOI] [PubMed] [Google Scholar]
- 74.Afdhal NH, Bacon BR, Patel K, et al. Accuracy of fibroscan, compared with histology, in analysis of liver fibrosis in patients with hepatitis B or C: a United States multicenter study. Clin Gastroenterol Hepatol 2015;13(4):772–779.e1–e3. [DOI] [PubMed] [Google Scholar]
- 75.Degos F, Perez P, Roche B, et al. Diagnostic accuracy of FibroScan and comparison to liver fibrosis biomarkers in chronic viral hepatitis: a multicenter prospective study (the FIBROSTIC study). J Hepatol 2010;53(6):1013–1021. [DOI] [PubMed] [Google Scholar]
- 76.Loong TC, Wei JL, Leung JC, et al. Application of the combined FibroMeter vibration-controlled transient elastography algorithm in Chinese patients with non-alcoholic fatty liver disease. J Gastroenterol Hepatol 2017;32(7):1363–1369. [DOI] [PubMed] [Google Scholar]
- 77.Cassinotto C, Boursier J, de Lédinghen V, et al. Liver stiffness in nonalcoholic fatty liver disease: A comparison of supersonic shear imaging, FibroScan, and ARFI with liver biopsy. Hepatology 2016;63(6):1817–1827. [DOI] [PubMed] [Google Scholar]
- 78.Sporea I, Sirli R, Bota S, et al. Is ARFI elastography reliable for predicting fibrosis severity in chronic HCV hepatitis? World J Radiol 2011;3(7):188–193. [DOI] [PMC free article] [PubMed] [Google Scholar]
- 79.Friedrich-Rust M, Lupsor M, de Knegt R, et al. Point shear wave elastography by acoustic radiation force impulse quantification in comparison to transient elastography for the non-invasive assessment of liver fibrosis in chronic hepatitis C: a prospective international multicenter study. Ultraschall Med 2015;36(3):239–247. [DOI] [PubMed] [Google Scholar]
- 80.Ye XP, Ran HT, Cheng J, et al. Liver and spleen stiffness measured by acoustic radiation force impulse elastography for noninvasive assessment of liver fibrosis and esophageal varices in patients with chronic hepatitis B. J Ultrasound Med 2012;31(8):1245–1253. [DOI] [PubMed] [Google Scholar]
- 81.Cui J, Heba E, Hernandez C, et al. Magnetic resonance elastography is superior to acoustic radiation force impulse for the diagnosis of fibrosis in patients with biopsy-proven nonalcoholic fatty liver disease: a prospective study. Hepatology 2016;63(2):453–461. [DOI] [PMC free article] [PubMed] [Google Scholar]
- 82.Ferraioli G, Tinelli C, Dal Bello B, et al. Accuracy of real-time shear wave elastography for assessing liver fibrosis in chronic hepatitis C: a pilot study. Hepatology 2012;56(6):2125–2133. [DOI] [PubMed] [Google Scholar]
- 83.Zhuang Y, Ding H, Zhang Y, Sun H, Xu C, Wang W. Two-dimensional shear-wave elastography performance in the noninvasive evaluation of liver fibrosis in patients with chronic hepatitis B: comparison with serum fibrosis indexes. Radiology 2017;283(3):873–882. [DOI] [PubMed] [Google Scholar]
- 84.Yin M, Talwalkar JA, Glaser KJ, et al. Assessment of hepatic fibrosis with magnetic resonance elastography. Clin Gastroenterol Hepatol 2007;5(10):1207–1213.e2. [DOI] [PMC free article] [PubMed] [Google Scholar]
- 85.Huwart L, Sempoux C, Vicaut E, et al. Magnetic resonance elastography for the noninvasive staging of liver fibrosis. Gastroenterology 2008;135(1):32–40. [DOI] [PubMed] [Google Scholar]
- 86.Wang Y, Ganger DR, Levitsky J, et al. Assessment of chronic hepatitis and fibrosis: comparison of MR elastography and diffusion-weighted imaging. AJR Am J Roentgenol 2011;196(3):553–561. [DOI] [PMC free article] [PubMed] [Google Scholar]
- 87.Dyvorne HA, Jajamovich GH, Bane O, et al. Prospective comparison of magnetic resonance imaging to transient elastography and serum markers for liver fibrosis detection. Liver Int 2016;36(5):659–666. [DOI] [PMC free article] [PubMed] [Google Scholar]
- 88.Chen J, Yin M, Talwalkar JA, et al. Diagnostic performance of MR elastography and vibration-controlled transient elastography in the detection of hepatic fibrosis in patients with severe to morbid obesity. Radiology 2017;283(2):418–428. [DOI] [PMC free article] [PubMed] [Google Scholar]
- 89.Ichikawa S, Motosugi U, Ichikawa T, et al. Magnetic resonance elastography for staging liver fibrosis in chronic hepatitis C. Magn Reson Med Sci 2012;11(4):291–297. [DOI] [PubMed] [Google Scholar]
- 90.Shi Y, Guo Q, Xia F, et al. MR elastography for the assessment of hepatic fibrosis in patients with chronic hepatitis B infection: does histologic necroinflammation influence the measurement of hepatic stiffness? Radiology 2014;273(1):88–98. [DOI] [PMC free article] [PubMed] [Google Scholar]
- 91.Chang W, Lee JM, Yoon JH, et al. Liver fibrosis staging with MR elastography: comparison of diagnostic performance between patients with chronic hepatitis B and those with other etiologic causes. Radiology 2016;280(1):88–97. [DOI] [PubMed] [Google Scholar]
- 92.Shi Y, Xia F, Li QJ, et al. Magnetic resonance elastography for the evaluation of liver fibrosis in chronic hepatitis B and C by using both gradient-recalled echo and spin-echo echo planar imaging: a prospective study. Am J Gastroenterol 2016;111(6):823–833. [DOI] [PubMed] [Google Scholar]
- 93.Loomba R, Wolfson T, Ang B, et al. Magnetic resonance elastography predicts advanced fibrosis in patients with nonalcoholic fatty liver disease: a prospective study. Hepatology 2014;60(6):1920–1928. [DOI] [PMC free article] [PubMed] [Google Scholar]
- 94.Imajo K, Kessoku T, Honda Y, et al. Magnetic resonance imaging more accurately classifies steatosis and fibrosis in patients with nonalcoholic fatty liver disease than transient elastography. Gastroenterology 2016;150(3):626–637.e7. [DOI] [PubMed] [Google Scholar]
- 95.Suwanthawornkul T, Anothaisintawee T, Sobhonslidsuk A, Thakkinstian A, Teerawattananon Y. Efficacy of second generation direct-acting antiviral agents for treatment naïve hepatitis C genotype 1: a systematic review and network meta-analysis. PLoS One 2015;10(12):e0145953. [DOI] [PMC free article] [PubMed] [Google Scholar]
- 96.European Association for the Study of the Liver . Electronic address: easloffice@easloffice.eu. EASL recommendations on treatment of hepatitis C 2016. J Hepatol 2017;66(1):153–194. [DOI] [PubMed]
- 97.Gonzalez HC, Jafri SM, Gordon SC. Role of liver biopsy in the era of direct-acting antivirals. Curr Gastroenterol Rep 2013;15(2):307. [DOI] [PubMed] [Google Scholar]
- 98.Terrault NA, Bzowej NH, Chang KM, et al. AASLD guidelines for treatment of chronic hepatitis B. Hepatology 2016;63(1):261–283. [DOI] [PMC free article] [PubMed] [Google Scholar]
- 99.Saito H, Tada S, Nakamoto N, et al. Efficacy of non-invasive elastometry on staging of hepatic fibrosis. Hepatol Res 2004;29(2):97–103. [DOI] [PubMed] [Google Scholar]
- 100.Castera L. Noninvasive methods to assess liver disease in patients with hepatitis B or C. Gastroenterology 2012;142(6):1293–1302.e4. [DOI] [PubMed] [Google Scholar]
- 101.Oliveri F, Coco B, Ciccorossi P, et al. Liver stiffness in the hepatitis B virus carrier: a non-invasive marker of liver disease influenced by the pattern of transaminases. World J Gastroenterol 2008;14(40):6154–6162. [DOI] [PMC free article] [PubMed] [Google Scholar]
- 102.Li Y, Huang YS, Wang ZZ, et al. Systematic review with meta-analysis: the diagnostic accuracy of transient elastography for the staging of liver fibrosis in patients with chronic hepatitis B. Aliment Pharmacol Ther 2016;43(4):458–469. [DOI] [PubMed] [Google Scholar]
- 103.Njei B, McCarty TR, Luk J, Ewelukwa O, Ditah I, Lim JK. Use of transient elastography in patients with HIV-HCV coinfection: a systematic review and meta-analysis. J Gastroenterol Hepatol 2016;31(10):1684–1693. [DOI] [PMC free article] [PubMed] [Google Scholar]
- 104.Chon YE, Choi EH, Song KJ, et al. Performance of transient elastography for the staging of liver fibrosis in patients with chronic hepatitis B: a meta-analysis. PLoS One 2012;7(9):e44930. [DOI] [PMC free article] [PubMed] [Google Scholar]
- 105.Tsochatzis EA, Gurusamy KS, Ntaoula S, Cholongitas E, Davidson BR, Burroughs AK. Elastography for the diagnosis of severity of fibrosis in chronic liver disease: a meta-analysis of diagnostic accuracy. J Hepatol 2011;54(4):650–659. [DOI] [PubMed] [Google Scholar]
- 106.Stebbing J, Farouk L, Panos G, et al. A meta-analysis of transient elastography for the detection of hepatic fibrosis. J Clin Gastroenterol 2010;44(3):214–219. [DOI] [PubMed] [Google Scholar]
- 107.Friedrich-Rust M, Ong MF, Martens S, et al. Performance of transient elastography for the staging of liver fibrosis: a meta-analysis. Gastroenterology 2008;134(4):960–974. [DOI] [PubMed] [Google Scholar]
- 108.Talwalkar JA, Kurtz DM, Schoenleber SJ, West CP, Montori VM. Ultrasound-based transient elastography for the detection of hepatic fibrosis: systematic review and meta-analysis. Clin Gastroenterol Hepatol 2007;5(10):1214–1220. [DOI] [PubMed] [Google Scholar]
- 109.Shaheen AA, Wan AF, Myers RP. FibroTest and FibroScan for the prediction of hepatitis C-related fibrosis: a systematic review of diagnostic test accuracy. Am J Gastroenterol 2007;102(11):2589–2600. [DOI] [PubMed] [Google Scholar]
- 110.European Association for Study of Liver; Asociacion Latinoamericana para el Estudio del Higado . EASL-ALEH clinical practice guidelines: non-invasive tests for evaluation of liver disease severity and prognosis. J Hepatol 2015;63(1):237–264. [DOI] [PubMed] [Google Scholar]
- 111.Calès P, Boursier J, Lebigot J, et al. Liver fibrosis diagnosis by blood test and elastography in chronic hepatitis C: agreement or combination? Aliment Pharmacol Ther 2017;45(7):991–1003. [DOI] [PubMed] [Google Scholar]
- 112.Dong DR, Hao MN, Li C, et al. Acoustic radiation force impulse elastography, FibroScan®, Forns’ index and their combination in the assessment of liver fibrosis in patients with chronic hepatitis B, and the impact of inflammatory activity and steatosis on these diagnostic methods. Mol Med Rep 2015;11(6):4174–4182. [DOI] [PMC free article] [PubMed] [Google Scholar]
- 113.Friedrich-Rust M, Buggisch P, de Knegt RJ, et al. Acoustic radiation force impulse imaging for non-invasive assessment of liver fibrosis in chronic hepatitis B. J Viral Hepat 2013;20(4):240–247. [DOI] [PubMed] [Google Scholar]
- 114.Liu Y, Dong CF, Yang G, et al. Optimal linear combination of ARFI, transient elastography and APRI for the assessment of fibrosis in chronic hepatitis B. Liver Int 2015;35(3):816–825. [DOI] [PubMed] [Google Scholar]
- 115.Park MS, Kim SW, Yoon KT, et al. Factors influencing the diagnostic accuracy of acoustic radiation force impulse elastography in patients with chronic hepatitis B. Gut Liver. 2016;10(2):275–282. [DOI] [PMC free article] [PubMed] [Google Scholar]
- 116.Tai DI, Tsay PK, Jeng WJ, et al. Differences in liver fibrosis between patients with chronic hepatitis B and C: evaluation by acoustic radiation force impulse measurements at 2 locations. J Ultrasound Med 2015;34(5):813–821. [DOI] [PubMed] [Google Scholar]
- 117.Ye XP, Ran HT, Cheng J, et al. Liver and spleen stiffness measured by acoustic radiation force impulse elastography for noninvasive assessment of liver fibrosis and esophageal varices in patients with chronic hepatitis B. J Ultrasound Med 2012;31(8):1245–1253. [DOI] [PubMed] [Google Scholar]
- 118.Zhang D, Chen M, Wang R, et al. Comparison of acoustic radiation force impulse imaging and transient elastography for non-invasive assessment of liver fibrosis in patients with chronic hepatitis B. Ultrasound Med Biol 2015;41(1):7–14. [DOI] [PubMed] [Google Scholar]
- 119.Conti F, Serra C, Vukotic R, et al. Accuracy of elastography point quantification and steatosis influence on assessing liver fibrosis in patients with chronic hepatitis C. Liver Int 2017;37(2):187–195. [DOI] [PubMed] [Google Scholar]
- 120.Chen SH, Peng CY, Lai HC, et al. Head-to-head comparison between collagen proportionate area and acoustic radiation force impulse elastography in liver fibrosis quantification in chronic hepatitis C. PLoS One 2015;10(10):e0140554. [DOI] [PMC free article] [PubMed] [Google Scholar]
- 121.Li SM, Li GX, Fu DM, Wang Y, Dang LQ. Liver fibrosis evaluation by ARFI and APRI in chronic hepatitis C. World J Gastroenterol 2014;20(28):9528–9533. [DOI] [PMC free article] [PubMed] [Google Scholar]
- 122.Nishikawa T, Hashimoto S, Kawabe N, et al. Factors correlating with acoustic radiation force impulse elastography in chronic hepatitis C. World J Gastroenterol 2014;20(5):1289–1297. [DOI] [PMC free article] [PubMed] [Google Scholar]
- 123.Silva Junior RG, Schmillevitch J, MdeF Nascimento, et al. Acoustic radiation force impulse elastography and serum fibrosis markers in chronic hepatitis C. Scand J Gastroenterol 2014;49(8):986–992. [DOI] [PubMed] [Google Scholar]
- 124.Yamada R, Hiramatsu N, Oze T, et al. Significance of liver stiffness measurement by acoustic radiation force impulse (ARFI) among hepatitis C patients. J Med Virol 2014;86(2):241–247. [DOI] [PubMed] [Google Scholar]
- 125.Takaki S, Kawakami Y, Miyaki D, et al. Non-invasive liver fibrosis score calculated by combination of virtual touch tissue quantification and serum liver functional tests in chronic hepatitis C patients. Hepatol Res 2014;44(3):280–287. [DOI] [PubMed] [Google Scholar]
- 126.Chen SH, Li YF, Lai HC, et al. Effects of patient factors on noninvasive liver stiffness measurement using acoustic radiation force impulse elastography in patients with chronic hepatitis C. BMC Gastroenterol 2012;12:105. [DOI] [PMC free article] [PubMed] [Google Scholar]
- 127.Lupsor M, Badea R, Stefanescu H, et al. Performance of a new elastographic method (ARFI technology) compared to unidimensional transient elastography in the noninvasive assessment of chronic hepatitis C: preliminary results. J Gastrointestin Liver Dis 2009;18(3):303–310. [PubMed] [Google Scholar]
- 128.Hu X, Qiu L, Liu D, Qian L. Acoustic radiation force impulse (ARFI) elastography for non-invasive evaluation of hepatic fibrosis in chronic hepatitis B and C patients: a systematic review and meta-analysis. Med Ultrason 2017;19(1):23–31. [DOI] [PubMed] [Google Scholar]
- 129.Summers JA, Radhakrishnan M, Morris E, et al. Virtual Touch™ quantification to diagnose and monitor liver fibrosis in hepatitis B and hepatitis C: a NICE medical technology guidance. Appl Health Econ Health Policy 2017;15(2):139–154. [DOI] [PMC free article] [PubMed] [Google Scholar]
- 130.Verlinden W, Bourgeois S, Gigase P, et al. Liver fibrosis evaluation using real-time shear wave elastography in hepatitis C-monoinfected and human immunodeficiency virus/hepatitis C-coinfected patients. J Ultrasound Med 2016;35(6):1299–1308. [DOI] [PubMed] [Google Scholar]
- 131.Tada T, Kumada T, Toyoda H, et al. Utility of real-time shear wave elastography for assessing liver fibrosis in patients with chronic hepatitis C infection without cirrhosis: Comparison of liver fibrosis indices. Hepatol Res 2015;45(10):E122–E129. [DOI] [PubMed] [Google Scholar]
- 132.Zeng J, Liu GJ, Huang ZP, et al. Diagnostic accuracy of two-dimensional shear wave elastography for the non-invasive staging of hepatic fibrosis in chronic hepatitis B: a cohort study with internal validation. Eur Radiol 2014;24(10):2572–2581. [DOI] [PubMed] [Google Scholar]
- 133.Deffieux T, Gennisson JL, Bousquet L, et al. Investigating liver stiffness and viscosity for fibrosis, steatosis and activity staging using shear wave elastography. J Hepatol 2015;62(2):317–324. [DOI] [PubMed] [Google Scholar]
- 134.Jiang T, Tian G, Zhao Q, et al. Diagnostic accuracy of 2D-shear wave elastography for liver fibrosis severity: a meta-analysis. PLoS One 2016;11(6):e0157219. [DOI] [PMC free article] [PubMed] [Google Scholar]
- 135.Godfrey EM, Patterson AJ, Priest AN, et al. A comparison of MR elastography and 31P MR spectroscopy with histological staging of liver fibrosis. Eur Radiol 2012;22(12):2790–2797. [DOI] [PubMed] [Google Scholar]
- 136.Rouvière O, Yin M, Dresner MA, et al. MR elastography of the liver: preliminary results. Radiology 2006;240(2):440–448. [DOI] [PubMed] [Google Scholar]
- 137.Rustogi R, Horowitz J, Harmath C, et al. Accuracy of MR elastography and anatomic MR imaging features in the diagnosis of severe hepatic fibrosis and cirrhosis. J Magn Reson Imaging 2012;35(6):1356–1364. [DOI] [PMC free article] [PubMed] [Google Scholar]
- 138.Yoon JH, Lee JM, Joo I, et al. Hepatic fibrosis: prospective comparison of MR elastography and US shear-wave elastography for evaluation. Radiology 2014;273(3):772–782. [DOI] [PubMed] [Google Scholar]
- 139.Takamura T, Motosugi U, Ichikawa S, et al. Usefulness of MR elastography for detecting clinical progression of cirrhosis from child-pugh class A to B in patients with type C viral hepatitis. J Magn Reson Imaging 2016;44(3):715–722. [DOI] [PubMed] [Google Scholar]
- 140.Hennedige TP, Wang G, Leung FP, et al. Magnetic resonance elastography and diffusion weighted imaging in the evaluation of hepatic fibrosis in chronic hepatitis B. Gut Liver 2017;11(3):401–408. [DOI] [PMC free article] [PubMed] [Google Scholar]
- 141.Wu WP, Chou CT, Chen RC, Lee CW, Lee KW, Wu HK. Non-invasive evaluation of hepatic fibrosis: the diagnostic performance of magnetic resonance elastography in patients with viral hepatitis B or C. PLoS One 2015;10(10):e0140068. [DOI] [PMC free article] [PubMed] [Google Scholar]
- 142.Venkatesh SK, Xu S, Tai D, Yu H, Wee A. Correlation of MR elastography with morphometric quantification of liver fibrosis (Fibro-C-Index) in chronic hepatitis B. Magn Reson Med 2014;72(4):1123–1129. [DOI] [PubMed] [Google Scholar]
- 143.Venkatesh SK, Wang G, Lim SG, Wee A. Magnetic resonance elastography for the detection and staging of liver fibrosis in chronic hepatitis B. Eur Radiol 2014;24(1):70–78. [DOI] [PubMed] [Google Scholar]
- 144.Lee VS, Miller FH, Omary RA, et al. Magnetic resonance elastography and biomarkers to assess fibrosis from recurrent hepatitis C in liver transplant recipients. Transplantation 2011;92(5):581–586. [DOI] [PubMed] [Google Scholar]
- 145.Singh S, Venkatesh SK, Wang Z, et al. Diagnostic performance of magnetic resonance elastography in staging liver fibrosis: a systematic review and meta-analysis of individual participant data. Clin Gastroenterol Hepatol 2015;13(3):440–451.e6. [DOI] [PMC free article] [PubMed] [Google Scholar]
- 146.Ichikawa S, Motosugi U, Nakazawa T, et al. Hepatitis activity should be considered a confounder of liver stiffness measured with MR elastography. J Magn Reson Imaging 2015;41(5):1203–1208. [DOI] [PubMed] [Google Scholar]
- 147.Yin M, Glaser KJ, Manduca A, et al. Distinguishing between hepatic inflammation and fibrosis with MR elastography. Radiology 2017;284(3):694–705. [DOI] [PMC free article] [PubMed] [Google Scholar]
- 148.Bohte AE, de Niet A, Jansen L, et al. Non-invasive evaluation of liver fibrosis: a comparison of ultrasound-based transient elastography and MR elastography in patients with viral hepatitis B and C. Eur Radiol 2014;24(3):638–648. [DOI] [PubMed] [Google Scholar]
- 149.Vernon G, Baranova A, Younossi ZM. Systematic review: the epidemiology and natural history of non-alcoholic fatty liver disease and non-alcoholic steatohepatitis in adults. Aliment Pharmacol Ther 2011;34(3):274–285. [DOI] [PubMed] [Google Scholar]
- 150.Younossi ZM, Stepanova M, Afendy M, et al. Changes in the prevalence of the most common causes of chronic liver diseases in the United States from 1988 to 2008. Clin Gastroenterol Hepatol 2011;9(6):524–530.e1; quiz e60. [DOI] [PubMed] [Google Scholar]
- 151.Ekstedt M, Hagström H, Nasr P, et al. Fibrosis stage is the strongest predictor for disease-specific mortality in NAFLD after up to 33 years of follow-up. Hepatology 2015;61(5):1547–1554. [DOI] [PubMed] [Google Scholar]
- 152.European Association for the Study of the Liver (EASL) ; European Association for the Study of Diabetes (EASD) ; European Association for the Study of Obesity (EASO) . EASL-EASD-EASO clinical practice guidelines for the management of non-alcoholic fatty liver disease. J Hepatol 2016;64(6):1388–1402. [DOI] [PubMed] [Google Scholar]
- 153.Nobili V, Vizzutti F, Arena U, et al. Accuracy and reproducibility of transient elastography for the diagnosis of fibrosis in pediatric nonalcoholic steatohepatitis. Hepatology 2008;48(2):442–448. [DOI] [PubMed] [Google Scholar]
- 154.Kwok R, Tse YK, Wong GL, et al. Systematic review with meta-analysis: non-invasive assessment of non-alcoholic fatty liver disease—the role of transient elastography and plasma cytokeratin-18 fragments. Aliment Pharmacol Ther 2014;39(3):254–269. [DOI] [PubMed] [Google Scholar]
- 155.Puigvehí M, Broquetas T, Coll S, et al. Impact of anthropometric features on the applicability and accuracy of FibroScan(®) (M and XL) in overweight/obese patients. J Gastroenterol Hepatol 2017;32(10):1746–1753. [DOI] [PubMed] [Google Scholar]
- 156.Yoneda M, Suzuki K, Kato S, et al. Nonalcoholic fatty liver disease: US-based acoustic radiation force impulse elastography. Radiology 2010;256(2):640–647. [DOI] [PubMed] [Google Scholar]
- 157.Fierbinteanu Braticevici C, Sporea I, Panaitescu E, Tribus L. Value of acoustic radiation force impulse imaging elastography for non-invasive evaluation of patients with nonalcoholic fatty liver disease. Ultrasound Med Biol 2013;39(11):1942–1950. [DOI] [PubMed] [Google Scholar]
- 158.Guzmán-Aroca F, Frutos-Bernal MD, Bas A, et al. Detection of non-alcoholic steatohepatitis in patients with morbid obesity before bariatric surgery: preliminary evaluation with acoustic radiation force impulse imaging. Eur Radiol 2012;22(11):2525–2532. [DOI] [PubMed] [Google Scholar]
- 159.Palmeri ML, Wang MH, Rouze NC, et al. Noninvasive evaluation of hepatic fibrosis using acoustic radiation force-based shear stiffness in patients with nonalcoholic fatty liver disease. J Hepatol 2011;55(3):666–672. [DOI] [PMC free article] [PubMed] [Google Scholar]
- 160.Friedrich-Rust M, Romen D, Vermehren J, et al. Acoustic radiation force impulse-imaging and transient elastography for non-invasive assessment of liver fibrosis and steatosis in NAFLD. Eur J Radiol 2012;81(3):e325–e331. [DOI] [PubMed] [Google Scholar]
- 161.Chen J, Talwalkar JA, Yin M, Glaser KJ, Sanderson SO, Ehman RL. Early detection of nonalcoholic steatohepatitis in patients with nonalcoholic fatty liver disease by using MR elastography. Radiology 2011;259(3):749–756. [DOI] [PMC free article] [PubMed] [Google Scholar]
- 162.Kim D, Kim WR, Talwalkar JA, Kim HJ, Ehman RL. Advanced fibrosis in nonalcoholic fatty liver disease: noninvasive assessment with MR elastography. Radiology 2013;268(2):411–419. [DOI] [PMC free article] [PubMed] [Google Scholar]
- 163.Loomba R, Cui J, Wolfson T, et al. Novel 3D magnetic resonance elastography for the noninvasive diagnosis of advanced fibrosis in NAFLD: a prospective study. Am J Gastroenterol 2016;111(7):986–994. [DOI] [PMC free article] [PubMed] [Google Scholar]
- 164.Park CC, Nguyen P, Hernandez C, et al. Magnetic resonance elastography vs transient elastography in detection of fibrosis and noninvasive measurement of steatosis in patients with biopsy-proven nonalcoholic fatty liver disease. Gastroenterology 2017;152(3):598–607.e2. [DOI] [PMC free article] [PubMed] [Google Scholar]
- 165.Singh S, Venkatesh SK, Loomba R, et al. Magnetic resonance elastography for staging liver fibrosis in non-alcoholic fatty liver disease: a diagnostic accuracy systematic review and individual participant data pooled analysis. Eur Radiol 2016;26(5):1431–1440. [DOI] [PMC free article] [PubMed] [Google Scholar]
- 166.Xu Q, Sheng L, Bao H, et al. Evaluation of transient elastography in assessing liver fibrosis in patients with autoimmune hepatitis. J Gastroenterol Hepatol 2017;32(3):639–644. [DOI] [PubMed] [Google Scholar]
- 167.Hartl J, Denzer U, Ehlken H, et al. Transient elastography in autoimmune hepatitis: timing determines the impact of inflammation and fibrosis. J Hepatol 2016;65(4):769–775. [DOI] [PubMed] [Google Scholar]
- 168.Yada N, Sakurai T, Minami T, et al. Influence of liver inflammation on liver stiffness measurement in patients with autoimmune hepatitis evaluation by combinational elastography. Oncology 2017;92(Suppl 1):10–15. [DOI] [PubMed] [Google Scholar]
- 169.Corpechot C, Carrat F, Poujol-Robert A, et al. Noninvasive elastography-based assessment of liver fibrosis progression and prognosis in primary biliary cirrhosis. Hepatology 2012;56(1):198–208. [DOI] [PubMed] [Google Scholar]
- 170.Floreani A, Cazzagon N, Martines D, Cavalletto L, Baldo V, Chemello L. Performance and utility of transient elastography and noninvasive markers of liver fibrosis in primary biliary cirrhosis. Dig Liver Dis 2011;43(11):887–892. [DOI] [PubMed] [Google Scholar]
- 171.Gómez-Dominguez E, Mendoza J, García-Buey L, et al. Transient elastography to assess hepatic fibrosis in primary biliary cirrhosis. Aliment Pharmacol Ther 2008;27(5):441–447. [DOI] [PubMed] [Google Scholar]
- 172.Corpechot C, Gaouar F, El Naggar A, et al. Baseline values and changes in liver stiffness measured by transient elastography are associated with severity of fibrosis and outcomes of patients with primary sclerosing cholangitis. Gastroenterology 2014;146(4):970–979; quiz e15–e16. [DOI] [PubMed] [Google Scholar]
- 173.Ehlken H, Wroblewski R, Corpechot C, et al. Validation of transient elastography and comparison with spleen length measurement for staging of fibrosis and clinical prognosis in primary sclerosing cholangitis. PLoS One 2016;11(10):e0164224. [DOI] [PMC free article] [PubMed] [Google Scholar]
- 174.Fernandez M, Trépo E, Degré D, et al. Transient elastography using Fibroscan is the most reliable noninvasive method for the diagnosis of advanced fibrosis and cirrhosis in alcoholic liver disease. Eur J Gastroenterol Hepatol 2015;27(9):1074–1079. [DOI] [PubMed] [Google Scholar]
- 175.Nahon P, Kettaneh A, Tengher-Barna I, et al. Assessment of liver fibrosis using transient elastography in patients with alcoholic liver disease. J Hepatol 2008;49(6):1062–1068. [DOI] [PubMed] [Google Scholar]
- 176.Thiele M, Detlefsen S, Sevelsted Møller L, et al. Transient and 2-dimensional shear-wave elastography provide comparable assessment of alcoholic liver fibrosis and cirrhosis. Gastroenterology 2016;150(1):123–133. [DOI] [PubMed] [Google Scholar]
- 177.Attia D, Pischke S, Negm AA, et al. Changes in liver stiffness using acoustic radiation force impulse imaging in patients with obstructive cholestasis and cholangitis. Dig Liver Dis 2014;46(7):625–631. [DOI] [PubMed] [Google Scholar]
- 178.Kiani A, Brun V, Lainé F, et al. Acoustic radiation force impulse imaging for assessing liver fibrosis in alcoholic liver disease. World J Gastroenterol 2016;22(20):4926–4935. [DOI] [PMC free article] [PubMed] [Google Scholar]
- 179.Mjelle AB, Mulabecirovic A, Hausken T, Havre RF, Gilja OH, Vesterhus M. Ultrasound and point shear wave elastography in livers of patients with primary sclerosing cholangitis. Ultrasound Med Biol 2016;42(9):2146–2155. [DOI] [PubMed] [Google Scholar]
- 180.Zhang D, Li P, Chen M, et al. Non-invasive assessment of liver fibrosis in patients with alcoholic liver disease using acoustic radiation force impulse elastography. Abdom Imaging 2015;40(4):723–729. [DOI] [PubMed] [Google Scholar]
- 181.Zhang DK, Chen M, Liu Y, Wang RF, Liu LP, Li M. Acoustic radiation force impulse elastography for non-invasive assessment of disease stage in patients with primary biliary cirrhosis: a preliminary study. Clin Radiol 2014;69(8):836–840. [DOI] [PubMed] [Google Scholar]
- 182.Wang J, Malik N, Yin M, et al. Magnetic resonance elastography is accurate in detecting advanced fibrosis in autoimmune hepatitis. World J Gastroenterol 2017;23(5):859–868. [DOI] [PMC free article] [PubMed] [Google Scholar]
- 183.Eaton JE, Dzyubak B, Venkatesh SK, et al. Performance of magnetic resonance elastography in primary sclerosing cholangitis. J Gastroenterol Hepatol 2016;31(6):1184–1190. [DOI] [PMC free article] [PubMed] [Google Scholar]
- 184.Fleming KM, Aithal GP, Card TR, West J. The rate of decompensation and clinical progression of disease in people with cirrhosis: a cohort study. Aliment Pharmacol Ther 2010;32(11-12):1343–1350. [DOI] [PubMed] [Google Scholar]
- 185.Carrión JA, Navasa M, Bosch J, Bruguera M, Gilabert R, Forns X. Transient elastography for diagnosis of advanced fibrosis and portal hypertension in patients with hepatitis C recurrence after liver transplantation. Liver Transpl 2006;12(12):1791–1798. [DOI] [PubMed] [Google Scholar]
- 186.Foucher J, Chanteloup E, Vergniol J, et al. Diagnosis of cirrhosis by transient elastography (FibroScan): a prospective study. Gut 2006;55(3):403–408. [DOI] [PMC free article] [PubMed] [Google Scholar]
- 187.Kim SU, Lee JH, Kim DY, et al. Prediction of liver-related events using fibroscan in chronic hepatitis B patients showing advanced liver fibrosis. PLoS One 2012;7(5):e36676. [DOI] [PMC free article] [PubMed] [Google Scholar]
- 188.de Lédinghen V, Vergniol J, Barthe C, et al. Non-invasive tests for fibrosis and liver stiffness predict 5-year survival of patients chronically infected with hepatitis B virus. Aliment Pharmacol Ther 2013;37(10):979–988. [DOI] [PubMed] [Google Scholar]
- 189.Llop E, Berzigotti A, Reig M, et al. Assessment of portal hypertension by transient elastography in patients with compensated cirrhosis and potentially resectable liver tumors. J Hepatol 2012;56(1):103–108. [DOI] [PubMed] [Google Scholar]
- 190.Macías J, Camacho A, Von Wichmann MA, et al. Liver stiffness measurement versus liver biopsy to predict survival and decompensations of cirrhosis among HIV/hepatitis C virus-coinfected patients. AIDS 2013;27(16):2541–2549. [DOI] [PubMed] [Google Scholar]
- 191.Merchante N, Rivero-Juárez A, Téllez F, et al. Liver stiffness predicts clinical outcome in human immunodeficiency virus/hepatitis C virus-coinfected patients with compensated liver cirrhosis. Hepatology 2012;56(1):228–238. [DOI] [PubMed] [Google Scholar]
- 192.Pang JX, Zimmer S, Niu S, et al. Liver stiffness by transient elastography predicts liver-related complications and mortality in patients with chronic liver disease. PLoS One 2014;9(4):e95776. [DOI] [PMC free article] [PubMed] [Google Scholar]
- 193.Park MS, Kim SU, Kim BK, et al. Prognostic value of the combined use of transient elastography and fibrotest in patients with chronic hepatitis B. Liver Int 2015;35(2):455–462. [DOI] [PubMed] [Google Scholar]
- 194.Pérez-Latorre L, Sánchez-Conde M, Rincón D, et al. Prediction of liver complications in patients with hepatitis C virus-related cirrhosis with and without HIV coinfection: comparison of hepatic venous pressure gradient and transient elastography. Clin Infect Dis 2014;58(5):713–718. [DOI] [PubMed] [Google Scholar]
- 195.Robic MA, Procopet B, Métivier S, et al. Liver stiffness accurately predicts portal hypertension related complications in patients with chronic liver disease: a prospective study. J Hepatol 2011;55(5):1017–1024. [DOI] [PubMed] [Google Scholar]
- 196.Vergniol J, Foucher J, Terrebonne E, et al. Noninvasive tests for fibrosis and liver stiffness predict 5-year outcomes of patients with chronic hepatitis C. Gastroenterology 2011;140(7):1970–1979, 1979.e1–e3. [DOI] [PubMed] [Google Scholar]
- 197.Vergniol J, Boursier J, Coutzac C, et al. Evolution of noninvasive tests of liver fibrosis is associated with prognosis in patients with chronic hepatitis C. Hepatology 2014;60(1):65–76. [DOI] [PubMed] [Google Scholar]
- 198.Vizzutti F, Arena U, Romanelli RG, et al. Liver stiffness measurement predicts severe portal hypertension in patients with HCV-related cirrhosis. Hepatology 2007;45(5):1290–1297. [DOI] [PubMed] [Google Scholar]
- 199.Wong GL, Chan HL, Yu Z, et al. Noninvasive assessments of liver fibrosis with transient elastography and Hui index predict survival in patients with chronic hepatitis B. J Gastroenterol Hepatol 2015;30(3):582–590. [DOI] [PubMed] [Google Scholar]
- 200.Singh S, Fujii LL, Murad MH, et al. Liver stiffness is associated with risk of decompensation, liver cancer, and death in patients with chronic liver diseases: a systematic review and meta-analysis. Clin Gastroenterol Hepatol 2013;11(12):1573–1584.e1–e2; quiz e88–e89. [DOI] [PMC free article] [PubMed] [Google Scholar]
- 201.Shi KQ, Fan YC, Pan ZZ, et al. Transient elastography: a meta-analysis of diagnostic accuracy in evaluation of portal hypertension in chronic liver disease. Liver Int 2013;33(1):62–71. [DOI] [PubMed] [Google Scholar]
- 202.Kim BK, Han KH, Park JY, et al. A liver stiffness measurement-based, noninvasive prediction model for high-risk esophageal varices in B-viral liver cirrhosis. Am J Gastroenterol 2010;105(6):1382–1390. [DOI] [PubMed] [Google Scholar]
- 203.Berzigotti A, Seijo S, Arena U, et al. Elastography, spleen size, and platelet count identify portal hypertension in patients with compensated cirrhosis. Gastroenterology 2013;144(1):102–111.e1. [DOI] [PubMed] [Google Scholar]
- 204.de Franchis R; Baveno VI Faculty. Expanding consensus in portal hypertension: report of the Baveno VI Consensus Workshop: stratifying risk and individualizing care for portal hypertension. J Hepatol 2015;63(3):743–752. [DOI] [PubMed] [Google Scholar]
- 205.Colecchia A, Montrone L, Scaioli E, et al. Measurement of spleen stiffness to evaluate portal hypertension and the presence of esophageal varices in patients with HCV-related cirrhosis. Gastroenterology 2012;143(3):646–654. [DOI] [PubMed] [Google Scholar]
- 206.Calvaruso V, Bronte F, Conte E, Simone F, Craxì A, Di Marco V. Modified spleen stiffness measurement by transient elastography is associated with presence of large oesophageal varices in patients with compensated hepatitis C virus cirrhosis. J Viral Hepat 2013;20(12):867–874. [DOI] [PubMed] [Google Scholar]
- 207.Sharma P, Kirnake V, Tyagi P, et al. Spleen stiffness in patients with cirrhosis in predicting esophageal varices. Am J Gastroenterol 2013;108(7):1101–1107. [DOI] [PubMed] [Google Scholar]
- 208.Stefanescu H, Grigorescu M, Lupsor M, Procopet B, Maniu A, Badea R. Spleen stiffness measurement using Fibroscan for the noninvasive assessment of esophageal varices in liver cirrhosis patients. J Gastroenterol Hepatol 2011;26(1):164–170. [DOI] [PubMed] [Google Scholar]
- 209.Akima T, Tamano M, Hiraishi H. Liver stiffness measured by transient elastography is a predictor of hepatocellular carcinoma development in viral hepatitis. Hepatol Res 2011;41(10):965–970. [DOI] [PubMed] [Google Scholar]
- 210.Chon YE, Jung ES, Park JY, et al. The accuracy of noninvasive methods in predicting the development of hepatocellular carcinoma and hepatic decompensation in patients with chronic hepatitis B. J Clin Gastroenterol 2012;46(6):518–525. [DOI] [PubMed] [Google Scholar]
- 211.Feier D, Lupsor Platon M, Stefanescu H, Badea R. Transient elastography for the detection of hepatocellular carcinoma in viral C liver cirrhosis. is there something else than increased liver stiffness? J Gastrointestin Liver Dis 2013;22(3):283–289. [PubMed] [Google Scholar]
- 212.Jung KS, Kim SU, Ahn SH, et al. Risk assessment of hepatitis B virus-related hepatocellular carcinoma development using liver stiffness measurement (FibroScan). Hepatology 2011;53(3):885–894. [DOI] [PubMed] [Google Scholar]
- 213.Klibansky DA, Mehta SH, Curry M, Nasser I, Challies T, Afdhal NH. Transient elastography for predicting clinical outcomes in patients with chronic liver disease. J Viral Hepat 2012;19(2):e184–e193. [DOI] [PubMed] [Google Scholar]
- 214.Masuzaki R, Tateishi R, Yoshida H, et al. Prospective risk assessment for hepatocellular carcinoma development in patients with chronic hepatitis C by transient elastography. Hepatology 2009;49(6):1954–1961. [DOI] [PubMed] [Google Scholar]
- 215.Narita Y, Genda T, Tsuzura H, et al. Prediction of liver stiffness hepatocellular carcinoma in chronic hepatitis C patients on interferon-based anti-viral therapy. J Gastroenterol Hepatol 2014;29(1):137–143. [DOI] [PubMed] [Google Scholar]
- 216.Poynard T, Vergniol J, Ngo Y, et al. Staging chronic hepatitis C in seven categories using fibrosis biomarker (FibroTest™) and transient elastography (FibroScan®). J Hepatol 2014;60(4):706–714. [DOI] [PubMed] [Google Scholar]
- 217.Wang HM, Hung CH, Lu SN, et al. Liver stiffness measurement as an alternative to fibrotic stage in risk assessment of hepatocellular carcinoma incidence for chronic hepatitis C patients. Liver Int 2013;33(5):756–761. [DOI] [PubMed] [Google Scholar]
- 218.Wong GL, Chan HL, Wong CK, et al. Liver stiffness-based optimization of hepatocellular carcinoma risk score in patients with chronic hepatitis B. J Hepatol 2014;60(2):339–345. [DOI] [PubMed] [Google Scholar]
- 219.Kim DY, Song KJ, Kim SU, et al. Transient elastography-based risk estimation of hepatitis B virus-related occurrence of hepatocellular carcinoma: development and validation of a predictive model. Onco Targets Ther 2013;6:1463–1469. [DOI] [PMC free article] [PubMed] [Google Scholar]
- 220.Vermehren J, Polta A, Zimmermann O, et al. Comparison of acoustic radiation force impulse imaging with transient elastography for the detection of complications in patients with cirrhosis. Liver Int 2012;32(5):852–858. [DOI] [PubMed] [Google Scholar]
- 221.Takuma Y, Morimoto Y, Takabatake H, et al. Measurement of spleen stiffness with acoustic radiation force impulse imaging predicts mortality and hepatic decompensation in patients with liver cirrhosis. Clin Gastroenterol Hepatol 2017;15(11):1782–1790.e4. [DOI] [PubMed] [Google Scholar]
- 222.Morishita N, Hiramatsu N, Oze T, et al. Liver stiffness measurement by acoustic radiation force impulse is useful in predicting the presence of esophageal varices or high-risk esophageal varices among patients with HCV-related cirrhosis. J Gastroenterol 2014;49(7):1175–1182 [Published correction appears in J Gastroenterol 2015;50(6):705.]. [DOI] [PubMed] [Google Scholar]
- 223.Aoki T, Iijima H, Tada T, et al. Prediction of development of hepatocellular carcinoma using a new scoring system involving virtual touch quantification in patients with chronic liver diseases. J Gastroenterol 2017;52(1):104–112. [DOI] [PubMed] [Google Scholar]
- 224.Takamura M, Kanefuji T, Suda T, et al. Value of shear wave velocity measurements for the risk assessment of hepatocellular carcinoma development in patients with nonalcoholic fatty liver disease : HCC risk assessment by VTTQ. Hepatol Int 2014;8(2):240–249. [DOI] [PubMed] [Google Scholar]
- 225.Choi SY, Jeong WK, Kim Y, Kim J, Kim TY, Sohn JH. Shear-wave elastography: a noninvasive tool for monitoring changing hepatic venous pressure gradients in patients with cirrhosis. Radiology 2014;273(3):917–926. [DOI] [PubMed] [Google Scholar]
- 226.Procopet B, Berzigotti A, Abraldes JG, et al. Real-time shear-wave elastography: applicability, reliability and accuracy for clinically significant portal hypertension. J Hepatol 2015;62(5):1068–1075. [DOI] [PubMed] [Google Scholar]
- 227.Elkrief L, Rautou PE, Ronot M, et al. Prospective comparison of spleen and liver stiffness by using shear-wave and transient elastography for detection of portal hypertension in cirrhosis. Radiology 2015;275(2):589–598. [DOI] [PubMed] [Google Scholar]
- 228.Cassinotto C, Charrie A, Mouries A, et al. Liver and spleen elastography using supersonic shear imaging for the non-invasive diagnosis of cirrhosis severity and oesophageal varices. Dig Liver Dis 2015;47(8):695–701. [DOI] [PubMed] [Google Scholar]
- 229.Kasai Y, Moriyasu F, Saito K, et al. Value of shear wave elastography for predicting hepatocellular carcinoma and esophagogastric varices in patients with chronic liver disease. J Med Ultrason (2001) 2015;42(3):349–355. [DOI] [PubMed] [Google Scholar]
- 230.Asrani SK, Talwalkar JA, Kamath PS, et al. Role of magnetic resonance elastography in compensated and decompensated liver disease. J Hepatol 2014;60(5):934–939. [DOI] [PMC free article] [PubMed] [Google Scholar]
- 231.Lee DH, Lee JM, Yi NJ, et al. Hepatic stiffness measurement by using MR elastography: prognostic values after hepatic resection for hepatocellular carcinoma. Eur Radiol 2017;27(4):1713–1721. [DOI] [PubMed] [Google Scholar]
- 232.Guo J, Büning C, Schott E, et al. In vivo abdominal magnetic resonance elastography for the assessment of portal hypertension before and after transjugular intrahepatic portosystemic shunt implantation. Invest Radiol 2015;50(5):347–351. [DOI] [PubMed] [Google Scholar]
- 233.Morisaka H, Motosugi U, Ichikawa S, Sano K, Ichikawa T, Enomoto N. Association of splenic MR elastographic findings with gastroesophageal varices in patients with chronic liver disease. J Magn Reson Imaging 2015;41(1):117–124. [DOI] [PubMed] [Google Scholar]
- 234.Ronot M, Lambert S, Elkrief L, et al. Assessment of portal hypertension and high-risk oesophageal varices with liver and spleen three-dimensional multifrequency MR elastography in liver cirrhosis. Eur Radiol 2014;24(6):1394–1402. [DOI] [PubMed] [Google Scholar]
- 235.Shin SU, Lee JM, Yu MH, et al. Prediction of esophageal varices in patients with cirrhosis: usefulness of three-dimensional MR elastography with echo-planar imaging technique. Radiology 2014;272(1):143–153. [DOI] [PMC free article] [PubMed] [Google Scholar]
- 236.Talwalkar JA, Yin M, Venkatesh S, et al. Feasibility of in vivo MR elastographic splenic stiffness measurements in the assessment of portal hypertension. AJR Am J Roentgenol 2009;193(1):122–127. [DOI] [PMC free article] [PubMed] [Google Scholar]
- 237.Dyvorne HA, Jajamovich GH, Besa C, Cooper N, Taouli B. Simultaneous measurement of hepatic and splenic stiffness using MR elastography: preliminary experience. Abdom Imaging 2015;40(4):803–809. [DOI] [PMC free article] [PubMed] [Google Scholar]
- 238.Stefanescu H, Radu C, Procopet B, et al. Non-invasive ménage à trois for the prediction of high-risk varices: stepwise algorithm using lok score, liver and spleen stiffness. Liver Int 2015;35(2):317–325. [DOI] [PubMed] [Google Scholar]
- 239.Anaparthy R, Talwalkar JA, Yin M, Roberts LR, Fidler JL, Ehman RL. Liver stiffness measurement by magnetic resonance elastography is not associated with developing hepatocellular carcinoma in subjects with compensated cirrhosis. Aliment Pharmacol Ther 2011;34(1):83–91. [DOI] [PMC free article] [PubMed] [Google Scholar]
- 240.Motosugi U, Ichikawa T, Koshiishi T, et al. Liver stiffness measured by magnetic resonance elastography as a risk factor for hepatocellular carcinoma: a preliminary case-control study. Eur Radiol 2013;23(1):156–162. [DOI] [PubMed] [Google Scholar]
- 241.Foster GR, Irving WL, Cheung MC, et al. Impact of direct acting antiviral therapy in patients with chronic hepatitis C and decompensated cirrhosis. J Hepatol 2016;64(6):1224–1231. [DOI] [PubMed] [Google Scholar]
- 242.Flemming JA, Kim WR, Brosgart CL, Terrault NA. Reduction in liver transplant wait-listing in the era of direct-acting antiviral therapy. Hepatology 2017;65(3):804–812. [DOI] [PMC free article] [PubMed] [Google Scholar]
- 243.Sáez-Royuela F, Linares P, Cervera LA, et al. Evaluation of advanced fibrosis measured by transient elastography after hepatitis C virus protease inhibitor-based triple therapy. Eur J Gastroenterol Hepatol 2016;28(3):305–312. [DOI] [PubMed] [Google Scholar]
- 244.Elsharkawy A, Alem SA, Fouad R, et al. Changes in liver stiffness measurements and fibrosis scores following sofosbuvir based treatment regimens without interferon. J Gastroenterol Hepatol 2017;32(9):1624–1630. [DOI] [PubMed] [Google Scholar]
- 245.Bachofner JA, Valli PV, Kröger A, et al. Direct antiviral agent treatment of chronic hepatitis C results in rapid regression of transient elastography and fibrosis markers fibrosis-4 score and aspartate aminotransferase-platelet ratio index. Liver Int 2017;37(3):369–376. [DOI] [PubMed] [Google Scholar]
- 246.Yada N, Sakurai T, Minami T, et al. Ultrasound elastography correlates treatment response by antiviral therapy in patients with chronic hepatitis C. Oncology 2014;87(Suppl 1):118–123. [DOI] [PubMed] [Google Scholar]
- 247.Casado JL, Quereda C, Moreno A, Pérez-Elías MJ, Martí-Belda P, Moreno S. Regression of liver fibrosis is progressive after sustained virological response to HCV therapy in patients with hepatitis C and HIV coinfection. J Viral Hepat 2013;20(12):829–837. [DOI] [PubMed] [Google Scholar]
- 248.Martinez SM, Foucher J, Combis JM, et al. Longitudinal liver stiffness assessment in patients with chronic hepatitis C undergoing antiviral therapy. PLoS One 2012;7(10):e47715. [DOI] [PMC free article] [PubMed] [Google Scholar]
- 249.Suda T, Okawa O, Masaoka R, et al. Shear wave elastography in hepatitis C patients before and after antiviral therapy. World J Hepatol 2017;9(1):64–68. [DOI] [PMC free article] [PubMed] [Google Scholar]
- 250.Tachi Y, Hirai T, Kojima Y, et al. Liver stiffness measurement using acoustic radiation force impulse elastography in hepatitis C virus-infected patients with a sustained virological response. Aliment Pharmacol Ther 2016;44(4):346–355. [DOI] [PubMed] [Google Scholar]
- 251.Schmid P, Bregenzer A, Huber M, et al. Progression of liver fibrosis in HIV/HCV co-infection: a comparison between non-invasive assessment methods and liver biopsy. PLoS One 2015;10(9):e0138838. [DOI] [PMC free article] [PubMed] [Google Scholar]
- 252.Tian WS, Lin MX, Zhou LY, et al. Maximum value measured by 2-D shear wave elastography helps in differentiating malignancy from benign focal liver lesions. Ultrasound Med Biol 2016;42(9):2156–2166. [DOI] [PubMed] [Google Scholar]
- 253.Guo LH, Wang SJ, Xu HX, et al. Differentiation of benign and malignant focal liver lesions: value of virtual touch tissue quantification of acoustic radiation force impulse elastography. Med Oncol 2015;32(3):68. [DOI] [PubMed] [Google Scholar]
- 254.Ronot M, Di Renzo S, Gregoli B, et al. Characterization of fortuitously discovered focal liver lesions: additional information provided by shearwave elastography. Eur Radiol 2015;25(2):346–358. [DOI] [PubMed] [Google Scholar]
- 255.Park HS, Kim YJ, Yu MH, Jung SI, Jeon HJ. Shear wave elastography of focal liver lesion: intraobserver reproducibility and elasticity characterization. Ultrasound Q 2015;31(4):262–271. [DOI] [PubMed] [Google Scholar]
- 256.Özmen E, Adaletli I, Kayadibi Y, et al. The impact of share wave elastography in differentiation of hepatic hemangioma from malignant liver tumors in pediatric population. Eur J Radiol 2014;83(9):1691–1697. [DOI] [PubMed] [Google Scholar]
- 257.Zhang P, Zhou P, Tian SM, Qian Y, Deng J, Zhang L. Application of acoustic radiation force impulse imaging for the evaluation of focal liver lesion elasticity. Hepatobiliary Pancreat Dis Int 2013;12(2):165–170. [DOI] [PubMed] [Google Scholar]
- 258.Park H, Park JY, Kim DY, et al. Characterization of focal liver masses using acoustic radiation force impulse elastography. World J Gastroenterol 2013;19(2):219–226. [DOI] [PMC free article] [PubMed] [Google Scholar]
- 259.Guibal A, Boularan C, Bruce M, et al. Evaluation of shearwave elastography for the characterisation of focal liver lesions on ultrasound. Eur Radiol 2013;23(4):1138–1149. [DOI] [PubMed] [Google Scholar]
- 260.Kapoor A, Kapoor A, Mahajan G, Sidhu BS, Lakhanpal VP. Real-time elastography in differentiating metastatic from nonmetastatic liver nodules. Ultrasound Med Biol 2011;37(2):207–213. [DOI] [PubMed] [Google Scholar]
- 261.Davies G, Koenen M. Acoustic radiation force impulse elastography in distinguishing hepatic haemangiomata from metastases: preliminary observations. Br J Radiol 2011;84(1006):939–943. [DOI] [PMC free article] [PubMed] [Google Scholar]
- 262.Shuang-Ming T, Ping Z, Ying Q, Li-Rong C, Ping Z, Rui-Zhen L. Usefulness of acoustic radiation force impulse imaging in the differential diagnosis of benign and malignant liver lesions. Acad Radiol 2011;18(7):810–815. [DOI] [PubMed] [Google Scholar]
- 263.Cho SH, Lee JY, Han JK, Choi BI. Acoustic radiation force impulse elastography for the evaluation of focal solid hepatic lesions: preliminary findings. Ultrasound Med Biol 2010;36(2):202–208. [DOI] [PubMed] [Google Scholar]
- 264.Venkatesh SK, Yin M, Glockner JF, et al. MR elastography of liver tumors: preliminary results. AJR Am J Roentgenol 2008;190(6):1534–1540. [DOI] [PMC free article] [PubMed] [Google Scholar]
- 265.Garteiser P, Doblas S, Daire JL, et al. MR elastography of liver tumours: value of viscoelastic properties for tumour characterisation. Eur Radiol 2012;22(10):2169–2177. [DOI] [PubMed] [Google Scholar]
- 266.Hennedige TP, Hallinan JT, Leung FP, et al. Comparison of magnetic resonance elastography and diffusion-weighted imaging for differentiating benign and malignant liver lesions. Eur Radiol 2016;26(2):398–406. [DOI] [PubMed] [Google Scholar]
- 267.Thompson SM, Wang J, Chandan VS, et al. MR elastography of hepatocellular carcinoma: correlation of tumor stiffness with histopathology features—preliminary findings. Magn Reson Imaging 2017;37:41–45. [DOI] [PMC free article] [PubMed] [Google Scholar]
- 268.Gordic S, Ayache JB, Kennedy P, et al. Value of tumor stiffness measured with MR elastography for assessment of response of hepatocellular carcinoma to locoregional therapy. Abdom Radiol (NY) 2017;42(6):1685–1694. [DOI] [PMC free article] [PubMed] [Google Scholar]
- 269.Mariappan YK, Glaser KJ, Ehman RL. Magnetic resonance elastography: a review. Clin Anat 2010;23(5):497–511. [DOI] [PMC free article] [PubMed] [Google Scholar]
- 270.Johnson CL, Schwarb H, D J McGarry M, et al. Viscoelasticity of subcortical gray matter structures. Hum Brain Mapp 2016;37(12):4221–4233. [DOI] [PMC free article] [PubMed] [Google Scholar]
- 271.Ichikawa S, Motosugi U, Morisaka H, et al. Comparison of the diagnostic accuracies of magnetic resonance elastography and transient elastography for hepatic fibrosis. Magn Reson Imaging 2015;33(1):26–30. [DOI] [PubMed] [Google Scholar]
- 272.Guo Y, Parthasarathy S, Goyal P, McCarthy RJ, Larson AC, Miller FH. Magnetic resonance elastography and acoustic radiation force impulse for staging hepatic fibrosis: a meta-analysis. Abdom Imaging 2015;40(4):818–834. [DOI] [PubMed] [Google Scholar]
- 273.Song P, Mellema DC, Sheedy SP, et al. Performance of 2-dimensional ultrasound shear wave elastography in liver fibrosis detection using magnetic resonance elastography as the reference standard: a pilot study. J Ultrasound Med 2016;35(2):401–412. [DOI] [PMC free article] [PubMed] [Google Scholar]
- 274.Ichikawa S, Motosugi U, Morisaka H, et al. MRI-based staging of hepatic fibrosis: comparison of intravoxel incoherent motion diffusion-weighted imaging with magnetic resonance elastography. J Magn Reson Imaging 2015;42(1):204–210. [DOI] [PubMed] [Google Scholar]
- 275.Park HS, Kim YJ, Yu MH, Choe WH, Jung SI, Jeon HJ. Three-Tesla magnetic resonance elastography for hepatic fibrosis: comparison with diffusion-weighted imaging and gadoxetic acid-enhanced magnetic resonance imaging. World J Gastroenterol 2014;20(46):17558–17567. [DOI] [PMC free article] [PubMed] [Google Scholar]
- 276.Wang QB, Zhu H, Liu HL, Zhang B. Performance of magnetic resonance elastography and diffusion-weighted imaging for the staging of hepatic fibrosis: a meta-analysis. Hepatology 2012;56(1):239–247. [DOI] [PubMed] [Google Scholar]
- 277.Bota S, Herkner H, Sporea I, et al. Meta-analysis: ARFI elastography versus transient elastography for the evaluation of liver fibrosis. Liver Int 2013;33(8):1138–1147. [DOI] [PubMed] [Google Scholar]
- 278.Sporea I, Sirli R, Bota S, Popescu A, Sendroiu M, Jurchis A. Comparative study concerning the value of acoustic radiation force impulse elastography (ARFI) in comparison with transient elastography (TE) for the assessment of liver fibrosis in patients with chronic hepatitis B and C. Ultrasound Med Biol 2012;38(8):1310–1316. [DOI] [PubMed] [Google Scholar]
- 279.Gerber L, Kasper D, Fitting D, et al. Assessment of liver fibrosis with 2-D shear wave elastography in comparison to transient elastography and acoustic radiation force impulse imaging in patients with chronic liver disease. Ultrasound Med Biol 2015;41(9):2350–2359. [DOI] [PubMed] [Google Scholar]
- 280.Sporea I, Bota S, Jurchis A, et al. Acoustic radiation force impulse and supersonic shear imaging versus transient elastography for liver fibrosis assessment. Ultrasound Med Biol 2013;39(11):1933–1941. [DOI] [PubMed] [Google Scholar]
- 281.Arena U, Lupsor Platon M, Stasi C, et al. Liver stiffness is influenced by a standardized meal in patients with chronic hepatitis C virus at different stages of fibrotic evolution. Hepatology 2013;58(1):65–72. [DOI] [PubMed] [Google Scholar]
- 282.Berzigotti A, De Gottardi A, Vukotic R, et al. Effect of meal ingestion on liver stiffness in patients with cirrhosis and portal hypertension. PLoS One 2013;8(3):e58742. [DOI] [PMC free article] [PubMed] [Google Scholar]
- 283.Hines CD, Lindstrom MJ, Varma AK, Reeder SB. Effects of postprandial state and mesenteric blood flow on the repeatability of MR elastography in asymptomatic subjects. J Magn Reson Imaging 2011;33(1):239–244. [DOI] [PubMed] [Google Scholar]
- 284.Mederacke I, Wursthorn K, Kirschner J, et al. Food intake increases liver stiffness in patients with chronic or resolved hepatitis C virus infection. Liver Int 2009;29(10):1500–1506. [DOI] [PubMed] [Google Scholar]
- 285.Popescu A, Bota S, Sporea I, et al. The influence of food intake on liver stiffness values assessed by acoustic radiation force impulse elastography-preliminary results. Ultrasound Med Biol 2013;39(4):579–584. [DOI] [PubMed] [Google Scholar]
- 286.Yin M, Talwalkar JA, Glaser KJ, et al. Dynamic postprandial hepatic stiffness augmentation assessed with MR elastography in patients with chronic liver disease. AJR Am J Roentgenol 2011;197(1):64–70. [DOI] [PMC free article] [PubMed] [Google Scholar]
- 287.Millonig G, Reimann FM, Friedrich S, et al. Extrahepatic cholestasis increases liver stiffness (FibroScan) irrespective of fibrosis. Hepatology 2008;48(5):1718–1723. [DOI] [PubMed] [Google Scholar]
- 288.Pfeifer L, Strobel D, Neurath MF, Wildner D. Liver stiffness assessed by acoustic radiation force impulse (ARFI) technology is considerably increased in patients with cholestasis. Ultraschall Med 2014;35(4):364–367. [DOI] [PubMed] [Google Scholar]
- 289.Sporea I, Raţiu I, Bota S, Şirli R, Jurchiş A. Are different cut-off values of liver stiffness assessed by transient elastography according to the etiology of liver cirrhosis for predicting significant esophageal varices? Med Ultrason 2013;15(2):111–115. [DOI] [PubMed] [Google Scholar]
- 290.Lombardi R, Buzzetti E, Roccarina D, Tsochatzis EA. Non-invasive assessment of liver fibrosis in patients with alcoholic liver disease. World J Gastroenterol 2015;21(39):11044–11052. [DOI] [PMC free article] [PubMed] [Google Scholar]
- 291.Xu J, Liu X, Koyama Y, et al. The types of hepatic myofibroblasts contributing to liver fibrosis of different etiologies. Front Pharmacol 2014;5:167. [DOI] [PMC free article] [PubMed] [Google Scholar]
- 292.Pinzani M. Pathophysiology of liver fibrosis. Dig Dis 2015;33(4):492–497. [DOI] [PubMed] [Google Scholar]
- 293.Friedrich-Rust M, Nierhoff J, Lupsor M, et al. Performance of acoustic radiation force impulse imaging for the staging of liver fibrosis: a pooled meta-analysis. J Viral Hepat 2012;19(2):e212–e219. [DOI] [PubMed] [Google Scholar]
- 294.Yun MH, Seo YS, Kang HS, et al. The effect of the respiratory cycle on liver stiffness values as measured by transient elastography. J Viral Hepat 2011;18(9):631–636. [DOI] [PubMed] [Google Scholar]
- 295.Chapman T, Dubinsky T, Barr RG. Ultrasound elastography of the liver: what the clinician needs to know. J Ultrasound Med 2017;36(7):1293–1304. [DOI] [PubMed] [Google Scholar]
- 296.Wang K, Manning P, Szeverenyi N, et al. Repeatability and reproducibility of 2D and 3D hepatic MR elastography with rigid and flexible drivers at end-expiration and end-inspiration in healthy volunteers. Abdom Radiol (NY) 2017 Jun 13 [Epub ahead of print]. [DOI] [PMC free article] [PubMed]
- 297.Echosens. FibroScan reimbursement. http://www.echosens.us/reimbursement-0. Accessed March 4, 2017.
- 298.Arena U, Vizzutti F, Corti G, et al. Acute viral hepatitis increases liver stiffness values measured by transient elastography. Hepatology 2008;47(2):380–384. [DOI] [PubMed] [Google Scholar]
- 299.Coco B, Oliveri F, Maina AM, et al. Transient elastography: a new surrogate marker of liver fibrosis influenced by major changes of transaminases. J Viral Hepat 2007;14(5):360–369. [DOI] [PubMed] [Google Scholar]
- 300.Sagir A, Erhardt A, Schmitt M, Häussinger D. Transient elastography is unreliable for detection of cirrhosis in patients with acute liver damage. Hepatology 2008;47(2):592–595. [DOI] [PubMed] [Google Scholar]
- 301.Millonig G, Friedrich S, Adolf S, et al. Liver stiffness is directly influenced by central venous pressure. J Hepatol 2010;52(2):206–210. [DOI] [PubMed] [Google Scholar]
- 302.Bardou-Jacquet E, Legros L, Soro D, et al. Effect of alcohol consumption on liver stiffness measured by transient elastography. World J Gastroenterol 2013;19(4):516–522. [DOI] [PMC free article] [PubMed] [Google Scholar]
- 303.Mueller S, Millonig G, Sarovska L, et al. Increased liver stiffness in alcoholic liver disease: differentiating fibrosis from steatohepatitis. World J Gastroenterol 2010;16(8):966–972. [DOI] [PMC free article] [PubMed] [Google Scholar]
- 304.Trabut JB, Thépot V, Nalpas B, et al. Rapid decline of liver stiffness following alcohol withdrawal in heavy drinkers. Alcohol Clin Exp Res 2012;36(8):1407–1411. [DOI] [PubMed] [Google Scholar]
- 305.Wong GL, Wong VW, Choi PC, et al. Increased liver stiffness measurement by transient elastography in severe acute exacerbation of chronic hepatitis B. J Gastroenterol Hepatol 2009;24(6):1002–1007. [DOI] [PubMed] [Google Scholar]
- 306.Mueller S, Englert S, Seitz HK, et al. Inflammation-adapted liver stiffness values for improved fibrosis staging in patients with hepatitis C virus and alcoholic liver disease. Liver Int 2015;35(12):2514–2521. [DOI] [PubMed] [Google Scholar]
- 307.Boursier J, de Ledinghen V, Sturm N, et al. Precise evaluation of liver histology by computerized morphometry shows that steatosis influences liver stiffness measured by transient elastography in chronic hepatitis C. J Gastroenterol 2014;49(3):527–537. [DOI] [PubMed] [Google Scholar]
- 308.Gaia S, Carenzi S, Barilli AL, et al. Reliability of transient elastography for the detection of fibrosis in non-alcoholic fatty liver disease and chronic viral hepatitis. J Hepatol 2011;54(1):64–71. [DOI] [PubMed] [Google Scholar]
- 309.Arena U, Vizzutti F, Abraldes JG, et al. Reliability of transient elastography for the diagnosis of advanced fibrosis in chronic hepatitis C. Gut 2008;57(9):1288–1293. [DOI] [PubMed] [Google Scholar]
- 310.Wong VW, Vergniol J, Wong GL, et al. Diagnosis of fibrosis and cirrhosis using liver stiffness measurement in nonalcoholic fatty liver disease. Hepatology 2010;51(2):454–462. [DOI] [PubMed] [Google Scholar]
- 311.Wagner M, Besa C, Bou Ayache J, et al. Magnetic resonance elastography of the liver: qualitative and quantitative comparison of gradient echo and spin echo echoplanar imaging sequences. Invest Radiol 2016;51(9):575–581. [DOI] [PMC free article] [PubMed] [Google Scholar]
- 312.Mariappan YK, Dzyubak B, Glaser KJ, et al. Application of modified spin-echo-based sequences for hepatic MR elastography: evaluation, comparison with the conventional gradient-echo sequence, and preliminary clinical experience. Radiology 2017;282(2):390–398. [DOI] [PMC free article] [PubMed] [Google Scholar]
- 313.Sasso M, Beaugrand M, de Ledinghen V, et al. Controlled attenuation parameter (CAP): a novel VCTE™ guided ultrasonic attenuation measurement for the evaluation of hepatic steatosis: preliminary study and validation in a cohort of patients with chronic liver disease from various causes. Ultrasound Med Biol 2010;36(11):1825–1835. [DOI] [PubMed] [Google Scholar]
- 314.Karlas T, Petroff D, Sasso M, et al. Individual patient data meta-analysis of controlled attenuation parameter (CAP) technology for assessing steatosis. J Hepatol 2017;66(5):1022–1030. [DOI] [PubMed] [Google Scholar]
- 315.Sasso M, Audière S, Kemgang A, et al. Liver steatosis assessed by controlled attenuation parameter (CAP) measured with the XL probe of the FibroScan: a pilot study assessing diagnostic accuracy. Ultrasound Med Biol 2016;42(1):92–103. [DOI] [PubMed] [Google Scholar]
- 316.Reeder SB, Hu HH, Sirlin CB. Proton density fat-fraction: a standardized MR-based biomarker of tissue fat concentration. J Magn Reson Imaging 2012;36(5):1011–1014. [DOI] [PMC free article] [PubMed] [Google Scholar]
- 317.Weaver JB, Van Houten EE, Miga MI, Kennedy FE, Paulsen KD. Magnetic resonance elastography using 3D gradient echo measurements of steady-state motion. Med Phys 2001;28(8):1620–1628. [DOI] [PubMed] [Google Scholar]
- 318.Hirsch S, Guo J, Reiter R, et al. Towards compression-sensitive magnetic resonance elastography of the liver: sensitivity of harmonic volumetric strain to portal hypertension. J Magn Reson Imaging 2014;39(2):298–306. [DOI] [PubMed] [Google Scholar]
- 319.Glaser KJ, Manduca A, Ehman RL. Review of MR elastography applications and recent developments. J Magn Reson Imaging 2012;36(4):757–774. [DOI] [PMC free article] [PubMed] [Google Scholar]
- 320.Morisaka H, Motosugi U, Glaser KJ, et al. Comparison of diagnostic accuracies of two- and three-dimensional MR elastography of the liver. J Magn Reson Imaging 2017;45(4):1163–1170. [DOI] [PMC free article] [PubMed] [Google Scholar]
- 321.Asbach P, Klatt D, Hamhaber U, et al. Assessment of liver viscoelasticity using multifrequency MR elastography. Magn Reson Med 2008;60(2):373–379. [DOI] [PubMed] [Google Scholar]
- 322.Klatt D, Hamhaber U, Asbach P, Braun J, Sack I. Noninvasive assessment of the rheological behavior of human organs using multifrequency MR elastography: a study of brain and liver viscoelasticity. Phys Med Biol 2007;52(24):7281–7294. [DOI] [PubMed] [Google Scholar]
- 323.Etchell E, Jugé L, Hatt A, Sinkus R, Bilston LE. Liver stiffness values are lower in pediatric subjects than in adults and increase with age: a multifrequency MR elastography study. Radiology 2017;283(1):222–230. [DOI] [PubMed] [Google Scholar]
- 324.Barnhill E, Hollis L, Sack I, et al. Nonlinear multiscale regularisation in MR elastography: towards fine feature mapping. Med Image Anal 2017;35:133–145. [DOI] [PubMed] [Google Scholar]
- 325.Papazoglou S, Hirsch S, Braun J, Sack I. Multifrequency inversion in magnetic resonance elastography. Phys Med Biol 2012;57(8):2329–2346. [DOI] [PubMed] [Google Scholar]
- 326.Tzschätzsch H, Guo J, Dittmann F, et al. Tomoelastography by multifrequency wave number recovery from time-harmonic propagating shear waves. Med Image Anal 2016;30:1–10. [DOI] [PubMed] [Google Scholar]
Associated Data
This section collects any data citations, data availability statements, or supplementary materials included in this article.