Abstract
Micro-CT is widely used in preclinical studies, generating substantial interest in extending its capabilities in functional imaging applications such as blood perfusion and cardiac function. However, imaging cardiac structure and function in mice is challenging due to their small size and rapid heart rate. To overcome these challenges, we propose and compare improvements on two strategies for cardiac gating in dual-source, preclinical micro-CT: fast prospective gating (PG) and uncorrelated retrospective gating (RG). These sampling strategies combined with a sophisticated iterative image reconstruction algorithm provide faster acquisitions and high image quality in low-dose 4D (i.e. 3D + Time) cardiac micro-CT. Fast PG is performed under continuous subject rotation which results in interleaved projection angles between cardiac phases. Thus, fast PG provides a well-sampled temporal average image for use as a prior in iterative reconstruction. Uncorrelated RG incorporates random delays during sampling to prevent correlations between heart rate and sampling rate We have performed both simulations and animal studies to validate these new sampling protocols. Sampling times for 1000 projections using fast PG and RG were 2 and 3 minutes, respectively, and the total dose was 170 mGy each. Reconstructions were performed using a 4D iterative reconstruction technique based on the split Bregman method. To examine undersampling robustness, subsets of 500 and 250 projections were also used for reconstruction. Both sampling strategies in conjunction with our iterative reconstruction method are capable of resolving cardiac phases and provide high image quality. In general, for equal numbers of projections, fast PG shows less errors than RG and is more robust to undersampling. Our results indicate that only 1000-projection based reconstruction with fast PG satisfies a 5% error criterion in left ventricular (LV) volume estimation. These methods promise low-dose imaging with a wide range of preclinical applications in cardiac imaging.
I. Introduction
Micro-CT is widely used in preclinical studies, and there is substantial interest in using these systems to obtain not only anatomical but also functional information such as cardiac function or perfusion information [1–3]. 4D (3D + Time) cardiac micro-CT is challenging in mice due to their small heart size (~5 mm diameter) and rapid heart rates (up to 600 beats/minute), thus requiring both high spatial and high temporal resolution.
4D cardiac micro-CT aims to produce temporally resolved tomographic volumes over several phases of the cardiac cycle. Gating strategies are required for 4D cardiac micro-CT, and can be classified as either prospective [4, 5] or retrospective [2, 6]. In both prospective gating (PG) and retrospective gating (RG), physiological signals such as ECG and respiratory motion are monitored. Prospectively gated projections are acquired when certain physiological conditions are met, such as the R-peak of the ECG and/or the desired respiratory phase (e.g. inspiration or expiration). After capturing a projection, the subject (or the imaging gantry) is rotated through the next step angle and is held there until another projection can be acquired. The advantage of PG methodology is that it gives the imaging system control over the angular sampling distribution. The resulting projection data is well-sampled and has a regular-angular distribution. Thus, filtered back-projection (FBP) reconstruction algorithms such as Feldkamp’s [7] can be applied to provide tomographic data with adequate image quality [8]. The disadvantage of PG is that it can require long scan times and sometimes high radiation doses [4, 9]. An acquisition of 10 phases of the cardiac cycle can take up to an hour.
To reduce the sampling time while maintaining the image quality, we have also proposed fast prospective gating [10]. Fast PG combines the regular angular distribution of PG with the fast scan time of RG while performing respiratory or cardiac imaging. With fast PG, we acquire multiple projections at the same angle, corresponding to all cardiac or respiratory phases to be reconstructed, before the animal (or imaging gantry) is rotated to the next angle. Fast PG uses on-the-fly computation of the triggering events, which are delayed from the peaks of the respiratory or cardiac signals. Fast PG acquired projection data has been reconstructed with Feldkamp’s algorithm [7]. However, when the numbers of projections and the dose are reduced, such analytical reconstructions suffer from higher noise and undersampling artifacts. Noise and undersampling artifacts can be reduced when reconstruction is performed with more sophisticated iterative algorithms [11, 12] and prior information [13–15].
RG is typically performed by acquiring projections that are not triggered by physiological signals. Instead projections are taken at a fixed sampling rate. They are usually acquired more rapidly and with greater sampling density than in PG. Physiological signals (e.g. ECG and respiration signals) are recorded and used post-acquisition to sort projections into their respective cardiac and/or respiratory phases. The benefit of RG is that, unlike PG where only specific phases are sampled, projections from many cardiac phases are captured and can be used to reconstruct any cardiac phase. RG with our system is performed by rotating the subject slowly while projections are acquired [2]. Other groups have implemented RG on a slip-ring, flat-panel-based micro-CT system for cardiac studies in mice [16, 17]. Unfortunately, RG produces an irregular angular distribution of projections per phase; thus, when using Feldkamp’s reconstruction algorithm, streaking artifacts affect the image quality of the tomographic reconstructions. Previously, a few solutions have been proposed to alleviate streaking artifacts based on iterative reconstruction with total variation [18, 19], on point spread function deconvolution [2], on iterative, multi-dimensional bilateral filter techniques [3], and on the use of well-sampled, temporally-averaged prior images [13, 14, 20]. To improve the reconstruction of RG data, we have also introduced sophisticated compressed sensing approaches such as iterative reconstruction algorithms using 4D bilateral filtration and rank-sparse kernel regression for regularization [21]. Alternatively, we have combined retrospectively and prospectively gated data using deformable registration to achieve the high image quality associated with prospectively gated data, but with sampling times similar to retrospectively gated acquisitions [6]. In the end, however, all these solutions for reconstructing RG data are influenced by the limited number and angular distribution of phase-specific projections. A more regular-angular distribution and a sufficient number of projections corresponding to each cardiac phase can improve the image quality of the final tomographic images.
The goal of this paper is to propose improvements and compare PG and RG strategies for dual source micro-CT combined with a sophisticated image reconstruction algorithm to provide faster acquisitions and high image quality in low-dose, 4D cardiac micro-CT. We have performed both simulations and animal studies to validate the new sampling and reconstruction protocols. We have also compared the results from our novel fast PG and RG strategies in 4D cardiac imaging in mice.
II. Material and Methods
A brief description of our micro-CT system is first presented (section II.1). Summaries of the fast PG and RG strategies with their implementations are described (sections II.2–4). Details are then given on the iterative reconstruction method employed (section II.5). Realistic simulations for both gating strategies are described (section II.6), and the application of these strategies in vivo for 4D micro-CT is then set forth (section II.7).
II.1. Dual-source micro-CT system
The small-animal imaging system used in this work has been described in detail elsewhere [22]. The system incorporates two imaging chains capable of independently triggered acquisitions. The system contains two G-297 x-ray tubes (Varian Medical Systems, Palo Alto, CA) with 0.3/0.8 mm focal spot size, two Epsilon high-frequency x-ray generators by EMD Technologies (Quebec, Canada), and two CCD-based detectors with Gd2O2S phosphors (XDI-VHR 2 Photonic Science, East Sussex, UK) and with 22 µm pixels, which we bin to 88 µm. The data acquisition is controlled with custom sequencing applications written in LabVIEW (National Instruments). We use pulsed x-rays with a short exposure time of 10 ms to limit motion blur. The subject is mounted in a vertical cradle and rotated through all projection angles with a circular scanning trajectory. The use of both imaging chains effectively halves imaging time.
II.2. Fast PG with Continuous Rotation
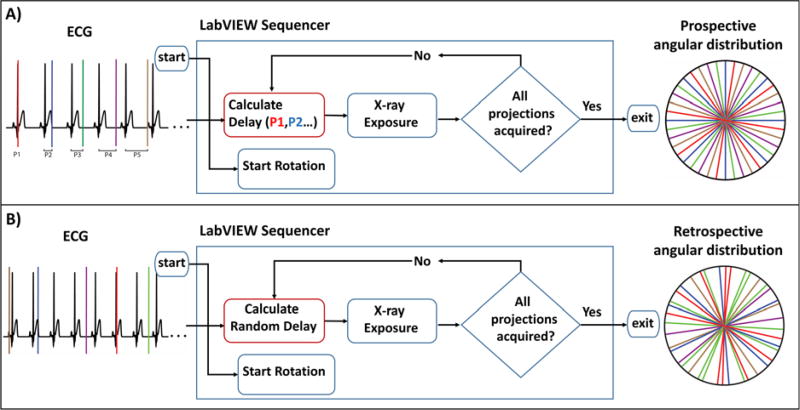
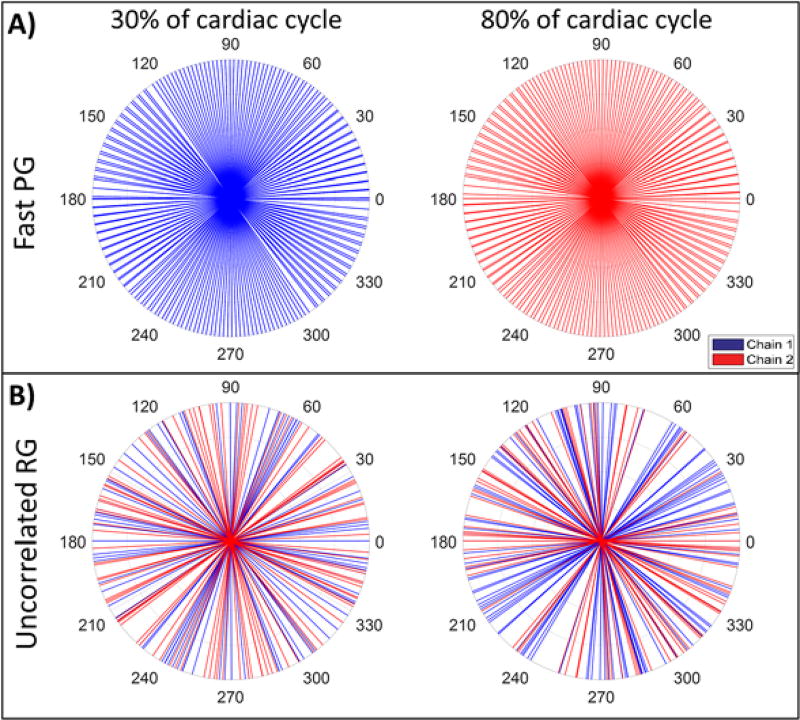
Our previously introduced fast PG strategy created identical, regular-angular distributions of projections for each cardiac phase; we acquired projections for all phases at each angle before rotating to the next one [10]. Thus, with angular undersampling (required to reduce radiation dose and scan time), the temporally averaged reconstruction could not serve as a high-quality prior for more sophisticated iterative reconstruction because each cardiac phase contained the same undersampling artifacts. In this work, we implement a novel method of fast PG to address this problem. In contrast to our previous fast PG strategy, here projections are acquired while the subject is continuously rotated. Continuous rotation causes sets of projections for different phases to be interspersed with one another (see figures 1A and 2A) and equiangularly distributed. This yields high spatial sampling density for a temporally-averaged FBP initialization volume for iterative reconstruction. Such an image can also serve as a prior in regularization (see section II.5).
Figure 1.
Gating strategies for fast PG and uncorrelated RG. Colors represent binned cardiac phases. A) Fast prospective gating with continuous rotation is performed by acquiring projections at pre-determined phases of the cardiac cycle. Trigger timing is calculated as a delay from R-peak detection. The subject rotates continuously throughout acquisition; thus, a temporally averaged image will not be affected by undersampling artifacts and can be used as a prior for iterative reconstruction. B) Uncorrelated RG is also performed under continuous rotation. Cardiac phases are uncorrelated via a random, zero to one R-R interval, delay between exposures. This results in an irregular angular distribution of projections for each cardiac phase.
Figure 2.
Projection angular distribution for fast PG and uncorrelated RG methods obtained in vivo. Colors represent the dual imaging chains of our micro-CT system. Two example cardiac phases are shown from the ten which were imaged. The total number of projections across all 10 phases for each gating method was 1000. A) During fast PG each imaging chain was set to acquire discrete phases independent of one another. B) The angular distributions for uncorrelated RG show that each phase is captured by a combination of both chains.
Note that in figures 1 and 2, we present an angular distribution of projections and each projection is represented as a radial line (inspired by the representation used to support the Central Slice Theorem [23]). In figure 2, the angular distribution of projections for two selected cardiac phases (i.e. systole and diastole) are displayed from the ten phases which were imaged in a mouse. During fast PG, each imaging chain of our dual source micro-CT system was set to acquire discrete phases independent of one another.
II.3. Uncorrelated RG acquisition
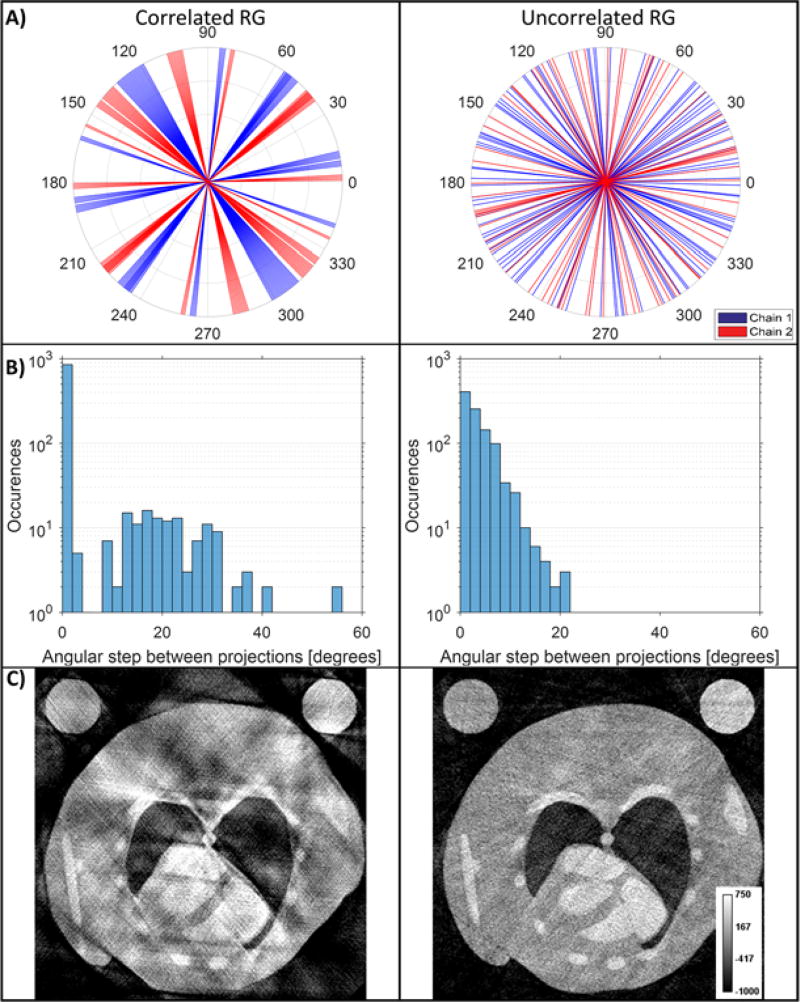
In addition to improved fast PG, we propose an improved method for 4D micro-CT with RG in which we prevent the correlation that often occurs between the sampling rate of the imaging system and the subject’s heart rate. Our method reduces this correlation by implementing random delays into the steady pacing of traditional RG. The delay is adjusted on the fly using the subject’s heart rate and is calculated as a random positive integer in milliseconds using a uniform distribution. The value of the delay ranges from zero to one R-R interval. By implementing the delay as a function of the heart rate, we ensure that cardiac phases are sampled at random with any projection having a near-equal chance of representing any given phase (see figures 1B, 2B). Figure 2B illustrates the angular distribution of two example cardiac phases (systole and diastole) as sampled by uncorrelated RG. Note the random distribution of projections across each phase. Uncorrelated RG addresses the consequence of correlation that may appear in practice between the sampling rate and the heart rate which usually results in a poor angular distribution and significant artifacts in temporal reconstructions. Figure 3 contains images which were reconstructed using FBP and were virtually sampled from the MOBY mouse phantom [24] using experimentally acquired ECG signals for angular and phase information (see details in section II.6). Thus, for some cardiac phases, relatively few projections are available for reconstruction, and those that are available often have irregular-angular distributions with large gaps of missing projections (figure 3A). These gaps are larger in cases of correlated RG, as confirmed by a wider and non-uniform spread in the histogram of the angular steps between projections (figure 3B). Thus, correlated RG gives more artifacts in the tomographic reconstruction (figure 3C). Consequently, uncorrelated RG was designed to address these sampling situations and to ensure a more uniform-angular distribution of projections and less artifacts in the reconstruction.
Figure 3.
Comparison of simulated RG with steady sampling that correlates with subject heart rate and randomized sampling which is uncorrelated with heart rate. For each case a total of 1000 projections were used across 10 cardiac phases. A) The number and distribution of projections in correlated and uncorrelated RG for the phase corresponding to 50% R-R. B) Histograms showing the angular spacing between projections in the same phase. The presence of high angular steps indicates gaps in the projection distribution. C) FBP comparisons show how such correlated sampling can negatively affect reconstruction quality.
II.4. Implementation of fast PG and uncorrelated RG
We implemented both improved fast PG and uncorrelated RG in LabVIEW (National Instruments, Austin TX). The LabVIEW virtual instruments, or VIs, give control of gating and acquisition parameters and display the subject’s ECG and respiratory signals. During our improved fast PG, the ECG signal is used to trigger acquisitions. R peaks are detected based on their amplitude crossing a threshold, and triggers are sent after a phase-specific delay from the R peak. The current R-R interval is calculated by the VI from a four second running average of the heart rate. A list of cardiac phases to acquire is entered into the VI as a list of percent R-R interval delays (e.g. 0, 10, 20, 30, … 90 %). Input cardiac phases are cycled for the duration of the scan, each phase being used to trigger a single exposure before moving to the back of the queue. A single projection per imaging chain is acquired for every cardiac cycle. A diagram of the acquisition process is given in figure 1A. During sampling respiratory motion was not used to control gating in fast PG. Instead respiratory gating was applied retrospectively. This was done to reduce the sampling time required for fast PG acquisitions. Because the subject’s heart rate drives the sampling rate of the system, the number of projections acquired per rotation is controlled by adjusting the rotational velocity of the stage. Prior to the start of a scan, the VI calculates the rotational velocity of the stage based on an input number of projections to acquire and the subject’s heart rate using the following equation where TRR refers to the R-R period of the cardiac cycle:
| (1) |
A separate VI was programmed for uncorrelated RG. Similar to the PG VI, the RG VI displays the subject’s ECG and respiratory signals. It additionally allows control of the system’s sampling rate and rotational velocity. These parameters determine the angular density of the projections and the total number of projections acquired per stage rotation. To remove possible correlation with the subject’s heart rate, the VI adds a randomly generated delay to each x-ray trigger (figure 3B). The bounds on this random delay are set from zero to one R-R interval. In this implementation, care had to be taken so that the fastest sampling rate did not exceed our hardware image acquisition limit of 10 Hz which would result in blank projections. To ensure that this limit was not exceeded while applying a random delay to each acquisition (i.e., a maximum delay followed by a minimum delay), the system was configured to sample with a period at least 100 ms longer than the subject’s R-R interval.
II.5. Iterative Image Reconstruction
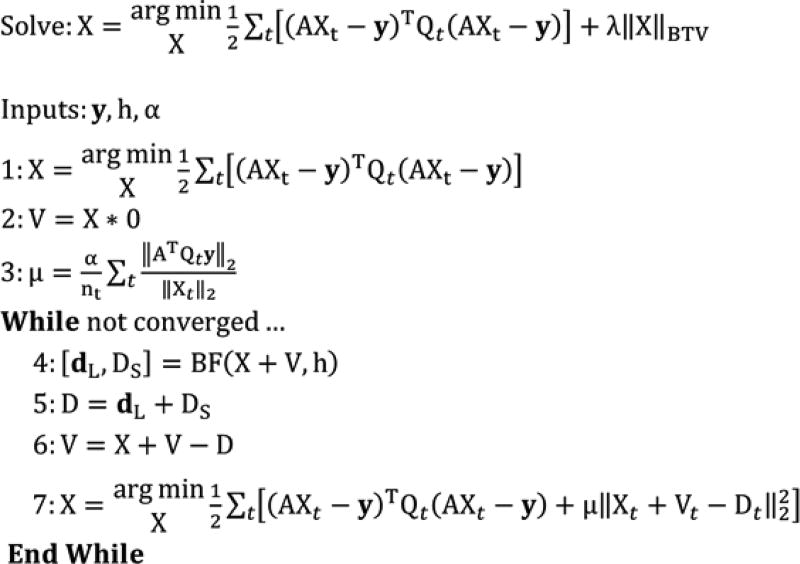
Figure 4 summarizes the application of the split Bregman method with the add-residual-back strategy [25, 26] to the problem of temporal CT reconstruction. A similar algorithm has been proposed by us for spectro-temporal reconstruction in our previous work [21]. Here we solve the problem of temporal reconstruction by minimizing the following penalized, weighted least squares objective function:
| (2) |
Figure 4.
4D CT reconstruction algorithm based on 4D, joint bilateral filtration [21] and the split Bregman method with the add-residual-back strategy [25, 26]. (1) Temporally-weighted least-squares initialization for each time point, t, (nt total) solved with the BiCGSTAB method [27]. (2) Initialization of the regularization residuals, V. (3) Calculation of an appropriate regularization parameter, μ, based on a user-specified scalar parameter, α (α ∈ [0.001,0.01]). (4–7) Reconstruction steps iterated until convergence (~3–4 iterations). (4–5) Spatiotemporal regularization with bilateral filtration (BF). (6) Residual update step. (7) Data fidelity update step solved for each time point using BiCGSTAB.
Each column of the reconstructed data, X, represents the reconstructed volume at a different time point (cardiac phase), indexed by t. The columns of X are related to the acquired projection data, y, through the CT system projection matrix, A, and a time-point specific, diagonal weighting matrix, Qt. The weights on the diagonal of Qt are repeated for each detector pixel within a single projection. When prospective gating is used, the weights are binary, taking on a constant value for all projections associated with the corresponding cardiac phase, and being set to zero for all projections associated with other cardiac phases. When retrospective gating is used, projection weights are assigned based on Gaussian basis functions which are centered on the phase to be reconstructed and which have a full-width-at-half-maximum equal to the integration time of the projection data, scaled to span the complete cardiac cycle. Regardless of the gating strategy, additional multiplicative weights are included to account for respiration. Additional details regarding retrospective projection weighting and weight-based respiratory gating can be found in our previous work [21].
In this study, we have used binary weighting on the respiration. For both the in vivo experiments and the simulations, the majority of the projections (around 80%) were acquired during, or very close to, the same respiratory phase, i.e. end-expiration. The median value of the respiratory signal, representing end-expiration, was assigned as the baseline respiratory value. The difference between the baseline value and the value of the respiratory signal at the time of each exposure was used to determine which weights to assign projections. To control for the effects of respiratory motion, the 20% of projections with the largest differences in value to the baseline were assigned zero weights. Note that respiratory gating reduces the number of projections available for each cardiac phase and introduces irregularities in the angular distribution, even for fast prospective gating.
Following step 1 in figure 4, iterative reconstruction is initialized with temporally-weighted least-squares evaluated for each time point, t, (nt total time points) and with the biconjugate gradient stabilized convex solver (BiCGSTAB [27]). Given this algebraic initialization for the reconstruction of each timepoint, Xt, it is possible to analytically estimate an appropriate value for the regularization parameter, μ, which controls the trade-off between spatial domain regularization and projection domain data fidelity (step 3). The value of this parameter is derived from the temporally averaged ratio of the magnitude of the temporally weighted and unfiltered backprojection (ATQty) and the corresponding reconstruction of each time point (Xt), accounting for magnitude scaling differences introduced by the system backprojection matrix (AT) and the temporal weights (Qt). The user controls the regularization strength through the scalar parameter α. Combined with the data-adaptive regularization scheme described below, appropriate values for α fall within a predictable range (i.e. α ∈ [0.001,0.01]; [28]), reducing the significance of parameter tuning when comparing reconstructions performed with different numbers of projections, different noise levels, etc.
Reconstruction is performed subject to a regularity constraint which penalizes bilateral total variation (Eq. 2; BTV; [29, 30]). For temporal reconstruction, we minimize BTV through the application of bilateral filtration (BF, [31]; figure 4, step 4). Specifically, following from the concept of low rank and sparse matrix factorization, we apply BF to the temporal average reconstruction (gL) and the phase-specific temporal contrast (GS,t) [21]:
| (3) |
BF is applied independently to gL, to remove noise from the temporal mean, and jointly to gL and GS to remove noise from the temporal contrast. For gL, 3D BF is applied as a neighborhood-adaptive convolution operation:
| (4) |
| (5) |
| (6) |
| (7) |
To regularize the intensity of the voxel located at spatial position m (Eq. 4), a weighted average is performed between the intensities of voxels within the filtration domain, C(n) (Eq. 5; domain radius, b=6). Intensity weights are assigned by the Gaussian range kernel, R(gL,m,n), which is parameterized by the scalar smoothing parameter, h, and the noise standard deviation measured in the data immediately prior to filtration, σL (measured by computing the median absolute deviation; see [28]). The magnitudes of the range weights are inversely proportional to the Euclidean distance between the intensities of the neighboring voxels, gL(m−n), and the intensity of the central voxel, gL(m), following resampling with the smoothing kernel, K(l) (also defined on the domain C(n)). As a consequence of data-adaptive regularization strength scaling based on σ within the range kernel, proportionally more regularization is applied to noisy data, facilitating calibration of the regularization parameter, μ, and the comparison of reconstructions using different numbers of projections. Notably, this regularization strength scaling combined with the µ parameter implicitly defines a value for the λ regularization parameter included in the original cost function (Eq. 2).
Regularization of the temporal contrast is similar; however, the filtration domain is expanded to include the time point proceeding (t−1) and following (t+1) the time point being filtered. Furthermore, BF is performed jointly between gL and each time point, GS,t, by multiplying independently computed range weights at each spatial position, n, within the filtration domain:
| (8) |
The range kernel computed from GS,j, Rt, is similar to the range kernel defined in Eqs. 6–7:
| (9) |
| (10) |
The primary difference is that the resampling operation (Eq. 10) is applied only to the time point being filtered, t. This intensity is subtracted from each time point (j=t−1, j=t, j=t+1) during range kernel computation (Eq. 9).
Computations were performed using a stand-alone computer. The computing resources for the computer include an Intel Xeon CPU, 64 GB of RAM, and an NVIDIA GeForce GTX Titan graphics card with 6 GB of dedicated memory. Iterative reconstruction operations and BF were performed on the GPU. Distance-driven operators for projection and backprojection [32] were coded using NVIDIA’s CUDA libraries.
II.6. Phantom Simulations
We examined the efficacy of 4D cardiac micro-CT with fast PG and uncorrelated RG in simulations using an anatomically correct mouse phantom known as the MOBY phantom [24] (400×400×140 voxels, 88 µm spacing). We generated 100 MOBY volumes, each representing a unique combination of 10 cardiac and 10 respiratory phases. From selections of these phase-specific volumes, we used our distance driven forward projector to create 1000 cone beam projections over a 360-degree rotation. The projections were divided into two sets of 500, representing data as it would be collected with our dual source micro-CT system. To better mimic the experimental acquisitions, Poisson noise was added to the projections using the poissrnd function in MATLAB (MathWorks, Natick, MA). Noise in the reconstructions was quantified using the standard deviation of voxel values in water.
For both fast PG and uncorrelated RG, the angles and cardiac and respiratory phases used to create projections were generated using angles, ECG, respiration, and trigger data recorded during in vivo mouse imaging (see section II.7). By using the information recorded from the in vivo trials to generate projections, we have created a more realistic representation of the animal experiment in our simulations. This allows for an assessment of image quality for each sampling strategy by comparison with the ground truth. The same image reconstruction algorithm and regularization parameters employed in the animal experiments were used to reconstruct the simulation volumes.
To assess the strength of fast PG and uncorrelated RG combined with the iterative reconstruction method described here, simulations were created with varying degrees of undersampling. In addition to reconstructions from the full 1000 projections captured in the experimental case, reconstructions were performed using subsets of 500 and 250 projections over 360 degrees of rotation. In the undersampled cases, projection subsets were created by selecting every other or every fourth projection from the full set of 1000 projections.
We have also simulated the previous strategies for sampling corresponding to conventional RG and fast PG without continuous rotation. Conventional RG was simulated by sampling the respiratory and cardiac signals at a constant rate (figure 3). The previous fast PG sampling strategy was simulated by sampling 10 cardiac phases, along with variations in respiration, at each angle before rotating to the next step. Reconstructions were performed using the same iterative algorithm as the proposed sampling methods, with 1000, 500 and 250 projections. We compare these results with analogous results produced with our new fast PG and uncorrelated RG strategies.
As metrics for image quality, we have used both the root-mean-square error (RMSE) and the structural similarity index (SSIM). To adequately assess temporal resolution RMSE was computed in a volume of interest around the heart, a slice of which is marked in figure 5A. For a quantitative measure of reconstruction performance in simulations, we have computed RMSE for each iteration of the reconstruction with the following formula:
| (11) |
where N is the total number of voxels in one 3D volume, and f and b are the two compared volumes, i.e. the true and reconstructed volumes.
Figure 5.
Simulated reconstructions using experimentally derived projection angles and phases. A) The reference MOBY phantom used to create projections is marked with a ROI used for image quality assessment. Reconstructions of 10 phases were performed using 1000, 500, and 250 projections. B) Fast PG and C) uncorrelated RG reconstructions are shown for systole and diastole. Residual images are the absolute value of the difference between the reference phantom and iterative reconstruction. Note that residuals around the heart (yellow arrows) increase with undersampling.
Structural similarity index (SSIM) quality assessment is a measure of image distortion from the original, or reference, image. It is based on the computation of three terms, namely the luminance term, the contrast term, and the structural term [33]. The overall index is a multiplicative combination of the three terms. The equation has the following form for input images f and b:
| (12) |
where μ and σ are the local means and standard deviations, respectively, of images f and b. Constants C1 and C2 are present to prevent instability when is close to zero, and are calculated using the dynamic range of the images. The calculation of SSIM was performed within the 2D region of interest (ROI) shown in figure 5A using MATLAB’s Image Processing Toolbox.
Finally, we have used 3D segmentations of the left ventricle (LV) in diastole and systole for each gating method and reconstruction to evaluate cardiac functional metrics, including stroke volume, cardiac output, and ejection fraction. Segmentation was performed using ITK-SNAP [34], an open-source, semi-automated segmentation tool. The software allows the user to set threshold windows, to place seeds for region growing, and to set 3D growth parameters. For each sampling method, the CT number threshold separating blood from the myocardium was calculated using Otsu’s threshold selection algorithm [35] on a volume containing only blood and myocardium. The threshold was calculated separately for each gating method using reconstructions from 1000 projections, and it was applied to all undersampled cases. The segmented ventricles were manually cropped at the mitral and aortic valves using ImageJ [36] to remove any variability in volume outside of these boundaries. To determine which cardiac phases represented systole and end-diastole, segmentations on the reconstructions from 1000 projections were performed for all ten cardiac phases, and heart volumes were compared to find minimum and maximum values for systole and end-diastole respectively.
II.7. In vivo Experiments
We performed the animal study using a C57BL/6 mouse. The study was conducted under the protocol approved by the Duke University Institutional Animal Care and Use Committee (IACUC). To provide the necessary blood/tissue contrast, we used a liposomal blood pool contrast agent (123 mg iodine/ml) [37] delivered by injection via a tail vein catheter at a dose of 0.01 ml/g body weight. Post-injection, the contrast between the blood and myocardium was approximately 500 HU. The mouse was anesthetized with isoflurane (1.5%) mixed with 50% oxygen and balanced with nitrogen. ECG was monitored with electrodes (Blue Sensor, Medicotest, UK) taped to the footpads, and body temperature was maintained with heat lamps, a rectal probe, and a feed-back controller (Digi-Sense®, Cole Parmer, Chicago, IL). In the mouse study we used a free breathing protocol. A pneumatic pillow on the thorax was used to monitor respiration. Both ECG and respiratory signals were recorded and used for sorting and weighting projections at the reconstruction level.
We performed cardiac imaging with both improved fast PG and uncorrelated RG to acquire 10 cardiac phases. The exposure parameters of the micro-CT scanner were set to 80 kVp and 100 mA for both imaging chains. Exposure time was set to 10 ms to minimize cardiac blurring. In both the fast PG and uncorrelated RG scans, 1000 projections (500 projections/imaging chain) were acquired over a complete 360° rotation. The total acquisition times for fast PG and uncorrelated RG were 2 minutes and 3 minutes, respectively. The average heart rates of the mouse during the fast PG and RG acquisitions were 301 and 351 beats per minute. Respiratory rates during fast PG and RG gating averaged 41.1 breaths per minute and 55.6 breaths per minute. The changes in heart and respiratory rates between scans may be due to effects of anesthesia levels over time.
We have estimated x-ray radiation dose based on previous measurements performed in a mouse-like phantom using a Wireless Dosimetry System Mobile MOSFET TN-RD-16, SN 63 (Thomson/Nielsen, Ottawa, ON, Canada). The experiments involving the dose measurements have been described previously in [38]. The total radiation dose for a study involving 1000 projections with the described exposure parameters is approximately 170 mGy. This dose is reduced to one half and one quarter of that number in cases of 500 or 250 projections, respectively.
To examine the strength of the sampling methods and reconstruction algorithm used here with undersampled data, we reconstructed both acquisitions three times, using 1000, 500, and 250 projections. As was done with the simulations, projections were subsampled from the 1000 projection case to create subsets with 500 and 250 projections (evenly distributed over both imaging chains). By using subsets of data from the same scan, we can directly compare reconstructions with one another while de-emphasizing the impact of contrast concentration, heart rate, and respiration. Note that in all cases we reconstructed cardiac phases as 10 volumes of size 768×768×280 with a voxel size of 88 microns.
We have also performed LV segmentations and the computation of functional metrics of the heart for the in vivo experimental data. The segmentation was performed using the same methods and tools described for the segmentations of the simulated data (section II.6). Left ventricle end systolic volume (ESV) and left ventricle end-diastolic volume (EDV) were used to calculate metrics such as stroke volume (SV = EDV − ESV), ejection fraction (EF = SV / EDV), and cardiac output (CO = SV * heart rate) for each reconstruction.
III. Results
III.1 Simulations
Figure 5 summarizes the results of applying our 4D iterative reconstruction algorithm to the projection data created from the MOBY phantom (A) using the fast PG (B) and uncorrelated RG (C) strategies. The noise in the simulated 1000-projection reconstructions, as measured by the standard deviation in water, was about 52 HU for PG and 43 HU for RG. The red box around the heart in (A) denotes a ROI around the heart that is used for computing image quality metrics. Only systole and end-diastole images are shown, but 10 phases in the cardiac cycle were reconstructed for each type of gating. We display the reconstructions performed using 1000, 500, and 250 projections. Note that the 4D iterative reconstruction results are visually very robust with respect to undersampling and enable higher image quality compared to FBP. This is particularly true of RG gating which inherently produces an irregular angular distribution of projections (see figure 1). Residual images are the absolute difference between the reference MOBY phantom and the iterative reconstruction results. The residual images show higher errors around the heart with undersampling, particularly in areas which experience the most change over time (marked by yellow arrows).
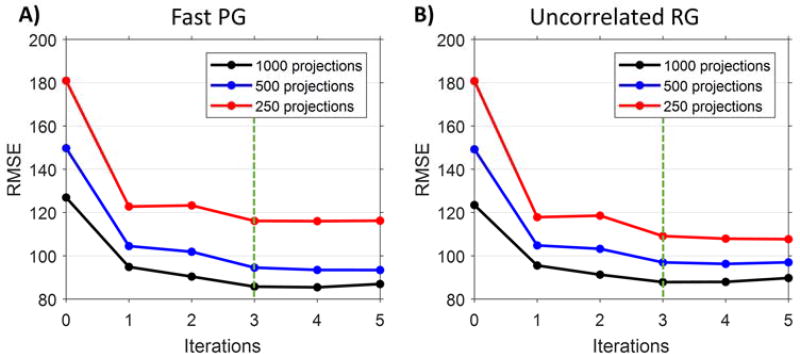
Figure 6 presents the root-mean-square error (RMSE) as a function of the number of simulation reconstruction iterations for both fast PG and RG sampling. We used a volume of interest around the heart (see figure 5A) and averaged the RMSE for all ten reconstructed cardiac phases. The RMSE values plateau after 3 iterations; thus, the 3rd iteration results were used in all quality measurements and analysis. As expected, the RMSE values are lowest when using the highest number of projections, and are highest for the initial algebraic reconstructions for all numbers of projections (iteration 0; figure 4, step 1). Both gating methods show similar RMSE values for 1000 projection reconstructions. As the number of projections decreases to 500, fast PG provides slightly lower overall RMSE values than uncorrelated RG.
Figure 6.
RMSE as a function of the number of reconstruction iterations for A) fast PG and B) uncorrelated RG. Calculations were performed in a volume of interest (figure 5a) around the heart and averaged for all ten reconstructed cardiac phases. The RMSE values plateau after 3 iterations; this iteration was used in all quality measurements and analysis.
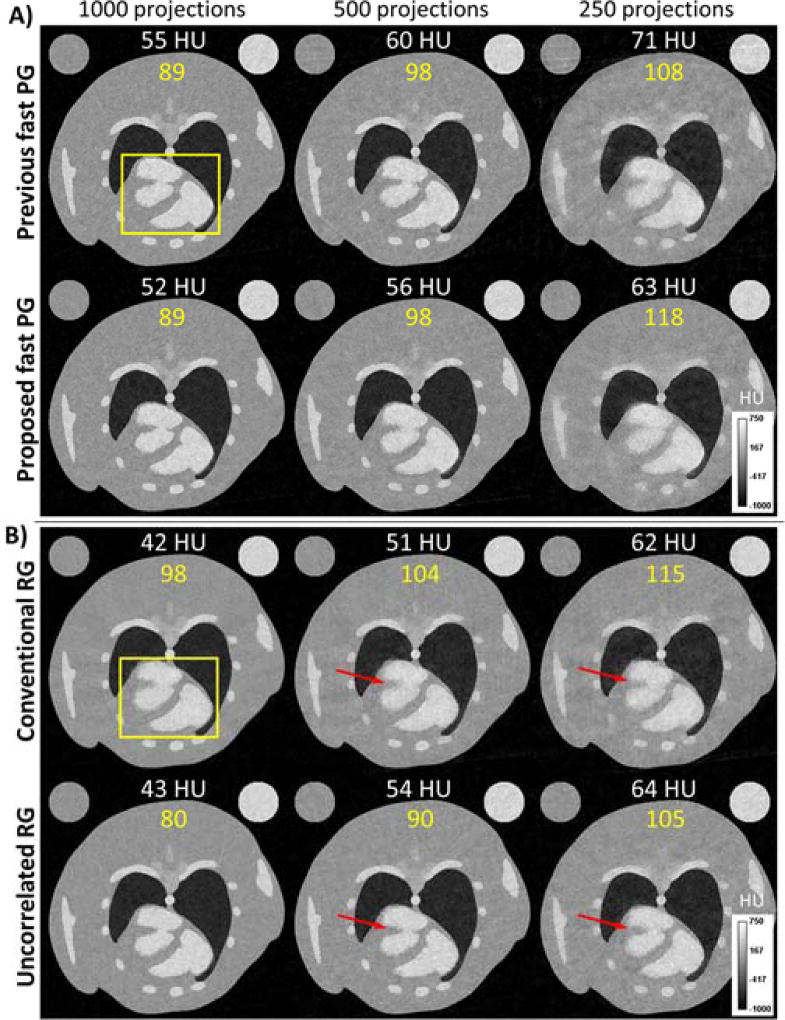
Figure 7 compares results of fast PG with and without continuous rotation (figure 7A) and of conventional and uncorrelated RG (figure 7B). All sets were reconstructed with our 4D iterative reconstruction algorithm using 3 iterations. The resultant noise levels are reduced by the new fast PG method by 9%, on average, over all phases and numbers of projections. RMSE values are similar for both PG methods, as the cardiac phases are well sampled. Uncorrelated RG performs better than conventional RG in terms of temporal resolution due to cardiac phases being randomly sampled. This is evidenced by that method’s lower RMSE values and a better delineation of the blood-myocardium boundary (see rectangular ROI in Figure 7). As measured in water, noise in the RG reconstructions are similar.
Figure 7.
Reconstructions showing systole for our previous gating methods and our newly proposed methods. (A) Comparison of iterative reconstructions using projections acquired with our previous fast PG method and with the newly proposed version with continuous rotation. Noise is given in white. RMSE was computed in the ROI and is shown in yellow. Note the reduction in noise for the proposed method. (B) Comparison of conventional and uncorrelated RG. Noise is similar for both methods. The temporal resolution of uncorrelated RG is visibly better, however, as evidenced by features in the heart (red arrows) and by lower RMSE values across all numbers of projections.
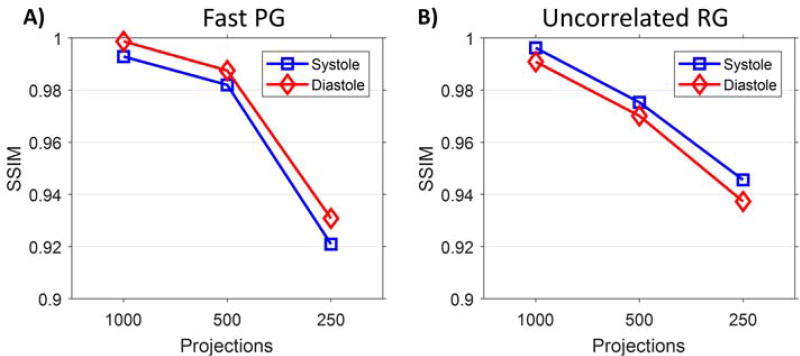
Figure 8 presents the SSIM for quantitative assessment of image quality in these simulations. SSIM was calculated in a ROI for a single representative slice through the heart (figure 5A). Instead of averaging this metric over all 10 cardiac phases, as was done when calculating RMSE, two specific phases, systole and end-diastole, are shown. This allows for the examination of temporal resolution in the specific cardiac phases often used to measure cardiac functional metrics. When both reconstructions are well sampled, they have similar SSIM values. Note that for 500 projections, fast PG provides higher SSIM compared to RG; however, at 250 projections fast PG performs worse than RG. Systole in general shows higher SSIM values than end-diastole.
Figure 8.
SSIM measured in a ROI around the heart (figure 5A) for systole and end-diastole. A) fast PG and B) RG have similar SSIM at 1000 projections; however, with 500 projections RG SSIM values decrease more with decreasing projections. When the number of projections decreases to 250, or approximately 25 per cardiac phase, the performance of fast PG drops faster than that of RG, according to SSIM.
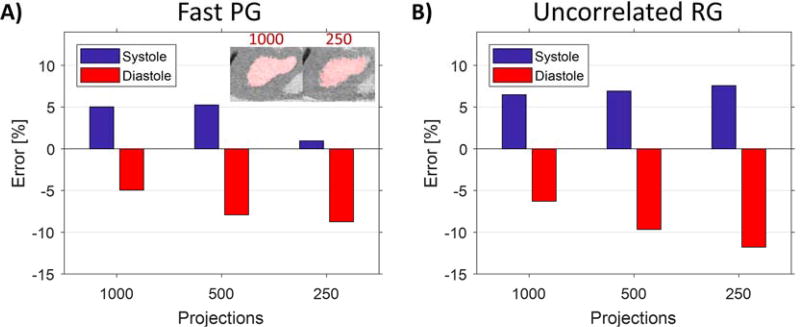
In figure 9 we show the error in LV volume in simulations. The segmented LV volumes for systole and end-diastole were compared with the LV volume of the reference phantom to quantify errors in the reconstruction. Note that the errors for fast PG are less than for RG. In the case of 250 projections, the results are intriguing— for fast PG, combinations of artifacts create a situation in which LV volumetric measurement error in systole is unexpectedly low (figure 9A). Segmentations of reconstructions with 1000 and 250 projections illustrate how undersampling artifacts affect segmentation results. This anomaly does not appear in RG, perhaps due to larger Gaussian weights associated with less phase-specific projections.
Figure 9.
Errors in LV volume for systole and diastole in the phantom simulations. For both A) fast PG and B) uncorrelated RG reconstructions, segmented LV volumes for systole and diastole were compared with the LV volume of the reference phantom to quantify errors in the segmentations. Positive and negative errors correspond to overestimated and underestimated volumes, respectively. LV volumes are regularly overestimated in systole and underestimated in diastole. These errors get progressively worse with undersampling. Note that the PG segmentations consistently have less error than the RG segmentations. The small error in systole shown for the PG, 250-projection reconstruction is an anomaly explained by the irregular boundary of the left ventricle at this high level of undersampling. Coronal cross-sections of the heart show the systole segmentations for PG with 1000 and 250 projections, respectively.
III.2 In-vivo experiments
One of the main goals of fast PG and uncorrelated RG is to create sets of projections which evenly sample each cardiac phase. For our in vivo experiment, the percent of projections acquired within each cardiac phase was 10 ± 0.1% for fast PG and 10 ± 0.7% for uncorrelated RG, indicating success in distributing projection evenly across phases. Respiration was monitored and recorded for both sampling methods, and was used retrospectively for gating. It was found from comparing the recorded ECG and trigger data that the fast PG VI was able to trigger projections within 2% of the preset cardiac phase with an accuracy of 99.8%. The percent of projections per phase that were captured with minimal respiratory motion, i.e. outside of inhalation and start-expiration, was roughly 80% for both fast PG and uncorrelated RG. Respiratory gating was applied to reconstruct using only these projections with minimal respiratory motion.
Reconstruction times for FBP and iterative reconstruction for each of our experimental reconstructions are given by table 1. Retrospective sets took an average of 31% longer to reconstruct than prospective sets using iterative reconstruction. This is due to the way in which temporal cardiac weights are applied. The application of temporal cardiac weights allows for individual projections to be used in more than one cardiac phase, with smaller weights associated with less phase-specific projections. Including respiratory and Gaussian cardiac weights (truncated at 3 standard deviations), 20 ± 0.6% of the total number of projections (e.g. 20% of 1000 projections) had non-zero weights when reconstructing each cardiac phase from RG data. Iterative reconstructions are more time consuming than FBP, taking, on average, 190 times longer to complete with the previously described computer hardware.
Table 1.
Time for reconstruction of 10 cardiac phases.
| Prospective | Retrospective | |||
|---|---|---|---|---|
| Projections | FBP [min] | Iterative Recon [min] |
FBP [min] | Iterative Recon [min] |
| 1000 | 2.0 | 361.5 | 4.1 | 813.4 |
| 500 | 1.4 | 250.4 | 2.4 | 485.5 |
| 250 | 1.6 | 190.7 | 1.6 | 290.3 |
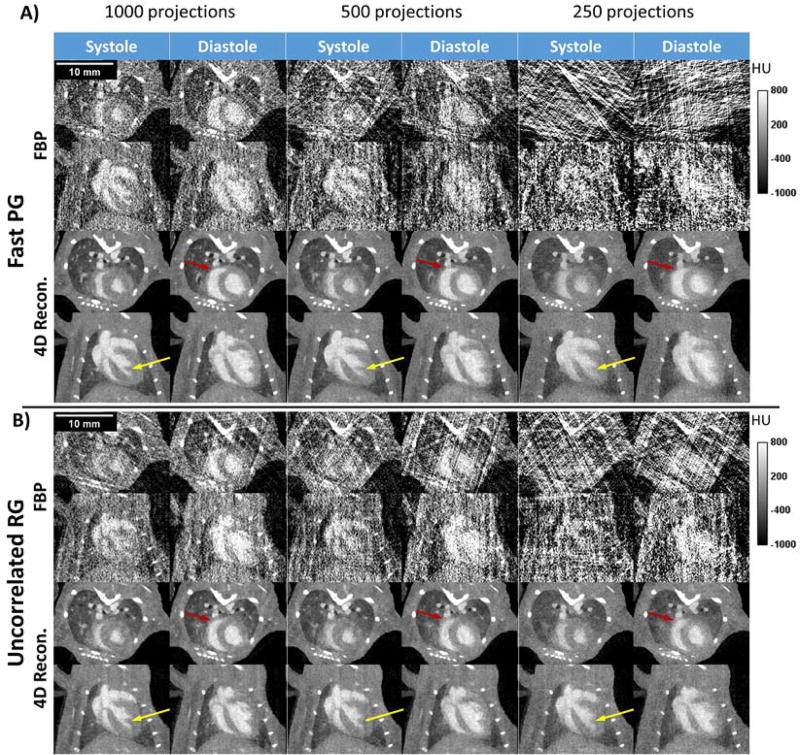
Figure 10 presents experimental reconstructions with FBP and our iterative algorithm for fast PG (figure 10A) and RG (figure 10B). We show single 2D slices in axial and coronal orientations corresponding to systole and end-diastole for 1000-, 500-, and 250-projection reconstructions. Noise in the 1000-projection, iteratively reconstructed volumes was quantified from the standard deviation of pixel values in water and was measured to be around 56 HU for fast PG and 60 HU for RG. The noise measured in the iterative reconstructions was 5.4 times less than that in the FBP reconstructions for fast PG (305 HU) and 4.6 times less for uncorrelated RG (277 HU). Streaking artifacts from projection undersampling, which are prevalent in the FBP reconstructions, are barely noticeable in the iterative reconstructions, even when using only 250 projections. While the iterative reconstructions are less encumbered by artifacts than FBP, it can be seen that features present in the 1000 projection case still become less defined in cases of undersampling. Features of the heart such as papillary muscles (marked by yellow arrows) and the thin heart wall of the right ventricle (red arrows) become poorly defined or even lost, which can lead to errors in segmentation.
Figure 10.
A) Fast PG and B) RG reconstructions for two of the 10 phases reconstructed, systole and end-diastole, in axial and coronal orientations. Reconstructions were created from 1000, 500, and 250 projections using both FBP and iterative reconstruction. Artifacts present in FBP reconstructions are greatly reduced in the iterative reconstructions. Projection undersampling causes a predictable loss in temporal and spatial fidelity. Small features such as papillary muscles (yellow arrows) and the heart wall (red arrows) lose detail or altogether disappear.
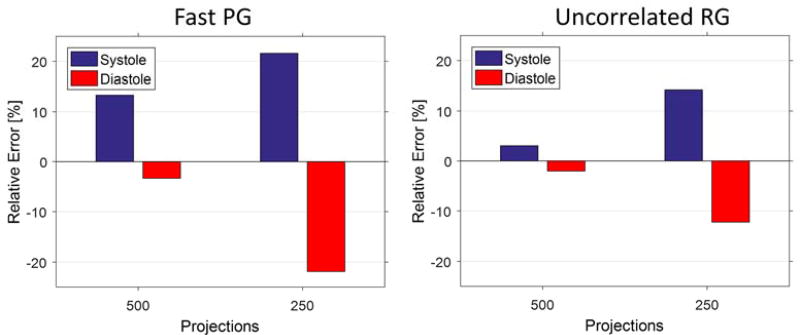
Figure 11 presents the errors in LV segmentations for the 500 and 250 projection cases relative to the 1000 projection reconstructions for the experimental study. In experimental acquisitions, the absolute truth is not known, so undersampled reconstructions are compared to the 1000 projection reconstructions. We note that systole has generally higher errors than diastole. Systole always shows positive error (the LV volume is overestimated) and diastole always shows negative error (the LV volume is underestimated).
Figure 11.
Error in segmented LV for undersampled reconstructions relative to the 1000 projection reconstruction. Errors appear to be highest for fast PG, particularly for systole, having close to 22% error for the 250 projections reconstruction.
The cardiac functional metrics stroke volume, cardiac output, and ejection fraction are summarized in table 2. Heart rate was measured based on the ECG signals recorded during data acquisition and was used in the computation of cardiac output. We note that although the same animal was scanned for our tests of fast PG and RG, its heart rate increased 13.7% in the time between scans, and its stroke volume decreased by around 16%. The cardiac output and the ejection fraction decreased by about 14% and 7% between fast PG and uncorrelated RG scans.
Table 2.
Cardiac functional metrics
| Fast Prospective Gating | ||||||
| Projections | Heart Rate [BPM] | Systole Volume [µL] | End-Diastolic volume [µL] | Stroke Volume [µL] | Cardiac Output [mL/min] | Ejection Fraction [%] |
|
| ||||||
| 1000 | 303 | 13.13 | 39.07 | 25.95 | 7.86 | 66.40 |
| 500 | 303 | 14.87 | 37.77 | 22.90 | 6.94 | 60.62 |
| 250 | 303 | 15.96 | 30.52 | 14.56 | 4.41 | 47.70 |
|
| ||||||
| Uncorrelated Retrospective Gating | ||||||
| Projections | Heart Rate [BPM] | Systole Volume [µL] | End-Diastolic volume [µL] | Stroke Volume [µL] | Cardiac Output [mL/min] | Ejection Fraction [%] |
|
| ||||||
| 1000 | 351 | 12.40 | 31.62 | 19.22 | 6.75 | 60.78 |
| 500 | 351 | 12.78 | 30.98 | 18.20 | 6.39 | 58.75 |
| 250 | 351 | 14.17 | 27.75 | 13.58 | 4.77 | 48.95 |
IV. Discussion and Conclusions
These results demonstrate our ability to perform dynamic cardiac imaging in the mouse and the effectiveness of our reconstruction approach for 4D micro-CT using either fast PG or uncorrelated RG gating strategies. Both gating strategies can be performed quickly and with relatively low preclinical dose. For 10 cardiac phases our reconstructions from 1000 projections represent a dose of 17 mGy per phase, which is significantly lower than our previously published methods for fast PG (25.6 mGy per phase) and RG (28.8 mGy per phase) [39]. Simulating undersampled acquisitions by using only 500 and 250 projections further reduced dose to half and a quarter of this value. The total dose achieved in this work is lower than many published values of dose for cardiorespiratory micro-CT scans; common doses for these scans range from 280 to 500 mGy [14, 16, 20, 40, 41]. The total dose associated with fully sampled fast PG and uncorrelated RG, 170 mGy, represents between 38 to 52 times less than the lethal dose of 6.5–9 Gy, known as LD50/30, for C57BL/6 mice [42]. Such doses enable longitudinal imaging. In addition, each strategy can capture a full cardiac cycle in one rotation. Both strategies result in projections which are angularly interleaved between phases (figure 2), which allows for the creation of a well-sampled temporal average. A well-sampled, temporally-averaged prior image is essential to the success of our 4D iterative reconstruction algorithm. The effects of using a well-sampled prior image in iterative reconstruction can be observed by comparing FBP to our 4D iterative reconstructions (figures 5, 10). This is also confirmed by figure 7, where the new sampling strategies compare favorably to previous methods (i.e. fast PG without continuous rotation and conventional RG) when the same 4D iterative reconstruction algorithm is used.
As shown by simulations, with an equal number of projections and equal dose, the improved fast PG strategy involving continuous rotation during sampling generally outperforms uncorrelated RG in terms of RMSE (figure 6), the SSIM image quality metric (figure 8), and the LV volume segmentation accuracy (figure 9). This result is expected as projections acquired with PG are more cardiac phase-specific than RG projections and comparisons are made between methods using the same total number of projections. To provide sufficient temporal data, RG acquisitions are typically performed with a larger number of projections than PG [39]. We used the same number of projections for each method to compare image quality at similar radiation doses.
A strength of our fast PG strategy is that acquisitions can be done relatively quickly compared to our previous prospective methods (2 minutes vs 5 minutes), with fewer projections (1000 vs 1600), and less dose per phase [39]. The cardiac phases to be sampled and reconstructed are selected prior to scanning. For example, in some studies only data for diastole and systole are needed [43]. By contrast, the power of the uncorrelated RG strategy is in its ability to randomly sample all cardiac phases. This serves to avoid correlation artifacts (see figure 3C vs figure 5C) in the reconstructions.
A primary aim of this work was to explore the dependency of LV volume segmentation accuracy on the gating strategy and number of projections acquired in cardiac micro-CT. It has been proposed for human cardiac CT that volume measurement errors of approximately 5% are acceptable [44, 45]. If we use this error criterion at the preclinical level, our simulations show that only the reconstructions from 1000 projections acquired with fast PG meet this criterion (figure 9). Changes in system noise or improved sampling distributions could make uncorrelated RG with 1000 projections a viable strategy for reliably measuring cardiac functional metrics in 4D micro-CT.
The fast PG strategy provides more robustness to undersampling compared to the RG strategy at 500 projections as is seen with the RMSE (figure 6) and SSIM (figure 8) metrics. The errors in segmented LV volume in both simulations (figure 9) and experimental (figure 11) data are quite high with 250 projections. Thus, depending on the study, these low numbers of projections might not ensure adequate separation of cardiac functional metrics between experimental groups during preclinical studies. However, in studies where the expected differences between the control and the disease groups are larger (e.g. myocardial infarction studies [46]), 500 projections may be sufficient. We note that estimates of stroke volumes are more affected by errors in EDV and ESV. For example, an error of 5% in EDV and ESV could compound to result in more than doubling error in SV. This effect on EF is less prominent due to the normalization to the EDV.
Surprisingly, the experimental data showed that uncorrelated RG performed somewhat better than fast PG with 500 and 250 projections (figure 11). The 500 projection RG case provided relative errors of less than 5% from the 1000 projection case. These experimental results differ from those found in simulations (figure 9) where PG showed lower errors. There are several factors that could explain the differences between simulations and real experimental data. The comparison of undersampled reconstructions to the 1000 projection case may compound errors present in both reconstructions. Nonlinear effects such as scattering or beam hardening present in the experimental data could affect image quality and segmentations in ways not modeled in the simulations. These effects have a greater impact on the reconstructions when fewer projections are used for each phase. PG is particularly susceptible to introduced variations because each cardiac phase is represented by fewer phase-specific projections, while in RG more projections are given non-zero temporal weights. We note that in simulations uncorrelated RG outperforms fast PG in reconstructions from 250 projections (figures 6, 7).
Reconstructions performed with fewer projections generally appear noisier than well-sampled reconstructions. The data-adaptive regularization in our algorithm scales to compensate for this increase in noise (noise standard deviation σ in eqs. 6 and 9), applying proportionally stronger regularization for highly undersampled reconstruction problems. While strong regularization is effective in reducing the noise in the reconstruction, it over-regularizes fine details, resulting in a patchy and overly smooth appearance. This is clearly seen in the experimental reconstructions performed with 250 projections for fast PG and RG (figure 10). The low dose and sampling time for both methods comes at the cost of long reconstruction times. The most time intensive fast PG reconstruction, using all 1000 projections, took close to 6 hours to complete 3 iterations, while the same size RG set required more than 13 hours. These time constraints currently limit the number of projections we can efficiently use for reconstruction. Time and computational resources prevented the exploration of iterative reconstructions using significantly more than 1000 projections. Access to more powerful hardware or parallel GPU computing resources will certainly make it feasible to collect and reconstruct larger datasets in the future.
In conclusion, we have developed novel, 4D micro-CT imaging methods using fast PG and uncorrelated RG gating strategies. Both strategies demonstrate promise for low-dose, high-throughput, longitudinal imaging, with immediate applications in a wide range of preclinical studies such as in cardiopulmonary safety and cancer research [47].
Supplementary Material
Acknowledgments
All work was performed at the Duke Center for In Vivo Microscopy, an NIH/NIBIB national Biomedical Technology Resource Center (P41 EB015897). This work was also supported by the NIH National Cancer Institute (R01 CA196667) and NIH Grant #T32-EB001040.
References
- 1.Clark DP, Badea CT. Micro-CT of rodents: state-of-the-art and future perspectives. Phys Med. 2014;30(6):619–34. doi: 10.1016/j.ejmp.2014.05.011. [DOI] [PMC free article] [PubMed] [Google Scholar]
- 2.Badea CT, et al. 4D micro-CT for cardiac and perfusion applications with view under sampling. Phys Med Biol. 2011;56(11):3351–3369. doi: 10.1088/0031-9155/56/11/011. [DOI] [PMC free article] [PubMed] [Google Scholar]
- 3.Sawall S, et al. Imaging of cardiac perfusion of free-breathing small animals using dynamic phase-correlated micro-CT. Medical Physics. 2012;39(12):7499–7506. doi: 10.1118/1.4762685. [DOI] [PubMed] [Google Scholar]
- 4.Badea C, et al. 4D micro-CT of the mouse heart. Molecular Imaging. 2005;4(2):110–116. doi: 10.1162/15353500200504187. [DOI] [PubMed] [Google Scholar]
- 5.Badea CT, et al. Cardiac Micro-Computed Tomography for Morphological and Functional Phenotyping of Muscle LIM Protein Null Mice. Mol Imaging. 2007;6(4):261–8. [PMC free article] [PubMed] [Google Scholar]
- 6.Badea CT, Schreibmann E, Fox T. A registration-based approach for cardiac micro-CT using combined prospective and retrospective gating. Medical Physics. 2008;35(4):1170–1179. doi: 10.1118/1.2868778. [DOI] [PMC free article] [PubMed] [Google Scholar]
- 7.Feldkamp LA, Davis LC, Kress JW. Practical cone-beam algorithm. J. Opt. Soc. Am. 1984;1(6):612–19. [Google Scholar]
- 8.Badea CT, et al. Left ventricle volume measurements in cardiac micro-CT: The impact of radiation dose and contrast agent. Comput Med Imaging Graph. 2008;32(3):239–50. doi: 10.1016/j.compmedimag.2007.12.004. [DOI] [PMC free article] [PubMed] [Google Scholar]
- 9.Cao G, et al. Prospective-gated cardiac micro-CT imaging of free-breathing mice using carbon nanotube field emission x-ray. Med Phys. 2010;37(10):5306–12. doi: 10.1118/1.3491806. [DOI] [PMC free article] [PubMed] [Google Scholar]
- 10.Guo X, et al. 4D micro-CT using fast prospective gating. Phys Med Biol. 2012;57(1):257–71. doi: 10.1088/0031-9155/57/1/257. [DOI] [PMC free article] [PubMed] [Google Scholar]
- 11.Sawall S, et al. Low-dose cardio-respiratory phase-correlated cone-beam micro-CT of small animals. Medical Physics. 2011;38(3):1416–1424. doi: 10.1118/1.3551993. [DOI] [PubMed] [Google Scholar]
- 12.Ritschl L, et al. Improved total variation-based CT image reconstruction applied to clinical data. Phys Med Biol. 2011;56(6):1545–61. doi: 10.1088/0031-9155/56/6/003. [DOI] [PubMed] [Google Scholar]
- 13.Chen GH, Tang J, Leng S. Prior image constrained compressed sensing (PICCS): a method to accurately reconstruct dynamic CT images from highly undersampled projection data sets. Med Phys. 2008;35(2):660–3. doi: 10.1118/1.2836423. [DOI] [PMC free article] [PubMed] [Google Scholar]
- 14.Brehm M, et al. Cardiorespiratory motion-compensated micro-CT image reconstruction using an artifact model-based motion estimation. Med Phys. 2015;42(4):1948–58. doi: 10.1118/1.4916083. [DOI] [PubMed] [Google Scholar]
- 15.Tang J, Hsieh J, Chen GH. Temporal resolution improvement in cardiac CT using PICCS (TRI-PICCS): performance studies. Med Phys. 2010;37(8):4377–88. doi: 10.1118/1.3460318. [DOI] [PubMed] [Google Scholar]
- 16.Drangova M, et al. Fast Retrospectively Gated Quantitative Four-Dimensional (4D) Cardiac Micro Computed Tomography Imaging of Free-Breathing Mice. Invest Radiol. 2007;42(2):85–94. doi: 10.1097/01.rli.0000251572.56139.a3. [DOI] [PubMed] [Google Scholar]
- 17.Bartling SH, et al. Retrospective motion gating in small animal CT of mice and rats. Invest Radiol. 2007;42(10):704–14. doi: 10.1097/RLI.0b013e318070dcad. [DOI] [PubMed] [Google Scholar]
- 18.Song J, et al. Sparseness prior based iterative image reconstruction for retrospectively gated cardiac micro-CT. Med Phys. 2007;34(11):4476–83. doi: 10.1118/1.2795830. [DOI] [PMC free article] [PubMed] [Google Scholar]
- 19.Ritschl L, et al. Iterative 4D cardiac micro-CT image reconstruction using an adaptive spatio-temporal sparsity prior. Phys Med Biol. 2012;57(6):1517–25. doi: 10.1088/0031-9155/57/6/1517. [DOI] [PubMed] [Google Scholar]
- 20.Armitage SEJ, et al. Least-error projection sorting to optimize retrospectively gated cardiac micro-CT of free-breathing mice. Medical Physics. 2012;39(3):1452–1461. doi: 10.1118/1.3681949. [DOI] [PubMed] [Google Scholar]
- 21.Clark DP, et al. Spectrotemporal CT data acquisition and reconstruction at low dose. Med Phys. 2015;42(11):6317. doi: 10.1118/1.4931407. [DOI] [PMC free article] [PubMed] [Google Scholar]
- 22.Badea C, et al. SPIE, Medical Imaging. SPIE; San Diego, CA: 2008. A Dual Micro-CT System for Small Animal Imaging. [DOI] [PMC free article] [PubMed] [Google Scholar]
- 23.Kak AC, Slaney M. Principles of Computerized Tomographic Imaging. New York: IEEE Press; 1988. [Google Scholar]
- 24.Segars WP, et al. Development of a 4-D digital mouse phantom for molecular imaging research. Molecular Imaging & Biology. 2004;6(3):149–159. doi: 10.1016/j.mibio.2004.03.002. [DOI] [PubMed] [Google Scholar]
- 25.Goldstein T, Osher S. The split Bregman method for L1-regularized problems. SIAM Journal on Imaging Sciences. 2009;2(2):323–343. [Google Scholar]
- 26.Gao H, et al. Multi-energy CT based on a prior rank, intensity and sparsity model (PRISM) Inverse Probl. 2011;27(11) doi: 10.1088/0266-5611/27/11/115012. [DOI] [PMC free article] [PubMed] [Google Scholar]
- 27.Van der Vorst HA. Bi-CGSTAB: A fast and smoothly converging variant of Bi-CG for the solution of nonsymmetric linear systems. SIAM Journal on Scientific and Statistical Computing. 1992;13(2):631–644. [Google Scholar]
- 28.Clark DP, Badea CT. Hybrid spectral CT reconstruction. PLoS One. 2017;12(7):e0180324. doi: 10.1371/journal.pone.0180324. [DOI] [PMC free article] [PubMed] [Google Scholar]
- 29.Elad M. Analysis of the bilateral filter; Thirty-Sixth Asilomar Conference on Signals, Systems & Computers - Conference Record, Vols 1 and 2, Conference Record; 2002. pp. 483–487. [Google Scholar]
- 30.Farsiu S, et al. Fast and robust multiframe super resolution. Ieee Transactions on Image Processing. 2004;13(10):1327–1344. doi: 10.1109/tip.2004.834669. [DOI] [PubMed] [Google Scholar]
- 31.Tomasi C, Manduchi R. Bilateral filtering for gray and color images; Proc. of the 1998 IEEE International Conference on Computer Vision; 1998. pp. 839–46. [Google Scholar]
- 32.Long Y, Fessler JA, Balter JM. 3D forward and back-projection for X-ray CT using separable footprints. IEEE Trans Med Imaging. 2010;29(11):1839–50. doi: 10.1109/TMI.2010.2050898. [DOI] [PMC free article] [PubMed] [Google Scholar]
- 33.Wang Z, et al. Image quality assessment: from error visibility to structural similarity. IEEE Trans Image Process. 2004;13(4):600–12. doi: 10.1109/tip.2003.819861. [DOI] [PubMed] [Google Scholar]
- 34.Yushkevich PA, et al. User-guided 3D active contour segmentation of anatomical structures: significantly improved efficiency and reliability. Neuroimage. 2006;31(3):1116–28. doi: 10.1016/j.neuroimage.2006.01.015. [DOI] [PubMed] [Google Scholar]
- 35.Otsu N. A threshold selection method for gray level histogram. IEEE Trans. on Systems, Man, and Cybernetics. 1979;SMC-9(1):62–66. [Google Scholar]
- 36.Schneider CA, Rasband WS, Eliceiri KW. NIH Image to ImageJ: 25 years of image analysis. Nat Methods. 2012;9(7):671–5. doi: 10.1038/nmeth.2089. [DOI] [PMC free article] [PubMed] [Google Scholar]
- 37.Mukundan S, et al. A Nanoscale, Liposomal Contrast Agent for Preclincal MicroCT Imaging of the Mouse. AJR. 2006;186:300–307. doi: 10.2214/AJR.05.0523. [DOI] [PubMed] [Google Scholar]
- 38.De Lin M, et al. Application of MOSFET detectors for dosimetry in small animal radiography using short exposure times. Radiat Res. 2008;170(2):260–3. doi: 10.1667/RR1328.1. [DOI] [PMC free article] [PubMed] [Google Scholar]
- 39.Guo XL, et al. 4D micro-CT using fast prospective gating. Phys Med Biol. 2012;57(1):257–271. doi: 10.1088/0031-9155/57/1/257. [DOI] [PMC free article] [PubMed] [Google Scholar]
- 40.Maier J, Sawall S, Kachelriess M. Assessment of dedicated low-dose cardiac micro-CT reconstruction algorithms using the left ventricular volume of small rodents as a performance measure. Med Phys. 2014;41(5):051908. doi: 10.1118/1.4870983. [DOI] [PubMed] [Google Scholar]
- 41.Graham KC, et al. Noninvasive quantification of tumor volume in preclinical liver metastasis models using contrast-enhanced x-ray computed tomography. Invest Radiol. 2008;43(2):92–9. doi: 10.1097/RLI.0b013e31815603d7. [DOI] [PubMed] [Google Scholar]
- 42.Williams JP, et al. Animal models for medical countermeasures to radiation exposure. Radiat Res. 2010;173(4):557–78. doi: 10.1667/RR1880.1. [DOI] [PMC free article] [PubMed] [Google Scholar]
- 43.Badea CT, et al. Micro-CT imaging assessment of dobutamine-induced cardiac stress in rats. Journal of Pharmacological and Toxicological Methods. 2011;63(1):24–29. doi: 10.1016/j.vascn.2010.04.002. [DOI] [PMC free article] [PubMed] [Google Scholar]
- 44.Haraokawa T, et al. Accuracy of LV Volume Assessment Using Cardiac MSCT. RSNA. 2004 [Google Scholar]
- 45.Detombe SA, et al. Longitudinal follow-up of cardiac structure and functional changes in an infarct mouse model using retrospectively gated micro-computed tomography. Invest Radiol. 2008;43(7):520–9. doi: 10.1097/RLI.0b013e3181727519. [DOI] [PubMed] [Google Scholar]
- 46.Nahrendorf M, et al. High-resolution imaging of murine myocardial infarction with delayed-enhancement cine micro-CT. Am J Physiol Heart Circ Physiol. 2007;292(6):H3172–8. doi: 10.1152/ajpheart.01307.2006. [DOI] [PMC free article] [PubMed] [Google Scholar]
- 47.Lee CL, et al. Assessing Cardiac Injury in Mice With Dual Energy-MicroCT, 4D-MicroCT, and MicroSPECT Imaging After Partial Heart Irradiation. Int J Radiat Oncol Biol Phys. 2014;88(3):686–93. doi: 10.1016/j.ijrobp.2013.11.238. [DOI] [PMC free article] [PubMed] [Google Scholar]
Associated Data
This section collects any data citations, data availability statements, or supplementary materials included in this article.


