Abstract
Background and Purpose
Quantitative susceptibility mapping has been previously used to differentiate lesions in patients with brain tumors. The aim of this work was to characterize the response of magnetic susceptibility differences in malignant brain tumors and surrounding edema to hyperoxic and hypercapnic respiratory challenges.
Methods
Images of malignant brain tumor patients (2 glioblastoma multiforme, 2 anaplastic astrocytoma, 1 brain metastasis) with clinical MRI exams (contrast-enhanced T1w) were acquired at 3T. 3D multi-gradient-echo data sets were acquired while the patients inhaled medical-air (21% O2), oxygen (100% O2), and carbogen (95% O2, 5% CO2). Susceptibility maps were generated from real and imaginary data. Regions of interest were analyzed with respect to respiration-gas-induced susceptibility changes.
Results
Contrast-enhancing tumor regions with high baseline magnetic susceptibility exhibited a marked susceptibility reduction under hyperoxic challenges, with a stronger effect (−0.040 to −0.100 ppm) under hypercapnia compared to hyperoxia (−0.010 to −0.067 ppm). In contrast, regions attributed to necrotic tissue and to edema showed smaller changes of opposite sign, i.e. paramagnetic shift. There was a correlation between malignant tumor tissue magnetic susceptibility at baseline under normoxia and the corresponding susceptibility reduction under hypercapnia and – to a lesser degree – under hyperoxia.
Conclusion
In this small cohort of analysis, quantification of susceptibility changes in response to respiratory challenges allowed a complementary, functional differentiation of tumorous sub-regions. Those changes, together with the correlations observed between baseline susceptibility under normoxia and susceptibility reduction with challenges, could prove helpful for a non-invasive characterization of local tumor microenvironment.
Keywords: magnetic susceptibility, quantitative susceptibility mapping, hyperoxia, glioblastoma, oxygenation
1. INTRODUCTION
High-grade gliomas are most prevalent among primary malignant brain tumors. They rapidly progress, there is no healing therapy (1), and there are only few long-term survivors. High-grade gliomas, such as glioblastoma multiforme (GBM) and anaplastic astrocytoma (AA), can radiologically present as heterogeneous lesions with sub-volumes of varying physiological characteristics, e.g., containing well-vascularized or necrotic areas with surrounding edema. An optimal adaptation of a multi-modality treatment, such as the planning of post-surgical radiotherapy, could hypothetically capitalize on more detailed functional information on different residual tumor compartments. Their oxygenation state may be of particular interest, since hypoxic cells are known to commonly occur in high-grade gliomas (2, 3) and to often less sensitively respond to radiation and chemotherapy (2, 4). Attempts at increasing tissue oxygenation, e.g., via respiratory intake of pure oxygen at elevated pressure either during or before (5) radiotherapy, achieved mixed results, with partly improved therapy response (6) but also disadvantages that so far have impeded widespread adoption (5). Easily accessible and spatially well resolved information from non-invasive imaging on hypoxia (7), the effective local hypoxia subtype (8), or the response to attempts at manipulation of tissue oxygenation, could possibly foster an improved understanding of the tumor microenvironment and ultimately help improve therapy (2, 8). The respiratory intake of hyperoxic gas mixtures can directly change local tissue blood flow, blood volume, blood oxygenation, or tissue concentration of dissolved molecular oxygen (9). Most earlier attempts at a non-invasive monitoring of respiratory-challenge effects based on susceptibility-weighted imaging and on R2* (T2*) mapping (10–12), while a few studies additionally also mapped R1 (T1) changes (13, 14). However, T2*w imaging and R2* mapping depend on voxel size or local shim, can vary from scan to scan, and do not predominantly reflect absolute values of tissue parameters, such as the venous oxygen saturation (SvO2), but instead more strongly reflect their local gradients. Pixel intensities in phase and susceptibility-weighted images in turn can be affected by non-local effects, e.g., caused by larger nearby vessels. A more direct access to the local tissue response is potentially offered by Quantitative Susceptibility Mapping (QSM) that measures absolute tissue magnetic susceptibility, which varies with the oxygen saturation of blood and, in the current context, with the local concentration of dissolved molecular oxygen. It well differentiates gray and white matter, venous blood vessels, and a variety of tissues with magnetic susceptibilities different from that of healthy parenchyma (15). In this pilot study, our aim was to comparatively map brain tissue magnetic susceptibility in patients with malignant brain tumors while they inhaled pure oxygen, carbogen, or medical air, and to measure the local susceptibility response to respiratory induced hyperoxia.
2. MATERIALS AND METHODS
2.1 Subjects
This was a prospective study approved by the local institutional review board committee. Patients were recruited from the department of radiation oncology or the department of neurology of our institution during a consultation or per telephone call after patient case presentation in the tumor board of the hospital. Six consenting patients were prospectively included in this QSM study. The data of one of the patients suffered from too severe motion artifacts for an evaluation. Hence, five patients with malignant brain tumors were included. Four patients suffered from high-grade gliomas (2 glioblastoma multiforme and 2 anaplastic astrocytoma) and one patient had a cerebellar metastasis of a medullary thyroid carcinoma. In total 7 contrast enhancing lesions were analyzed in 5 patients. All participants gave written informed consent to the MR examination and the scientific evaluation of the data. Information on the patient cohort is summarized in Table 1.
Table 1.
Patient characteristics. Patient’ ages are measured at the time of the MR exam.
| Patient Number |
Gender | Age | Tumor type |
|---|---|---|---|
| P #1 | Male | 52 | Glioblastoma multiforme |
| P #2 | Male | 32 | Glioblastoma multiforme |
| P #3 | Male | 47 | Anaplastic astrocytoma |
| P #4 | Female | 31 | Anaplastic astrocytoma |
| P #5 | Male | 50 | Cerebellar metastasis |
2.2 MR data acquisition
The data were acquired on a 3T whole-body scanner (Ingenia, Philips, Best, The Netherlands) with a 15-channel head coil (Philips Healthcare, Best, The Netherlands).
2.2.1 Gas administration
The patients successively inhaled medical air, pure oxygen, and carbogen delivered from a gas tank positioned outside the magnet room with a plastic tubing via a facial mask (Dahlhausen, Cologne, Germany). In order to allow comfortable breathing, the gas flow was set to 10 l min−1. To account for the time lag of the response to the each gas challenge, each gas type was delivered for 3 min before and then during the gradient-echo acquisition. During GRE scans, the oxygen saturation and the pulse rate were measured and the inspired and expired oxygen concentrations and the breathing rate were monitored.
2.2.2 Gradient echo (GRE) MR exam
For quantitative susceptibility mapping, data from a multi-gradient-echo sequence (FA = 50°, TE1 = 5.8ms, TE5 = 69.8ms, ΔTE = 16ms, TR = 74ms, voxel dimensions = 0.87 × 0.87 × 2 mm3, matrix size = 256 × 256 × 55) were acquired, while the patients inhaled medical air (21% O2), pure oxygen (100% O2) and carbogen (95% O2, 5% CO2). The protocol was repeated for each gas composition.
2.2.3 Clinical exams
All patients had several clinical MR exams with multiple image series and contrast weightings. The clinical exams closest to the respiratory challenge exam were conducted within 10 hours to 22 days before or after the MR exam. They included T1-weighted 3D-MPRAGE image acquisitions (FA = 90, TE = 2.6ms, TR = 1670ms, voxel dimensions = 0.49 × 0.49 × 0.9 mm3) after administration of gadopentetate (0.1 mmol/kg) in all cases.
2.3 Phase processing
Multi-echo phase data was combined assuming a linear weighted phase increment (16), followed by Laplacian unwrapping and background-field removal (threshold = 0.05) (17). Quantitative susceptibility maps were generated by dipolar inversion of the background-corrected phase maps via a LSQR fit (18), using magnitude values of the 1st echo signal as weights, and with the maximum number of iterations set to 150. Processing of phase data, and as well further analyses described below, were done via in-house implemented Python and MATLAB routines.
2.4 Region of interest analysis
MPRAGE data were registered to 1st-echo magnitude data in SPM12 (19). Identification of contrast-enhancing tumor regions, necrotic areas within the tumor and surrounding edematous tissue for the placement of the regions of interest (ROI) was guided by the images from the clinically indicated MR exams in combination with the gradient-echo magnitude images. The identification of “lesions” based on contrast-enhanced images and corresponding ROI were placed in parts of strongly enhancing tissue, which, based on the susceptibility maps, quite consistently also had a high magnetic susceptibility. The ROI placement was guided and cross-checked by a radio-oncologist (SS). The necrotic and edematous regions were identified after visual comparison of available clinical image series of the patient and the study-exam series (T2w, contrast enhanced T1w, and GRE magnitude). Lesion volumes are calculated based on QSMs, and reported in Table 2.
Table 2.
Susceptibility values in ppm with respect to that in healthy appearing frontal white matter (at 0 ppm) for each region of interest as measured under the three respiratory gas regimes.
| Medical air |
Oxygen | Carbogen | Patient Diagnosis |
Tumor volume (in cm3) |
|
|---|---|---|---|---|---|
| Lesion 1 | 0.188 | 0.15 | 0.106 | Multifocal Glioblastoma | 0.4 |
| (P #1) | |||||
| Lesion 2 | 0.264 | 0.197 | 0.156 | Multifocal Glioblastoma | 0.21 |
| (P #1) | |||||
| Lesion 3 | 0.037 | 0.02 | 0.017 | Glioblastoma | 0.03 |
| (P #2) | |||||
| Lesion 4 | 0.137 | 0.111 | 0.094 | Anaplastic Astrocytoma | 0.1 |
| (P #3) | |||||
| Lesion 5 | 0.085 | 0.073 | 0.043 | Anaplastic Astrocytoma | 0.05 |
| (P #3) | |||||
| Lesion 6 | 0.131 | 0.104 | 0.089 | Anaplastic Astrocytoma | 0.34 |
| (P #4) | |||||
| Lesion 7 | 0.282 | 0.258 | 0.201 | Brain Metastasis | 0.03 |
| (P #5) | |||||
|
| |||||
| Edema 1 | −0.047 | −0.028 | −0.02 | (Multifocal Glioblastoma) | |
| (P #1) | |||||
| Edema 2 | −0.008 | 0.005 | 0.007 | (Anaplastic Astrocytoma) | |
| (P #3) | |||||
| Necrosis | −0.021 | −0.005 | 0.001 | (Multifocal Glioblastoma) | |
| (P #1) | |||||
Mean ROI susceptibility values under the different breathing regimes, i.e. medical air, oxygen and carbogen, were measured. Values from corresponding ROIs were referenced with respect to healthy appearing frontal white matter, which was set to zero in all data sets, as it is minimally affected by the hyperoxic respiratory challenges (16). Statistical testing for significant differences between gas challenges involved paired two-tailed t-tests (p < 0.05).
2.5 Linear regression
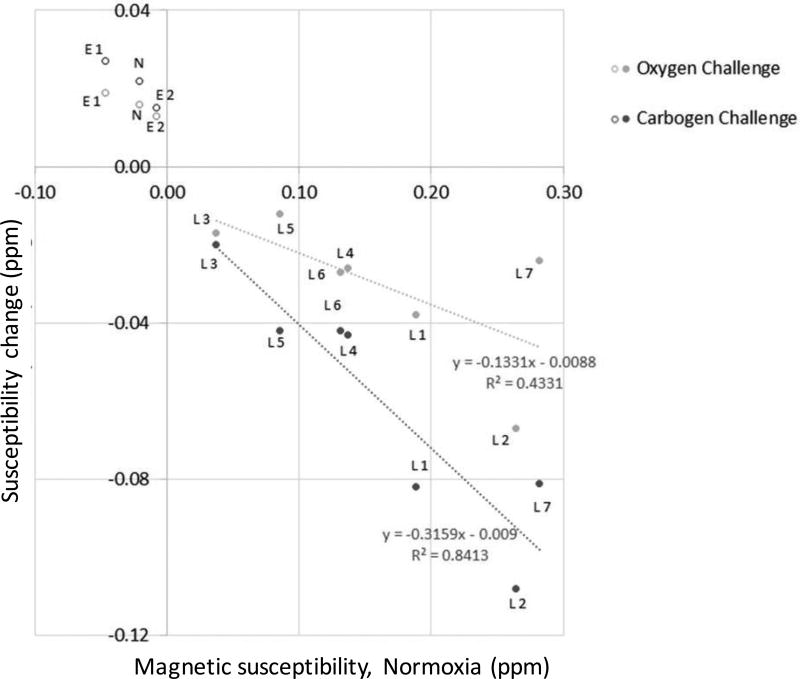
A potential correlation between oxygen- or carbogen-induced change of magnetic susceptibility and the observed baseline value of magnetic susceptibility under normoxia was assessed by means of linear regression analysis of the data in contrast-enhancing lesions. The regions of necrosis and edema were not included in the regression due to their opposite trend.
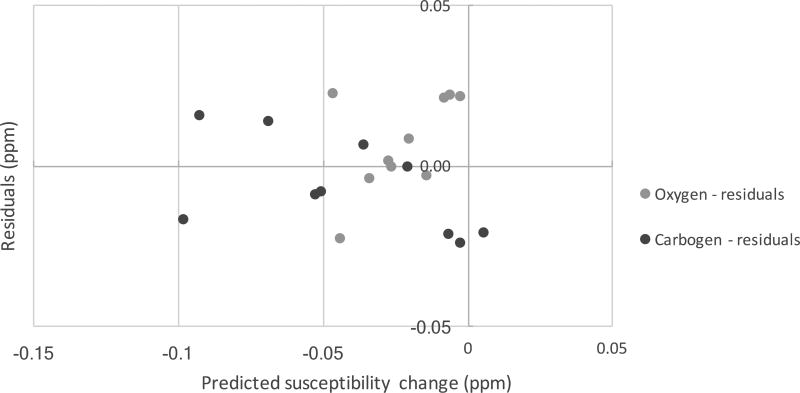
The uncertainties of the slopes and F statistics from regression analyses were calculated and reported. Figure 8 further illustrates the normality of the data via plotting of the residuals (calculated vs. known susceptibility changes) vs. predicted susceptibility changes under hyperoxia and hypercapnia.
Figure 8.
Residuals of the fits shown in Fig. 7 (predicted – measured values versus predicted values).
3. RESULTS
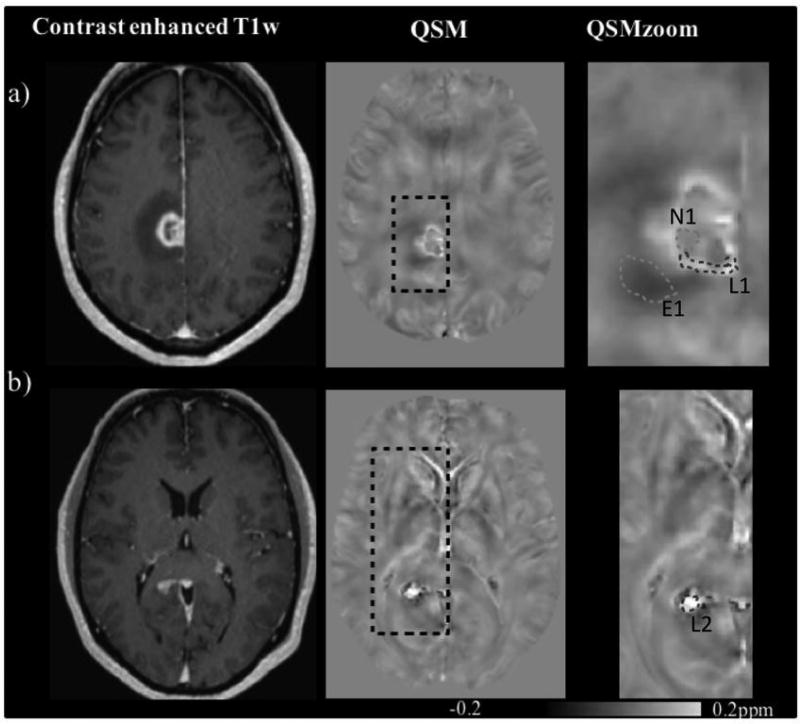
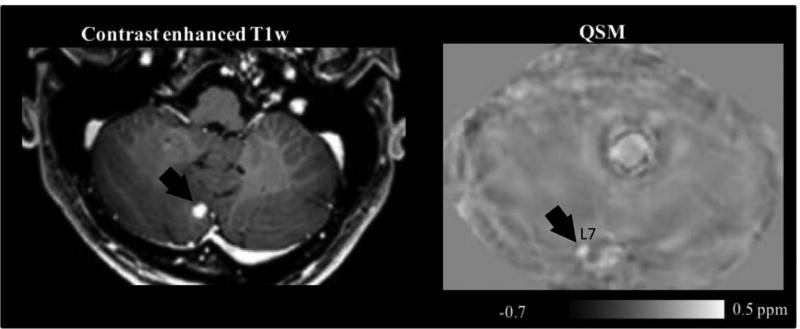
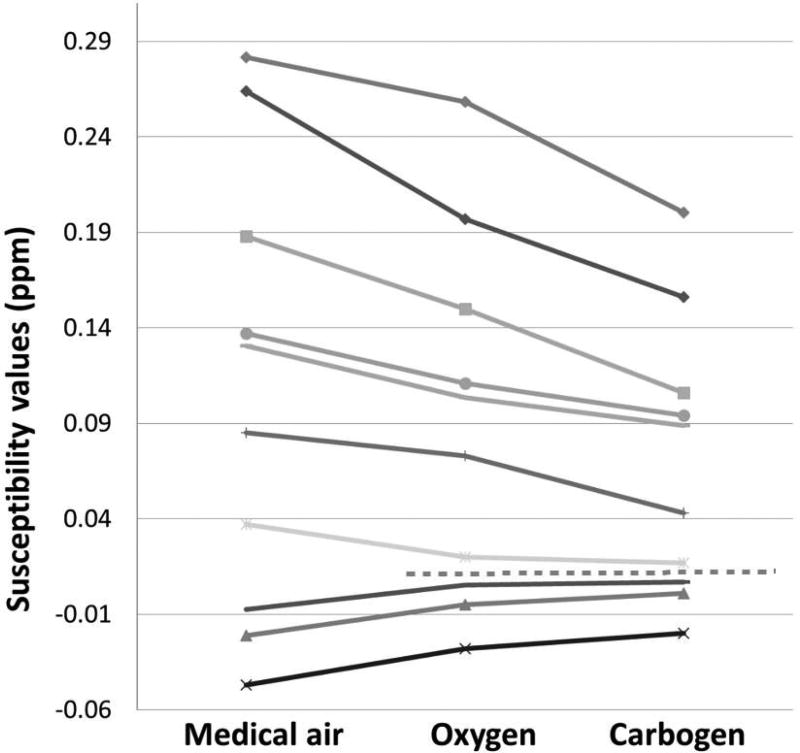
All patients tolerated the exams well, and did not report any adverse effects of inhaling oxygen or carbogen. Figures 1 through 5 show images of patients 1 to 5, respectively. The susceptibility changes observed under respiratory-induced hyperoxia are summarized in Fig. 6. Under normoxia, i.e., while inhaling medical air, the seven contrast-enhancing tumor regions showed positive magnetic susceptibilities (range: +0.037 to +0.282 ppm, versus white matter). This lesion group exhibited a significant diamagnetic shift, i.e., a mean magnetic susceptibility reduction upon oxygen inhalation (−0.030 ± 0.018ppm, p<0.005, range: −0.01 to −0.067 ppm), and an even larger me a n susceptibility decrease during carbogenic hyperoxia (−0.060 ± 0.031ppm, p<0.003, range 0.04 to −0.1 ppm). The carbogen-induced effect in this lesion group was nearly two-fold larger than that of oxygen, with the additional susceptibility decrease reaching −0.030 ± 0.019 ppm (p<0.006). The primary tumor lesions in the multifocal glioblastoma case (patient 1 with 2 lesions with an average shift of −0.095 ± 0.018 ppm) and in the brain metastasis (patient 5, shift of −0.081 ppm) showed larger diamagnetic shifts upon respiratory-induced hypercapnic hyperoxia, while smaller changes were observed in the contrast-enhancing tumorous lesions of anaplastic astrocytoma (patients 3–4, −0.042 ± 0.001 ppm).
Figure 1.
Contrast (extracellular gadolinium) enhanced T1w (left) and QSM (middle and right, acquired under breathing of medical air) images of patient 1 with multifocal glioblastoma. The right most column shows zoomed versions of the black dotted rectangles in the central images. a) Primary tumor lesion in the gyrus cinguli with a rim of contrast-enhancing tumor tissue (lesion 1, L1) circumventing a central necrotic area (necrosis, N1) with peripheral edema (edema 1, E1), b) a contrast enhancing lesion in the splenium corpus callosum (lesion 2, L2).
Figure 5.
Contrast enhanced T1w (a) and QSM (intake of medical air) image (b) of patient 5 with a thyroid carcinoma. The arrows point to a metastatic cerebellar tumor, i.e., lesion 7, L7, in both images. The corresponding ROI is not shown.
Figure 6.
Susceptibility differences with respect to white matter susceptibility in parts per million (ppm) and in regions of interest defined in Figures 1 to 5 as they were measured during normoxia as well as under oxygen- and carbogen-induced hyperoxic respiratory challenge, respectively. Lines from top to bottom: lesion 7, lesion 2, lesion 1, lesion 4, lesion 6, lesion 5, lesion 3, edema 2, necrosis 1, edema 1. The dotted horizontal line separates data points of ROIs that exhibited diamagnetic shifts (susceptibility reduction) under hyperoxic challenge (above the line) and data points of ROIs with a paramagnetic shift (increased magnetic susceptibility) under hyperoxic challenge. All shifts observed under oxygen intake were equally observed with increased magnitude under carbogen intake.
In contrast to these, regions assigned to edema and necrosis showed negative magnetic susceptibilities (range: −0.047 to −0.008 ppm, versus white matter), and exhibited a paramagnetic shift towards increased magnetic susceptibility under oxygen challenge (range: 0.013 to 0.019 ppm). Again, a similar but stronger effect was observed under carbogen breathing with paramagnetic shifts (range: 0.015 to 0.027 ppm). There was a correlation between the oxygen-induced change of magnetic susceptibility and the observed baseline value of magnetic susceptibility under normoxia with a slope of −0.13, (uncertainty of the slope: 51%), and a squared correlation coefficient, r2, of 0.43 (Figure 7). The correlation was stronger for the carbogen-induced changes of magnetic susceptibility with slope and r2 values of −0.32 and 0.84 (uncertainty of the slope: 19%), respectively. F-statistics were 3.8 for oxygen, and 26.5 for carbogen breathing, with a critical value of 10.13 for a confidence interval of 0.05 (see table (20)).
Figure 7.
Changes of magnetic susceptibility (ROI means, in ppm) induced by the respiratory intake of pure oxygen and carbogen, respectively, as a function of baseline magnetic susceptibility measured under normoxia. The straight lines indicate least-square linear fits of the data in contrast-enhancing ROIs (“lesions”, marked by filled circles labelled “Ln”) for the two hyperoxic challenges, respectively. Open circles represent data points that were not included in the linear fits, labelled “En” for edema, and N for necrosis, where “n” represents a number as defined in the text.
4. DISCUSSION
Hyperoxia- and hypercapnia-induced variations of tissue magnetic susceptibility likely are most strongly linked to variations in the blood pool, i.e., local cerebral blood volume and average concentration of deoxyhemoglobin in a voxel and in particular in the venous vessel tree, i.e., SvO2 (16). An increase of the mean SvO2 in a voxel – in the absence of any other changes – would cause a reduction of the apparent corresponding magnetic susceptibility. Such a susceptibility-reduction response was found for all contrast-enhancing tumor areas in the current study, with the largest response measured in compact glioblastoma and brain metastasis, and a smaller response found in anaplastic astrocytoma. In contrast, in less well-perfused tissue with an increased extracellular volume fraction, a higher fluid content, and a lower blood-volume fraction, an additional opposite effect, i.e. an increase of the average magnetic susceptibility is expected and rationalized with an increased concentration of dissolved paramagnetic molecular O2 (21). In the current study this second effect was found to dominate the response in necrotic tissue and also in two cases of edematous tissue. Our finding matches well with a previous study (22), which shows an approximately 30 ppb increase in the susceptibility of oxygenated water versus reference water. The consistently larger magnitudes of the susceptibility changes observed under hypercapnia than under O2-hyperoxia may be explained by carbogen-induced vasodilation and the corresponding increased tissue perfusion, in addition to the slightly higher arterial O2 saturation levels (10, 11). In the current study, strongly contrast-enhancing tumor tissue quite consistently exhibited relatively large magnetic susceptibility already under normoxia and a marked susceptibility reduction under both challenges. E.g., the contrast- enhancing rim of a malignant GBM lesion in the T1w image was accompanied by a similar but narrower rim of high susceptibility and large carbogen-induced susceptibility-decrease in QSM (patient 1, Figure 5, lesion 1). Also, there was a correlation between the hypercapnia-induced susceptibility reduction and the baseline susceptibility value in contrast-enhancing malignant lesions, and this correlation was weaker for the corresponding hyperoxia-induced susceptibility reduction. The observed susceptibility changes in malignant lesions under hyperoxia in the current study were higher than the changes reported for gray matter in healthy volunteers (16), but clearly lower than those observed in sagittal sinus in the same volunteer set (16). This may suggest that all our analyzed contrast- enhancing tumor regions of interest indeed enclosed a substantial amount of tissue as opposed to mostly vessels.
In a previous study, it was already proven that QSM was useful to help differentiating a variety of tissues with magnetic susceptibilities different from that of healthy parenchyma (15). Other studies (10, 11) used susceptibility weighted and T2* weighted images to investigate the response of healthy and tumor tissue to carbogen breathing. Rauscher et al. (11) reported comparative gradient-echo signal intensities in susceptibility-weighted images of glioma patients during air and carbogen inhalation. In very good agreement with the current study, they observed a signal increase, likely explained by an increased SvO2, in contrast-enhancing glioblastoma tumor rims, while they observed a decreased signal in necrotic tumor centers and peri-tumoral, likely edematous tissue. Rauscher et al. (11) also reported smaller effects and even small signal decreases in anaplastic astrocytoma. In our study, we also found smaller susceptibility reductions in lesions 4–6 (anaplastic astrocytoma) than in comparison to lesions 1–2 (GBM). In comparison to signal-intensity changes as analyzed, e.g., by Rauscher et al., changes of magnetic susceptibility as measured by QSM may have the potential to be better reproducible and comparable across longitudinal studies and/or multiple sites (23).
Our results are also in good agreement with another study (12) that investigated the response of the R2* relaxation rate to respiratory challenges in a heterogeneous small patient group with intracranial tumors. It reported a R2* decrease in the majority of the malignant tumors, and an increase of or unchanged R2* in regions of edema and necrotic tissue. However, as demonstrated, e.g., in an earlier study (16), if not accounted for, paramagnetic molecular oxygen in the frontal cavities can negatively affect the local R2* quantification. Hence, its value in hyperoxia- and hypercapnia studies may be limited in comparison to that of QSM.
Our work is limited by the small and heterogeneous patient group. On the other hand, significant heterogeneity is to be expected even if this were a larger cohort of only glioblastomas. There are many variables that may have an effect on tumor perfusion and its response to gas challenges including the maturity of the tumor vasculature (24), tumor blood volume as a function of micro vessel density, and even effectiveness of red blood cell transport along tumoral vessels (25). As last, clinical MR exams were n o t acquired with a consistent and systematic time difference in relation to the QSM measurements. While this time difference was less than 5 days for 3 patients, it was around 3 weeks for patients 3 and 5. Nevertheless, the results seem to indicate quite consistent trends. Another limitation of our work could be the presence of hysteresis and saturation effects, with the times between the different gas-breathing regimes being relatively short and with carbogen breathing consistently following oxygen breathing.
In this work, we measured magnetic tissue susceptibility in a patient cohort with malignant brain tumors under two different gas challenges and under normoxic conditions. We found examples of glioblastoma and cerebral metastasized tumors that more strongly responded to hypercapnic and hyperoxic respiratory gas challenges with a larger decrease of magnetic susceptibility than the corresponding response in anaplastic astrocytoma and trends for changes of opposite sign in edematous and necrotic tissue. Finally, there was a correlation between malignant tumor tissue magnetic susceptibility at baseline under normoxia and the corresponding susceptibility reduction under hypercapnia and – to a lesser degree – under hyperoxia. In case our preliminary results could be corroborated in more extended studies, QSM-based tumor characterization under norm- and hyperoxia/hypercapnia could hypothetically be useful during the planning of radiotherapy.
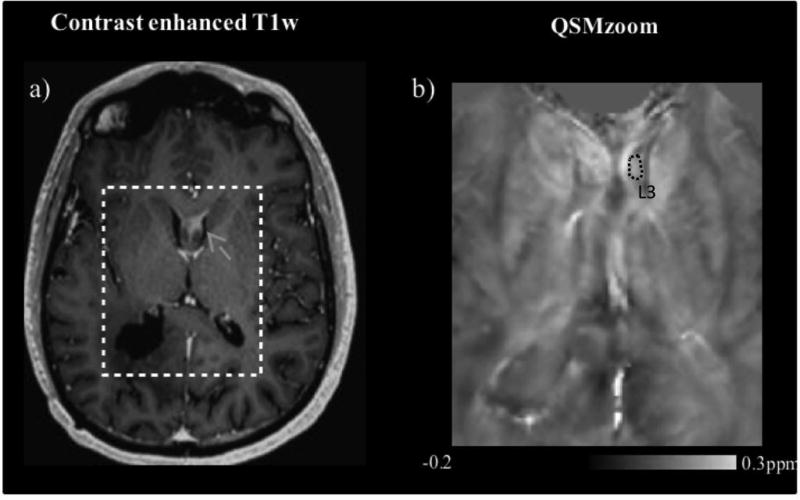
Figure 2.
a) Contrast enhanced T1w, b) QSM (under intake of medical air) images of a tumor-recurrence involving the fornices, in glioblastoma patient 2. The susceptibility map on the right (b) approximately shows the cropped region indicated in the T1w image (a). The grey arrow in (a) indicates the recurrent lesion, and the dotted circle in (b) the corresponding ROI (lesion 3, L3).
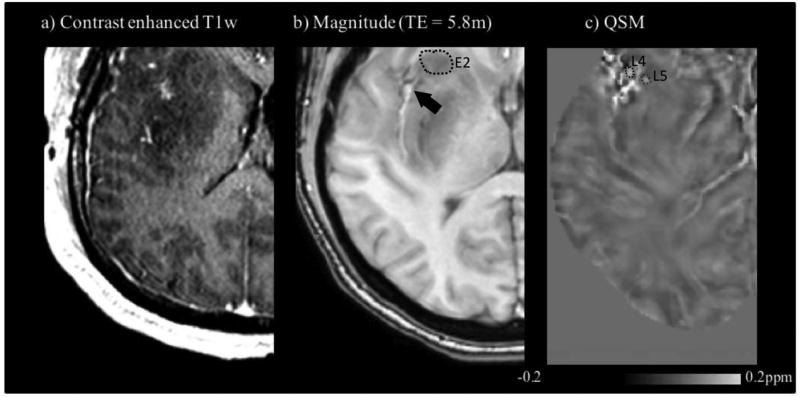
Figure 3.
Contrast-enhanced T1w (a), GRE magnitude (b) and QSM (inhalation of medical air) (c) images of the anaplastic astrocytoma patient 3. The ROI in (b) shows peripheral edema 2, E2. The upper left of the image in (c) indicates two ROIs: lesion 4, L4; lesion 5, L5. Lesion 4 corresponds to the area approximately pointed at by the arrow in (b).
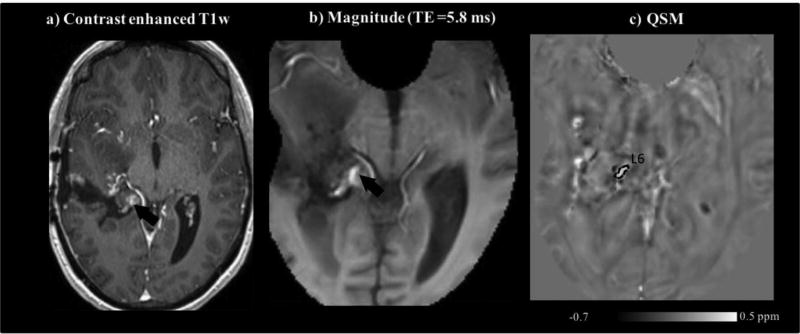
Figure 4.
Contrast-enhanced T1w (a), GRE magnitude (b), and QSM (inhalation of medical-air) (c) images of patient 4 with anaplastic astrocytoma. The contrast-enhancing lesion 6, L6 denoted by the arrows in (a–b) was assessed via the ROI shown in (c).
Footnotes
Publisher's Disclaimer: This is a PDF file of an unedited manuscript that has been accepted for publication. As a service to our customers we are providing this early version of the manuscript. The manuscript will undergo copyediting, typesetting, and review of the resulting proof before it is published in its final citable form. Please note that during the production process errors may be discovered which could affect the content, and all legal disclaimers that apply to the journal pertain.
References
- 1.Alifieris C, Trafalis DT. Glioblastoma multiforme: Pathogenesis and treatment. Pharmacol Ther. 2015;152:63–82. doi: 10.1016/j.pharmthera.2015.05.005. [DOI] [PubMed] [Google Scholar]
- 2.Wilson WR, Hay MP. Targeting hypoxia in cancer therapy. Nat Rev Cancer. 2011;11(6):393–410. doi: 10.1038/nrc3064. [DOI] [PubMed] [Google Scholar]
- 3.Kayama T, Yoshimoto T, Fujimoto S, Sakurai Y. Intratumoral oxygen pressure in malignant brain tumor. Journal of neurosurgery. 1991;74(1):55–59. doi: 10.3171/jns.1991.74.1.0055. [DOI] [PubMed] [Google Scholar]
- 4.Gray LH, Conger AD, Ebert M, Hornsey S, Scott OC. The concentration of oxygen dissolved in tissues at the time of irradiation as a factor in radiotherapy. The British journal of radiology. 1953;26(312):638–648. doi: 10.1259/0007-1285-26-312-638. [DOI] [PubMed] [Google Scholar]
- 5.Kohshi K, et al. Effects of radiotherapy after hyperbaric oxygenation on malignant gliomas. British journal of cancer. 1999;80(1–2):236–241. doi: 10.1038/sj.bjc.6690345. [DOI] [PMC free article] [PubMed] [Google Scholar]
- 6.Chen JR, Xu HZ, Ding JB, Qin ZY. Radiotherapy after hyperbaric oxygenation in malignant gliomas. Current medical research and opinion. 2015;31(11):1977–1984. doi: 10.1185/03007995.2015.1082988. [DOI] [PubMed] [Google Scholar]
- 7.Noman MZ, et al. Hypoxia: a key player in antitumor immune response. A Review in the Theme: Cellular Responses to Hypoxia. Am J Physiol Cell Physiol. 2015;309(9):C569–579. doi: 10.1152/ajpcell.00207.2015. [DOI] [PMC free article] [PubMed] [Google Scholar]
- 8.Horsman MR, Mortensen LS, Petersen JB, Busk M, Overgaard J. Imaging hypoxia to improve radiotherapy outcome. Nat Rev Clin Oncol. 2012;9(12):674–687. doi: 10.1038/nrclinonc.2012.171. [DOI] [PubMed] [Google Scholar]
- 9.Blockley NP, Griffeth VE, Simon AB, Buxton RB. A review of calibrated blood oxygenation level-dependent (BOLD) methods for the measurement of task-induced changes in brain oxygen metabolism. NMR Biomed. 2013;26(8):987–1003. doi: 10.1002/nbm.2847. [DOI] [PMC free article] [PubMed] [Google Scholar]
- 10.Sedlacik J, Kutschbach C, Rauscher A, Deistung A, Reichenbach JR. Investigation of the influence of carbon dioxide concentrations on cerebral physiology by susceptibility-weighted magnetic resonance imaging (SWI) Neuroimage. 2008;43(1):36–43. doi: 10.1016/j.neuroimage.2008.07.008. [DOI] [PubMed] [Google Scholar]
- 11.Rauscher A, et al. High resolution susceptibility weighted MR-imaging of brain tumors during the application of a gaseous agent. Rofo. 2005;177(8):1065–1069. doi: 10.1055/s-2005-858428. [DOI] [PubMed] [Google Scholar]
- 12.Muller A, et al. Analysing the response in R2* relaxation rate of intracranial tumours to hyperoxic and hypercapnic respiratory challenges: initial results. Eur Radiol. 2011;21(4):786–798. doi: 10.1007/s00330-010-1948-7. [DOI] [PubMed] [Google Scholar]
- 13.Safronova MM, et al. Mapping of global R1 and R2* values versus lipids R1 values as potential markers of hypoxia in human glial tumors: A feasibility study. Magn Reson Imaging. 2016;34(2):105–113. doi: 10.1016/j.mri.2015.10.021. [DOI] [PubMed] [Google Scholar]
- 14.Remmele S, et al. Dynamic and simultaneous MR measurement of R1 and R2* changes during respiratory challenges for the assessment of blood and tissue oxygenation. Magn Reson Med. 2013;70(1):136–146. doi: 10.1002/mrm.24458. [DOI] [PubMed] [Google Scholar]
- 15.Deistung A, et al. Quantitative susceptibility mapping differentiates between blood depositions and calcifications in patients with glioblastoma. PLoS One. 2013;8(3):e57924. doi: 10.1371/journal.pone.0057924. [DOI] [PMC free article] [PubMed] [Google Scholar]
- 16.Ozbay PS, et al. Effect of respiratory hyperoxic challenge on magnetic susceptibility in human brain assessed by quantitative susceptibility mapping (QSM) NMR Biomed. 2015;28(12):1688–1696. doi: 10.1002/nbm.3433. [DOI] [PubMed] [Google Scholar]
- 17.Schweser F, Deistung A, Sommer K, Reichenbach JR. Toward online reconstruction of quantitative susceptibility maps: superfast dipole inversion. Magn Reson Med. 2013;69(6):1582–1594. doi: 10.1002/mrm.24405. [DOI] [PubMed] [Google Scholar]
- 18.Li W, Wu B, Liu C. Quantitative susceptibility mapping of human brain reflects spatial variation in tissue composition. Neuroimage. 2011;55(4):1645–1656. doi: 10.1016/j.neuroimage.2010.11.088. [DOI] [PMC free article] [PubMed] [Google Scholar]
- 19.Anonymous. SPM analysis toolbox; London, UK: [Google Scholar]
- 20.https://www.ma.utexas.edu/users/davis/375/popecol/tables/f005.html
- 21.Schwarzbauer C, Deichmann R. Vascular component analysis of hyperoxic and hypercapnic BOLD contrast. Neuroimage. 2012;59(3):2401–2412. doi: 10.1016/j.neuroimage.2011.08.110. [DOI] [PubMed] [Google Scholar]
- 22.Berman AJ, Ma Y, Hoge RD, Pike GB. The effect of dissolved oxygen on the susceptibility of blood. Magn Reson Med. 2016;75(1):363–371. doi: 10.1002/mrm.25571. [DOI] [PubMed] [Google Scholar]
- 23.Deh K, et al. Reproducibility of quantitative susceptibility mapping in the brain at two field strengths from two vendors. J Magn Reson Imaging. 2015;42(6):1592–1600. doi: 10.1002/jmri.24943. [DOI] [PMC free article] [PubMed] [Google Scholar]
- 24.Baudelet C, Cron GO, Gallez B. Determination of the maturity and functionality of tumor vasculature by MRI: correlation between BOLD-MRI and DCE-MRI using P792 in experimental fibrosarcoma tumors. Magn Reson Med. 2006;56(5):1041–1049. doi: 10.1002/mrm.21047. [DOI] [PubMed] [Google Scholar]
- 25.Robinson SP, et al. Tumor vascular architecture and function evaluated by non-invasive susceptibility MRI methods and immunohistochemistry. J Magn Reson Imaging. 2003;17(4):445–454. doi: 10.1002/jmri.10274. [DOI] [PubMed] [Google Scholar]


