

Abstract
OBJECTIVE
To determine the effects of escalating doses of AAV2(Y444,500,703F)-P1ND4v2 in patients with LHON caused by the G11778A mutation in mitochondrial DNA.
DESIGN
Prospective open-label, unilateral single-dose, intravitreal injection of AAV2(Y444,500,703F)-P1ND4v2 per subject in a phase I clinical trial study initiated in 2014.
PARTICIPANTS
Fourteen patients with visual loss and mutated G11778A mitochondrial DNA.
INTERVENTION
Intravitreal injection with the gene therapy vector AAV2(Y444,500,703F)-P1ND4v2 into one eye. Six participants with chronic bilateral visual loss greater than 12 months (Group I), 6 participants with bilateral visual loss less than 12 months (Group II) and 2 participants with unilateral visual loss (Group III) were treated. Nine patients had at least 12 months of follow-up. Clinical testing included ETDRS visual acuity, visual fields, OCT, PERG and neuro-ophthalmic examinations. GEE methods were used for longitudinal analyses.
PRIMARY OUTCOME MEASURE
Loss of visual acuity.
RESULTS
For Groups I and II, month 12 average acuity improvements with treatment relative to baseline were 0.24 logMAR. Fellow eyes had a 0.09 logMAR improvement. A post-hoc comparison found that at month 12, the difference between study eye minus fellow eye improvement in Group II patients of 0.53 logMAR was greater than that observed in our prior acute natural history patients of 0.21 logMAR (p=0.053). At month 18, the difference between study eye minus fellow eye improvement in our acute Group II gene therapy patients of 0.96 was greater than that observed in our prior acute natural history patients (0.17 logMAR) p<0.001. Two patients developed asymptomatic uveitis that resolved without treatment. OCT of treated eyes had an average temporal RNFL thickness of 54 μm prior to injection and 55 μm at month 12. For fellow eyes prior to injection it was 56 μm dropping to 50 μm at month 12, p = 0.013. GEE suggested that PERG amplitudes worsened more in treated eyes than in fellow eyes by about 0.05 uV (p exchangeable = 0.009). No difference between eyes in outcomes of other visual function measures was evident.
CONCLUSIONS
Allotopic gene therapy for LHON at low and medium doses appears safe and does not damage the temporal RNFL opening the door for testing of the high dose next.
Introduction
Leber Hereditary Optic Neuropathy (LHON) was first associated with a G to A transition at nt-11778 in the ND4 subunit gene of complex I of mtDNA that changes an arginine to histidine at amino acid 340.1 Visual loss is usually severe and bilateral. Unilateral visual loss is typically followed by fellow eye involvement within months, but intervals greater than a year2 and even as long as 18 years3 have been described. A prospective study of the natural history of visual acuity found that spontaneous recovery of visual acuity of 3 lines or more occurs in ~18% of patients.4 Two other primary mutations G3460A and T14484C have also been identified in LHON patients’ mtDNA that are each associated with a higher rate of spontaneous recovery.5;6
Here, we recoded the ND4 subunit of complex I in the “universal” genetic code and imported into the mitochondrion from the cytoplasm by adding a targeting sequence derived from the P1 isoform of subunit c of ATP synthase (ATPc).7 We refer to the nuclear encoded ND4 with the appended ATPc targeting sequences as P1ND4v2. It was inserted into a self-complementary adenoassociated vector scAAV2(Y444,500,730F). We first determined its safety and tolerability in preclinical studies of rodents and nonhuman primates,8 before testing in our first 5 LHON patients.9 Here we describe our findings with longer-term follow-up of these patients in addition to 9 more patients enrolled since that publication for a total of 14 participants.
Participants and Methods
Study Entry and Dosing
The study is approved by the University of Miami Institutional Review Board, FDA, RAC of the NIH and monitored by a DSMC constituted by the NEI. .After obtaining informed consent, 14 LHON participants with the G11778A mutation were entered into the study (Table 1).Ten participants were men and four participants were women. All patients were Caucasian except for one who was of partial American Indian heritage. Each received a single intravitreal injection of scAAV2(Y444,500,730F)-P1ND4v2 in one eye. Six participants had chronic bilateral visual loss longer than 1 year (Group I). The first three received the low dose (5xe9 vg) and the next 3 received the medium dose (2.46xe10vg). Six additional participants had acute bilateral visual loss less than 1 year (Group II). The first three received the low dose study drug and the next 3 received the medium dose. Two participants with unilateral visual loss received the low dose into the eye with good vision before it lost central vision. As of November 2016, these participants have returned for 5 or more post injection visits (3 to 18 months) and nine patients had at least 12 months of follow-up. The short term visual results of the first 3 patients (participants 1–3) with chronic visual loss treated with the low dose, one (participant 4) with chronic visual loss treated with the medium dose and one patient with acute visual loss treated with the low dose (participant 7) were previously reported.10
Table 1.
Patient Characteristics
| Group | Dose | Injection Number | Gender | Age | Ethnicity | Months since | Study Eye | Fellow | Study Eye | Fellow Eye | Last Visit | ||
|---|---|---|---|---|---|---|---|---|---|---|---|---|---|
| initial acuity loss | Injected Eye | Injection Mo/Yr | BL2 ETDRS letters | EyeBL2 ETDRS letters | last visit ETDRS letters | Last visit ETDRS letters | |||||||
| I.Chronic | Low | 1 | M | 45 | W | 56 | OS | 09/2014 | HM | HM | CF | CF | Mo 24 |
| 2 | M | 56 | W | 251 | OD | 11/2014 | CF | CF | CF | CF | Mo 24 | ||
| 3 | M | 37 | W | 26 | OS | 01/2015 | 14 | 18 | 10 | 12 | Mo 18 | ||
| Medium | 4 | M | 33 | W | 16 | OD | 04/2015 | HM | HM | 1 | 4 | Mo 18 | |
| 6 | M | 29 | W | 138 | OD | 06/2015 | 11 | 11 | 13 | 13 | Mo 18 | ||
| 8 | M | 24 | W | 13 | OD | 07/2015 | CF | CF | CF | CF | Mo 12 | ||
| II. Acute | Low | 5 | F | 49 | W | 9 | OD | 04/2015 | 15 | 20 | 53 | 39 | Mo 18 |
| 7 | M | 22 | W | 5 | OS | 06/2015 | LP | CF | 17 | HM | Mo 18 | ||
| 9 | M | 23 | W | 6 | OD | 09/2015 | 4 | 6 | 17 | 9 | Mo 12 | ||
| Medium | 10 | F | 26 | Am Ind | 8 | OS | 12/2015 | CF | CF | 1 | 1 | Mo 06 | |
| 11 | F | 27 | W | 7 | OS | 02/2016 | 2 | 5 | 6 | 6 | Mo 06 | ||
| 13 | F | 31 | W | 2 | OS | 04/2016 | 13 | 15 | 7 | 13 | Mo 03 | ||
| III. Unilateral | Low | 12 | M | 19 | W | 5 | OS | 03/2016 | 90 | 4 | 5 | 5 | Mo 06 |
| 14 | M | 52 | W | 8 | OS | 06/2016 | 77 | 4 | 74 | 63 | Mo 06 | ||
W = white race; Am Ind = American Indian; BL2 = Measurement made at second baseline visit; Mo = Follow up month
Group I
The bilateral chronic group includes participants with ≥12 months since onset of visual loss in one eye and at least 6 months onset in the more recently affected eye. For inclusion in the study, both eyes must have acuity reduced to ≤ 35 letters (Snellen = 20/200). If both eyes have ≥12 months since onset, the eye with worse visual acuity is injected. If both eyes have the same acuity, the eye with longest duration of vision loss is injected. If one eye has <12 months and >6 months since onset and the difference in acuity between the eyes is ≤10 letters, the eye with ≥12 months is injected. If eyes have an acuity difference >10 letters, the eye with worse acuity is injected.
Group II
The acute group includes those with bilateral loss of visual acuity to ≤ 35 ETDRS letters in both eyes for less than 12 months. The worse eye is injected.
Group III
The acute unilateral group includes those with loss of acuity to ≤ 35 ETDRS letters in one eye, with mildly impaired but good acuity ≥ 70 letters (Snellen = 20/40) in the contralateral eye. The better eye is injected.
The primary outcome measure is a loss of visual acuity to no light perception for Groups I and II but for Group III a 3 line drop in acuity of the injected eye relative to the fellow eye vision recorded at baseline. Entry into the Study included two baseline visits, followed by the injection, clinic visits on post injection day 1, 7, 30, 60, 90, 180, 270, 365 and then visits every 180 days for up to 3 years. Serial testing included best-corrected visual acuity using the Early Treatment Diabetic Retinopathy Study (ETDRS) chart performed by a certified ophthalmic technologist masked to the identity of the treated eye. Qualifying visual acuity was assessed at a baseline 1 visit, while change in acuity during follow-up was determined from a pre-injection baseline 2 measurement to guard against regression to the mean. Humphrey 30-2 white-on-white standard visual field, pattern electroretinogram (PERG) and spectral-domain optical coherence tomography (SD-OCT) were also performed. Fixation during the visual field is monitored by the study technician. (For the OCT and fundus photos the photographer insures that images are taken of the optic nerve head. For the PERG, the operator controls from the side that the subject orients gaze towards the stimulus display. As the PERG response is dominated by RGCs that have their highest density around the fovea, the large PERG stimulus (25 deg) covers central RGCs even with moderate eccentric fixation. Fixation eccentricities within 5 degrees do not significantly alter the PERG signal.) Neuro-ophthalmic examination included assessments of the pupils, anterior segment and ophthalmoscopy of the optic nerve head and retina.
Molecular Analysis
A PCR-based test using the amplification refractory mutation system (ARMS) was used to detect the presence or absence of 11778 G>A mutation as previously described.9
Optical Coherence Tomography
Peripapillary retinal nerve fiber layer (RNFL) thickness was measured as previously described.9 OCT scans were only collected at baseline, day 7, day 60, month 12, and annually thereafter.
Pattern Electroretinogram
The PERG was simultaneously recorded from both eyes according to a paradigm optimized for glaucoma detection (PERGLA).11;12
Study Drug and Dose Preparation
Study drug was manufactured by the University of Florida, Powell Gene Therapy Center in their vector core laboratory in January 2013 and stored in 200 μL aliquots in a −80 freezer until use. Stability of the study drug was assessed yearly from January 2014 to January 2016 and no changes were found since manufacture.
Intravitreal injection procedure
Participants were injected in an outpatient clinic room as previously described.9.
Neutralizing antibody assay
The neutralizing antibody (NAb) titer was reported as the highest serum or anterior chamber sample dilution that inhibited self-complementary AAV2(Y444,500,730F)- smCBA-mCherry transduction by ≥50% compared with no serum control.9
Quantitative SYBR-Green qPCR
Quantitative SYBR-Green PCR was performed using the bGH poly A primers (bovine growth hormone polyadenylation signal): F1-5′- AGCCTCGACTGTGCCTTCTAGTT-3′ and R1-5′-GGGTTCCTGCTATTGTCTTCCCAA with SsoAdvanced™ universal SYBR® Green Supermix (Cat. 172-5271) according to a standard protocol as previously described.9
Statistical Analysis
For each visual function parameter, logMAR acuity, HVF MD, RNFL thickness, and PERG amplitudes, improvement from baseline in injected eyes was compared to untreated fellow eyes with the paired t-test. The first baseline measurement of acuity was used to establish patient eligibility and the second baseline was used to calculate improvement to guard against regression to the mean. Longitudinal analysis of changes was performed with GEE. We used both exchangeable and 1st order autoregressive correlation structures and these gave similar results.
This phase I study was not randomized and did not include an uninjected control group. Therefore, we compared changes from baseline to those observed in our previously published natural history cohort4. For these analyses we restricted inclusion to those natural history patients who would have been eligible for this gene therapy trial at baseline. We assigned the worse eye of natural history patients as the study eye to act as a surrogate for the treated eye in the current study and the better eye as the fellow eye. When both eyes of eligible natural history patients had identical baseline acuities, we randomly selected the study eye. Of note, visits of our natural history patients occurred every six months, limiting the follow-up times that could be directly compared to the gene therapy patients. Changes from baseline in the study eyes versus the fellow eyes were compared between the two patient cohorts stratifying by onset group with two-factor analysis of variance.
Results
VISUAL ACUITY
Groups I-II
We plotted the change in Logarithm of the Minimum Angle of Resolution (logMAR) visual acuity of injected and fellow eyes by patient visit for Group I (Fig. 1) and Group II (Fig. 2). A difference of 0.1 logMAR is equivalent to a change of 1 line or 5 letters on the ETDRS chart. Table 2 show the logMAR values of Groups I and II. In Group I one patient started to improve 7–30 days post injection and maintained improvements out to month 18. As no treated eye of Group I lost acuity we treated the next cohort, those with acute bilateral visual loss. Four patients in Group II improved within a month of treatment and continued to improve or maintain improvements with longer follow-up.
Figure 1.
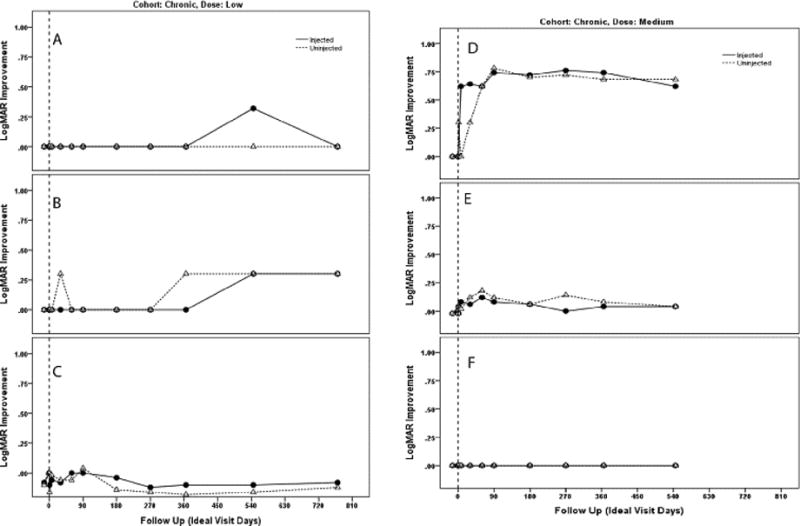
Plot of changes in visual acuity (logMAR) of injected and uninjected fellow eyes by visit of participant 1 (A), participant 2 (B), participant 3 (C), participant 4 (D) participant 5 (E) and participant 6 (F). Participants 1,2 and 3 were treated with low-dose study drug and participants 4, 5 and 6 were treated with the medium dose, all had chronic visual loss for more than one year.
Figure 2.
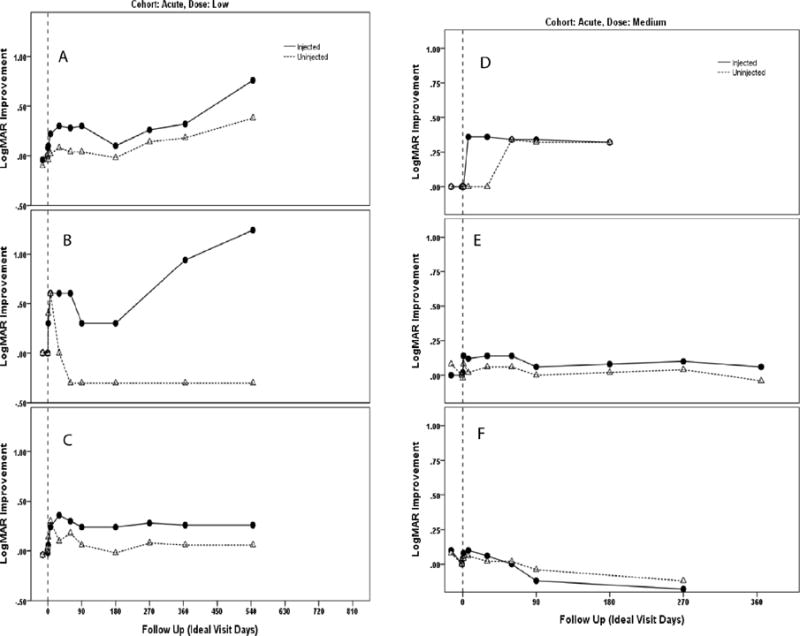
Plot of changes in visual acuity (logMAR) of injected and uninjected fellow eyes by visit of participant 7 (A), participant 8 (B), participant 9 (C), participant 10 (D), participant 11 (E) and participant 12 (F). Participants 7, 8 and 9 were treated with low-dose study drug and participants 10, 11 and 12 were treated with the medium dose, all had acute visual loss for less than one year.
Table 2.
Summary of logMAR acuity for groups I and II
| Mean (SD) Log MAR Acuity† | |||||
|---|---|---|---|---|---|
|
| |||||
| Visit | N NC, NA |
Injected Eye | Fellow Eye | Difference | |
|
| |||||
| Pre-injection | BL2 | 12 | 1.85 (0.41) | 1.78 (0.37) | 0.08 (0.17) |
| 6, 6 | p*=0.14 | ||||
|
| |||||
| Post-injection follow up | Day 1 | 12 | 1.80 (0.39) | 1.71 (0.33) | 0.09 (0.21) |
| 6, 6 | p=0.16 | ||||
|
| |||||
| Day 7 | 12 | 1.66 (0.34) | 1.69 (0.40) | −0.03 (0.29) | |
| 6, 6 | p=0.72 | ||||
|
| |||||
| Day 30 | 12 | 1.65 (0.36) | 1.70 (0.32) | −0.05 (0.19) | |
| 6, 6 | p=0.37 | ||||
|
| |||||
| Day 60 | 12 | 1.65 (0.35) | 1.69 (0.38) | −0.03 (0.10) | |
| 6, 6 | p=0.27 | ||||
|
| |||||
| Day 90 | 12 | 1.69 (0.38) | 1.69 (0.37) | 0.00 (0.08) | |
| 6, 6 | p=1.00 | ||||
|
| |||||
| Mo 6 | 11 | 1.73 (0.36) | 1.75 (0.34) | −0.03 (0.07) | |
| 6, 5 | p=0.22 | ||||
|
| |||||
| Mo 9 | 8 | 1.67 (0.39) | 1.67 (0.39) | 0.00 (0.08) | |
| 6, 2†† | p=0.87 | ||||
|
| |||||
| Mo 12 | 9 | 1.66 (0.38) | 1.72 (0.38) | −0.06 (0.25) | |
| 6, 3 | p=0.48 | ||||
|
| |||||
| Mo 18 | 7 | 1.47 (0.42) | 1.68 (0.46) | −0.21 (0.25) | |
| 5, 2 | p=0.17 | ||||
|
| |||||
| Mo 24 | 2 | 2.00 (0.00) | 2.00 (0.00) | 0.00 (0.00) | |
| 2, 0 | p=1.00 | ||||
NC = Number of chronic (group I patients), low and medium doses; NA = Number of Acute (group II) patients, low and medium doses; BL2 = baseline 2; Mo = Month
Equivalent low vision logMAR acuities: CF = −2.0, HM = −2.3, LP = −2.6
2-tailed paired t-test p values assess significance of average difference between injected and fellow eye
2-1-08 missed their 9 month study visit but returned for their 12 month visit
Comparison of injected to fellow eyes of gene therapy patients
We attempted to ascertain the significance of changes in acuity of treated eyes, first by analysis relative to fellow eyes that received no treatment as the controls. Comparisons of logMAR acuity of the injected eye minus the fellow eye changes of Groups I and II (low and medium doses combined) revealed that after the day of injection (D01) injected eye acuities were never worse than fellow eye acuities, Table 3. We also compared acuity changes in treated and untreated eyes, each relative to pretreatment at the baseline 2 visit. For treated eyes this ranged from 0.19 logMAR to 0.45 logMAR from post injection day 07 to month 18. For untreated eyes differences between baseline 2 and follow-up examinations were much smaller than seen with treatment ranging from 0.08 logMAR at day 7 to 0.13 logMAR at month 18. Differences in treated eyes relative to the baseline 2 visit (Table 3) reached statistical significance at days 07, 30, 60, 90 and at months 6 and 18. When improvement of all injected eyes of Groups I and II was compared to the fellow eyes using all measurements from day one post injection (D01) through month 24 (M24), the injected eye improvement was significantly greater than the fellow eye improvement (p=0.051, GEE exchangeable correlation structure; p=0.087, GEE 1st order autoregressive correlation structure). However, in combining the acute and chronic cohorts the size of the difference in injected eye improvements was 4 letters.
Table 3.
Summary of logMAR acuity improvements from baseline 2 for groups I and II
| Mean (SD) Log MAR Acuity Improvement† | ||||
|---|---|---|---|---|
|
| ||||
| Visit | N NC, NA |
Injected | Fellow | Difference |
|
| ||||
| Day 1 | 12 | 0.05 (0.1) | 0.07 (0.15) | −0.02 (0.11) |
| 6, 6 | p*=0.10 | p=0.16 | p=0.65 | |
|
| ||||
| Day 7 | 12 | 0.19 (0.23) | 0.08 (0.18) | 0.11 (0.20) |
| 6, 6 | p=0.015 | p=0.15 | p=0.091 | |
|
| ||||
| Day 30 | 12 | 0.20 (0.24) | 0.08 (0.12) | 0.13 (0.24) |
| 6, 6 | p=0.015 | p=0.043 | p=0.095 | |
|
| ||||
| Day 60 | 12 | 0.20 (0.23) | 0.09 (0.23) | 0.11 (0.26) |
| 6, 6 | p=0.012 | p=0.20 | p=0.17 | |
|
| ||||
| Day 90 | 12 | 0.16 (0.24) | 0.09 (0.26) | 0.08 (0.19) |
| 6, 4 | p=0.037 | p=0.28 | p=0.19 | |
|
| ||||
| Mo 6 | 11 | 0.16 (0.22) | 0.06 (0.27) | 0.11 (0.18) |
| 6, 5 | p=0.038 | p=0.49 | p=0.085 | |
|
| ||||
| Mo 9 | 8 | 0.15 (0.28) | 0.12 (0.26) | 0.03 (0.10) |
| 6, 2†† | p=0.19 | p=0.26 | p= 0.39 | |
|
| ||||
| Mo 12 | 9 | 0.24 (0.37) | 0.09 (0.28) | 0.15 (0.43) |
| 6, 3 | p=0.081 | p=0.36 | p=0.32 | |
|
| ||||
| Mo 18 | 7 | 0.45 (0.46) | 0.13 (0.34) | 0.32 (0.57) |
| 5, 2 | p=0.039 | p=0.34 | p= 0.18 | |
|
| ||||
| Mo 24 | 2 | 0.15 (0.21) | 0.15 (0.21) | 0 (0) |
| 2,0 | p=0.50 | p=0.50 | p=1.00 | |
NC = Number of chronic (group I patients), low and medium doses; NA = Number of Acute (group II) patients, low and medium doses; Mo = Month
Equivalent low vision logMAR acuities: CF = −2.0, HM = −2.3, LP = −2.6
2-tailed paired t-test p values assess significance of average difference between follow up and baseline 2 measurement
SAA missed the 9 month visit, but returned for their 12 month visit
Comparison of injected eyes in this gene therapy study to untreated patients prospectively entered into a natural history study - Next, we used a control group of untreated patients followed in a prior natural history study4 that we had designed to determine in prospective fashion the course of visual function in untreated G11778A LHON, including only those patients who would have been eligible for the current study at their baseline visits (n=24 chronic and n=9 acute), stratifying by chronic versus acute onset. For the natural history study patients, we used the worse eye at baseline as a surrogate for injected eyes. A post-hoc comparison found that the difference between study eye minus fellow eye improvement in our acute onset bilateral visual loss gene therapy trial patients of 0.53 logMAR was greater than that observed in our prior acute onset natural history patients (0.21 logMAR units), (p=0.053) at month 12. At month 18 the difference between study eye minus fellow eye improvement in our acute onset bilateral visual loss gene therapy trial patients of 0.96 logMAR was greater than that observed in our prior acute onset natural history patients (0.17 logMAR units), (p<0.001). In that natural history study, among acute eyes worse at baseline, we found that at 12 months follow-up 44% of eyes had spontaneous improvement of visual acuity of 3 lines or more. In this gene therapy study 66% of treated eyes improved by 3 lines or more. In the natural history study, 22% of the acute onset eyes worse at baseline lost 3 lines of acuity, while in this gene therapy study, no injected eyes (Groups I and II) lost 3 lines of acuity.
Group III
As none of the treated eyes in Groups I and II showed worsening of acuity we next tested whether treatment in the good eye (70 letters (20/40) or better) of those with unilateral visual loss of would prevent the deterioration characteristic of LHON with profound visual loss in both eyes. One of the two patients in group III lost vision 3 months after injection from a baseline of 85 to 60 letters in the treated eye. At 6 months it dropped further to 5 letters (see Table 1). However, acuity of the fellow eye was equivalent with 5 letters at baseline and also at 6 months post injection. The second patient maintains good vision with 74 letters at 6 months relative to 77 letters at baseline.
VISUAL FIELDS
For Group II at 12 months follow-up (n=3) treated eyes slightly improved from − 26.9 dB to −21.6 dB while fellow eyes worsened from −21.7 dB to −23.4 dB. Overall, for Groups I and II, we did not find any noteworthy changes with treatment relative to the baseline 2 visit or any differences between treated eye and fellow eye changes at any time point except at 90 days post injection (p = 0.047) (Table 4). GEE did not find anything significant (p exchangeable = 0.143, p autoregressive = 0.145). At 12 months follow-up there was little difference in the chronic cohort between our gene therapy patients (average treated eye minus fellow eye improvement = −0.64) and our prior natural history group (average treated eye minus fellow eye improvement = 2.15). However, in the acute bilaterally affected cohort there was a large difference between gene therapy patients (average treated eye minus fellow eye improvement = 7.01 dB) and the natural history group (average treated eye minus fellow eye improvement = −3.95 dB). Much of this difference was due to worsening of the fellow eyes of gene therapy patients rather than improvement of the treated eyes. This might be interpreted as a treatment induced stabilization of the ongoing visual field degeneration.
Table 4.
Summary of HVF Mean Deviation for groups I and II
| Mean (SD) HVF MD | |||||
|---|---|---|---|---|---|
|
| |||||
| Visit | N NC, NA | Injected | Fellow | Difference | |
|
| |||||
| Pre-injection | BL2 | 12 | −26.6 (7.7) | −23 (10.7) | −3.7 (6.6) |
| 6, 6 | p=.078 | ||||
|
| |||||
| Post-injection follow up | Day 1 | 12 | −24.0 (9.6) | −24.1 (7.6) | 0.0 (5.0) |
| 6, 6 | p=.982 | ||||
|
| |||||
| Day 7 | 12 | −26.2 (7.6) | −22.9 (8.8) | −3.4 (3.8) | |
| 6, 6 | p=.010 | ||||
|
| |||||
| Day 30 | 12 | −26.5 (9.0) | −25.0 (8.2) | −1.5 (1.9) | |
| 6, 6 | p=.019 | ||||
|
| |||||
| Day 60 | 12 | −27.2 (8.0) | −26.7 (8.3) | −0.5 (1.4) | |
| 6, 6 | p=.214 | ||||
|
| |||||
| Day 90 | 12 | −25.1 (7.6) | −25.6 (6.7) | 0.5 (2.3) | |
| 6, 6 | p=.486 | ||||
|
| |||||
| Mo 6 | 11 | −25.1 (8.4) | −24.8 (8.7) | −0.3 (3.3) | |
| 6, 5 | p=.737 | ||||
|
| |||||
| Mo 9 | 8 | −24.5 (12.0) | −24.2 (9.8) | −0.3 (4.9) | |
| 6 2†† | p=.859 | ||||
|
| |||||
| Mo 12 | 9 | −24.6 (11.8) | −24.4 (10.6) | −0.2 (3.1) | |
| 6, 3 | p=.820 | ||||
|
| |||||
| Mo 18 | 7 | −22.7 (12.4) | −22.0 (11.0) | −0.7 (5.7) | |
| 5, 2 | p=0.77 | ||||
|
| |||||
| Mo 24 | 2 | −28.1 (6.5) | −25.0 (10.6) | −3.1 (4.1) | |
| 2, 0 | p=0.48 | ||||
NC = Number of chronic (group I patients), low and medium doses; NA = Number of Acute (group II) patients, low and medium doses; BL2 = baseline 2; Mo = Month
2-tailed paired t-test p values assess significance of average difference between injected and fellow eye
2-1-08 missed their 9 month study visit but returned for their 12 month visit
SPECTRAL DOMAIN OPTICAL COHERENCE TOMOGRAPHY (SD-OCT)
Average retinal nerve fiber layer (RNFL)
Serial measurements of the overall average retinal nerve fiber layer (RNFL) are tabulated in Table 5. As an intravitreal injection of AAV2 is expressed mainly in the macula of nonhuman primates we looked at the temporal quadrant of the optic nerve head that subserves macular fibers. Average temporal RNFL of Groups I and II (n=9) combined was thicker in treated than in fellow eyes at month 12, p = 0.013. In eyes selected for treatment average temporal RNFL thickness at the baseline 2 visit was 54 μm and at month 12 it was 55.0 μm. In fellow eyes on the day prior to injection (BL2), average temporal RNFL measurements were 56 μm and dropped to 50 μm at month 12. This suggests, treatment preserved the temporal RNFL subserving macular fibers targeted by an intravitreal AAV2 injection.
Table 5.
RNFL - Measurements of Participants with 1 year of follow-up sorted by order of injected eye logMAR improvement from baseline 2 to month 12
| Injected Eye | Fellow Eye | |||||||||
|---|---|---|---|---|---|---|---|---|---|---|
| logMAR Improvement | RNFL thickness (μm) | logMAR Improvement | RNFL thickness (μm) | |||||||
| Injection Number | Temporal | Average | Temporal | Average | ||||||
| BL2 | M12 | BL2 | M12 | BL2 | M12 | BL2 | M12 | |||
| 3 | −0.10 | 58 | 55 | 61 | 62 | −0.18 | 54 | 54 | 65 | 59 |
| 2 | 0.00 | 50 | 55 | 51 | 53 | 0.00 | 46 | 49 | 50 | 53 |
| 1 | 0.00 | 53 | 54 | 54 | 55 | 0.30 | 56 | 57 | 58 | 59 |
| 8 | 0.00 | 53 | 56 | 57 | 52 | 0.00 | 59 | 54 | 61 | 53 |
| 6 | 0.04 | 51 | 51 | 54 | 57 | 0.08 | 47 | 45 | 62 | 57 |
| 9 | 0.26 | 50 | 57 | 100 | 61 | 0.06 | 60 | 44 | 117 | 56 |
| 5 | 0.32 | 65 | 55 | 103 | 75 | 0.18 | 48 | 49 | 104 | 82 |
| 4 | 0.74 | 56 | 61 | 62 | 56 | 0.68 | 70 | 52 | 80 | 57 |
| 7 | 0.94 | 50 | 51 | 101 | 58 | −0.30 | 62 | 47 | 143 | 60 |
| Mean (SD) |
0.24 (0.37) |
54.0 (5.0) |
55.0 (3.0) |
71.4 (22.7) |
58.8 (6.9) |
0.09 (0.28) |
55.8 (7.9) |
50.1 (4.4) |
82.2 (31.9) |
59.6 (8.8) |
BL2 = baseline 2; M12 = month 12
PATTERN ELECTRORETINOGRAM (PERG)
Pattern electroretinogram amplitudes at baseline were extremely low in Group I, Group and even in Group III eyes with good vision (Table 6). Normal amplitude is approximately 1.0 μV. Amplitudes remained low at the post treatment follow-up examinations. GEE suggested that PERG amplitudes worsened more in the treated eyes than the fellow eyes (p exchangeable = 0.009, p autoregressive = 0.011) by about .05 uV. With comparison to the PERGs obtained in our natural history study there were no significant main effects or interactions (all p>0.56). We wondered whether the injection procedure had an adverse effect on the PERG. Comparisons of the PERG on day 1 post injection relative to baseline showed a mean drop of 0.08 μV in treated eyes, p=0.035. In fellow eyes average day 1 post injection PERG was unchanged from baseline (p = 0.97). Thus, the drop in PERG amplitude appears to be related to the injection since expression from the vector would not have initiated this quickly.
Table 6.
PERG Amplitude (uV), all groups
| Injection Number | Eye | Baseline | Post injection follow up | ||||||||||
|---|---|---|---|---|---|---|---|---|---|---|---|---|---|
| Day | Month | ||||||||||||
| 1 | 2 | 1 | 7 | 30 | 60 | 90 | 6 | 9 | 12 | 18 | 24 | ||
| 1 | Inj | 0.17 | .18 | .27 | .05 | .27 | .26 | N/A | .24 | .19 | .22 | .18 | N/A |
| FE | 0.30 | .24 | .25 | .11 | .37 | .31 | N/A | .20 | .16 | .30 | .20 | N/A | |
| 2 | Inj | 0.45 | .48 | .40 | .57 | .46 | .30 | .30 | .33 | .44 | .33 | .16 | .36 |
| FE | 0.35 | .42 | .46 | .40 | .49 | .31 | .33 | .33 | .43 | .30 | .17 | .25 | |
| 3 | Inj | 0.16 | .45 | .25 | .24 | .33 | .23 | .35 | .32 | .55 | .35 | .16 | |
| FE | 0.38 | .32 | .44 | .27 | .42 | .34 | .33 | .32 | .38 | .44 | .19 | ||
| 4 | Inj | 0.25 | .10 | .08 | .13 | .09 | .27 | .28 | .10 | .14 | .25 | .11 | |
| FE | 0.13 | .16 | .08 | .14 | .14 | .19 | .24 | .08 | .34 | .13 | .39 | ||
| 6 | Inj | 0.32 | .34 | .29 | .46 | .37 | .32 | .41 | .17 | .23 | .24 | .32 | |
| FE | 0.48 | .21 | .40 | .44 | .42 | .33 | .32 | .23 | .20 | .25 | .48 | ||
| 8 | Inj | 0.27 | .38 | .36 | .33 | .47 | .46 | .39 | .33 | .27 | .30 | ||
| FE | 0.43 | .41 | .39 | .22 | .47 | .44 | .47 | .25 | .43 | .27 | |||
| 5 | Inj | 0.19 | .23 | .06 | .14 | .12 | .16 | .22 | .20 | .13 | .15 | .13 | |
| FE | 0.23 | .16 | .31 | .22 | .25 | .15 | .17 | .17 | .15 | .19 | .20 | ||
| 7 | Inj | 0.31 | .42 | .07 | .37 | .37 | .47 | .31 | .42 | N/A | .25 | .47 | |
| FE | 0.41 | .40 | .14 | .38 | .18 | .44 | .28 | .38 | N/A | .40 | .33 | ||
| 9 | Inj | 0.56 | .58 | .52 | .56 | .56 | .56 | .38 | .36 | .41 | .56 | ||
| FE | 0.54 | .56 | .37 | .54 | .54 | .52 | .69 | .55 | .29 | .54 | |||
| 10 | Inj | 0.25 | .23 | .28 | .30 | .27 | .33 | .15 | .34 | ||||
| FE | 0.32 | .29 | .32 | .36 | .29 | .23 | .37 | .31 | |||||
| 11 | Inj | 0.20 | .36 | .20 | .32 | .19 | .18 | .18 | .30 | ||||
| FE | 0.29 | .28 | .30 | .39 | .29 | .21 | .17 | .24 | |||||
| 13 | Inj | 0.69 | 1.04 | 1.01 | .58 | .69 | .79 | .67 | |||||
| FE | 0.67 | .98 | .99 | .81 | .72 | .97 | .67 | ||||||
| 12 | Inj | 0.41 | .39 | .30 | .28 | .24 | N/A | .27 | .34 | ||||
| FE | 0.32 | .27 | .17 | .36 | .22 | N/A | .30 | .22 | |||||
| 14 | Inj | 0.34 | .22 | N/A | .43 | .40 | .35 | .40 | |||||
| FE | 0.45 | .23 | N/A | .44 | .47 | .41 | .40 | ||||||
Inj = injected eye; FE = fellow eye; N/A = not available
ADVERSE EVENTS
All adverse events are listed in Table 7. Two of 14 patients (14%) experienced asymptomatic transient mild anterior uveitis (Fig. 3). In both cases uveitis was detected at the 2 month post injection visits. One patient was in Group I and treated with the medium dose, while the other patient was in Group II and treated with low-dose study vector. In both cases uveitis cleared spontaneously without treatment. One of 14 patients lost vision in the treated eye. This was detected at the 3 month post injection visit. This patient was in Group III and received treatment in an eye with 20/16 vision. At 6 months visual acuity of treated and untreated eyes was the same at 5 letters in each eye. Other adverse events included transient post injection spike of intraocular pressure, painful toxic/exposure keratitis, subconjunctival hemorrhage, sore throat and headaches.
Table 7.
Adverse Events
| Injection Number | Temporal relationship to injection | Description | Status |
|---|---|---|---|
| Ocular · Related to Injection/Investigational Product | |||
| 3 | 29 d | Small asymptomatic vitreous condensation | No treatment, Ongoing |
| 5 | Same day | Intraocular pressure >50mmHg, lightheadedness | Resolved same day |
| 5 | Same day | Corneal abrasion | Resolved next day |
| 6 | 2 m | Mild uveitis | No treatment, Resolved spontaneously |
| 9 | 2 m | Uveitis | No treatment, Resolved spontaneously |
| Reported by most patients | Same day | Burning sensation after anesthesia wore off | Resolved same or next day |
| 11 | 18 d | Occasional mild stinging, possibly related to injection | Resolved |
| 14 | 1 d | Decreased vision in injected eye of unilateral patient | Resolved spontaneously within 7 days with return to pre-injection acuity which is maintained through 6 month follow up |
| Systemic · Possibly related to Injection/Investigational Product | |||
| 4 | 2 d | Sore throat (possibly due to seasonal allergies) | Resolved by 14 days |
| 10 | 2 d | Cough and sore throat | Resolved within 10 days But recurred 3m later and are ongoing |
| 9 | 1.1 m | Elevated ALT | Resolved by month 2 |
| Ocular · Likely Unrelated to Injection/Investigational Product | |||
| 2 | 2.1 m | Small afferent pupillary defect | Resolved within 1 month |
| 7 | 2.7 m | Irritation | Resolved in 1 day |
| 6 | 1.6 m | Pain discomfort in both eyes | Resolved in one month |
| 6 | 2.2 m | Fellow eye red and twitching | Resolved spontaneously |
| 6 | 2.3 m | Complains of decreased acuity in both eyes. This decrease was not manifest upon study vision testing in which the patient read more letters than at either baseline 1 or baseline 2. Visual field tests | Ongoing |
| did not show worsening from baseline | |||
| 12 | 3.4 m | Decreased acuity in injected eye of unilateral patient attributed to natural course of LHON despite injection | Ongoing |
| Systemic · Likely unrelated to Injection/Investigational Product † | |||
| 6 | 3.8 m | Mucocele on MRI | Ongoing |
| 6 | 9.5 m | Tingling in legs | Ongoing |
| 7 | 1 d prior | Lightheaded during blood draw | Resolved by time of injection |
| 7 | 1.3 m | Headaches attributed to enlarged cisterna magna, unchanged from pre-injection MRI | Headaches stopped within 4 months |
| 2 | 5.2 m | Hospitalization to treat pre-existing parathyroid gland condition | Resolved post treatment |
| 4 | 17.1 m | Headaches, motion sickness | Ongoing |
| 12 | 5.2 m | Headaches | Resolved within 2 days |
| 12 | 3 d prior | Occasional bloody nose | Ongoing |
| 13 | 29 d | Exacerbation of numbness in feet | Ongoing |
| 5 | 8 m | Mild chest pain | Resolved within 5 weeks |
Other systemic unrelated adverse events [ref #] which resolved included: GI upset [8], sprained ankle [19], allergic reaction to energy drink [23], common cold [27], Flu symptoms [31], and rash on face [32]
Figure 3.
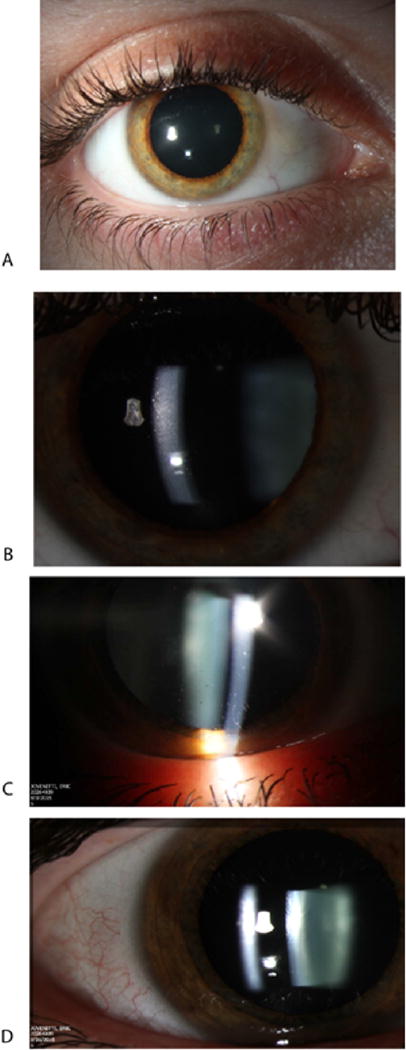
The eye of a patient treated with the low-dose (A) shows fine keratitic precipitates (B). A second patient treated with the medium dose shows keratitic precipitates (C) that resolved one month later (D).
NEUTRALIZING ANTIBODIES (NAbs) AND QPCR
Neutralizing antibodies to AAV2 were detected in all participants prior to injection (Table 8). Strong inhibition of the red fluorescence of mCherry in cultured cells indicating the presence of high levels of NAb against AAV2 (titer of 20,480) were found in serum samples of 4/14 (28.5%) LHON subjects at baseline, day 1, day 7, month 3, month 6 and month 12 post injection. Seven of fourteen patients showed low NAbs at baseline. Of the treated LHON patients who developed anterior uveitis, in one who received a medium dose the levels of serum neutralizing antibodies rose from a titer of 80 at baseline to a titer of 20,480 at day 7 and remained unchanged at 3 and 12 months post injection. In the other patient levels of neutralizing antibodies were extremely high at baseline (titer of 20,480) and remained at these levels. One other patient with an NAb titer of 5 (received medium dose vector) at baseline and post injection (day 1 and day 7) showed a transient rise of to a titer of 20 at 3 months post injection. Two other subjects had moderate NAb levels (titers of 5120 and 320) at baseline, day 1, day 7 and month 3. Nabs in the anterior chamber fluid of all participants were much lower than the serum levels. Blood samples were negative for vector DNA (Table 9) indicating no leakage of the injected rAAV into the systemic circulation.
Table 8.
Neutralizing Antibodies (NAb)
| Injection Number | Dose | Anterior chamber fluid (ACF) | Serum Sample | |||
|---|---|---|---|---|---|---|
| Injection Day | BSL | Day 7 | Day 90 | Year 1 | ||
| 1 | Low | 118 | 20,480 | 20,480 | 20,480 | 20,480 |
| 2 | Low | 10 | 20,480 | 20,480 | 20,480 | 20,480 |
| 3 | Low | 5 | 5 | 20 | 5 | 5 |
| 4 | Medium | 5 | 5,120 | 5,120 | 1,280 | 1,280 |
| 6 | Medium | 5 | 80 | 20,480 | 20,480 | 20,480 |
| 8 | Medium | 5 | 5 | 5 | 5 | 5 |
| 5 | Low | 5 | 20,480 | 20,480 | 20,480 | 20,480 |
| 7 | Low | 5 | 320 | 320 | 320 | 320 |
| 9 | Low | 20 | 20,480 | 20,480 | 20,480 | |
| 10 | Medium | 5 | 5 | 5 | 5 | |
| 11 | Medium | 5 | 5 | 5 | 20 | |
| 13 | Medium | 5 | 5 | 5 | 5 | |
| 13 | Low | 5 | 5 | 5 | 5 | |
| 14 | Low | 5 | 5 | 5 | ||
Table 9.
Blood qPCR Detection of Vector DNA
| Injection Number | Dose | Visit | qPCR Run | Spike – DNA | Copy number of scAAV2P1ND4 in 0.5 μg blood DNA | Score† | |||
|---|---|---|---|---|---|---|---|---|---|
| Rep 1 | Rep 2 | Rep 3 | Avg | ||||||
| 1 | Low | BL1 | 1 | 1.96E+06 | 0 | 0 | 0 | 0 | 0 |
| 2 | 4.98E+05 | 0 | 0 | 0 | 0 | 0 | |||
| D01 | 1 | 2.27E+05 | 0 | 0 | 0 | 0 | 0 | ||
| 2 | 4.85E+05 | 0 | 0 | 0 | 0 | 0 | |||
| D07 | 1 | 9.47E+05 | 0 | 0 | 0 | 0 | 0 | ||
| 2 | 3.28E+05 | 0 | 0 | 0 | 0 | 0 | |||
| 2 | Low | BL1 | 1 | 1.79E+06 | 44 | 78 | 0 | 41 | 0 |
| 2 | 3.42E+05 | 0 | 0 | 0 | 0 | 0 | |||
| D01 | 1 | 1.54E+05 | 20 | 14 | 0 | 12 | 0 | ||
| 2 | 6.72E+05 | 0 | 0 | 0 | 0 | 0 | |||
| D07 | 1 | 2.01E+05 | 0 | 0 | 0 | 0 | 0 | ||
| 2 | 5.94E+05 | 0 | 0 | 0 | 0 | 0 | |||
| 3 | Low | BL1 | 1 | 1.79E+06 | 32 | 28 | 0 | 20 | 0 |
| 2 | 3.42E+05 | 0 | 0 | 0 | 0 | 0 | |||
| D01 | 1 | 1.54E+05 | 50 | 33 | 0 | 28 | 0 | ||
| 2 | 6.72E+05 | 0 | 0 | 0 | 0 | 0 | |||
| D07 | 1 | 2.01E+05 | 161 | 351 | 0 | 171 | 1 | ||
| 2 | 5.94E+05 | 0 | 0 | 0 | 0 | 0 | |||
| 4 | Medium | BL1 | 1 | 2.33E+05 | 0 | 201 | 48 | 83 | 0 |
| 2 | 2.46E+05 | 15 | 0 | 0 | 5 | 0 | |||
| D01 | 1 | 4.86E+05 | 0 | 259 | 419 | 226 | 1 | ||
| 2 | 5.91E+05 | 8 | 0 | 0 | 3 | 0 | |||
| D07 | 1 | 3.68E+05 | 0 | 273 | 477 | 250 | 1 | ||
| 2 | 4.25E+05 | 10 | 9 | 0 | 7 | 0 | |||
| 6 | Medium | BL1 | 1 | 8.35E+05 | 0 | 0 | 0 | 0 | 0 |
| 2 | 6.32E+05 | 0 | 0 | 0 | 0 | 0 | |||
| D01 | 1 | 3.51E+05 | 0 | 0 | 0 | 0 | 0 | ||
| 2 | 5.03E+05 | 0 | 0 | 0 | 0 | 0 | |||
| D07 | 1 | 4.44E+05 | 0 | 0 | 0 | 0 | 0 | ||
| 2 | 8.29E+05 | 0 | 0 | 0 | 0 | 0 | |||
| 8 | Medium | BL1 | 1 | 4.28E+05 | 64 | 22 | 72 | 52 | 0 |
| 2 | 6.32E+05 | 0 | 0 | 0 | 0 | 0 | |||
| D01 | 1 | 3.51E+05 | 406 | 298 | 458 | 387 | 1 | ||
| 2 | 5.03E+05 | 0 | 90 | 0 | 30 | 0 | |||
| D07 | 1 | 4.44E+05 | 26 | 50 | 44 | 40 | 0 | ||
| 2 | 8.29E+05 | 60 | 0 | 0 | 20 | 0 | |||
| 5 | Low | BL1 | 1 | 2.33E+06 | 0 | 55 | 0 | 18 | 0 |
| 2 | 2.46E+05 | 92 | 63 | 55 | 70 | 0 | |||
| D01 | 1 | 4.86E+05 | 0 | 0 | 0 | 0 | 0 | ||
| 2 | 5.91E+05 | 8 | 0 | 170 | 59 | 0 | |||
| D07 | 1 | 3.68E+05 | 0 | 0 | 6 | 2 | 0 | ||
| 2 | 4.25E+05 | 12 | 9 | 0 | 7 | 0 | |||
| 7 | Low | BL1 | 1 | 3.09E+05 | 0 | 0 | 0 | 0 | 0 |
| 2 | 3.61E+05 | 0 | 0 | 0 | 0 | 0 | |||
| D01 | 1 | 6.97E+05 | 0 | 0 | 0 | 0 | 0 | ||
| 2 | 6.08E+05 | 0 | 0 | 0 | 0 | 0 | |||
| D07 | 1 | 4.75E+05 | 152 | 122 | 117 | 130 | 1 | ||
| 2 | 6.69E+05 | 0 | 0 | 0 | 0 | 0 | |||
| 9 | Low | BL1 | 1 | 1.18E+05 | 0 | 0 | 0 | 0 | 0 |
| 2 | 3.38E+05 | 0 | 0 | 0 | 0 | 0 | |||
| D01 | 1 | 1.86E+05 | 0 | 0 | 0 | 0 | 0 | ||
| 2 | 3.70E+05 | 0 | 0 | 0 | 0 | 0 | |||
| D07 | 1 | 1.25E+05 | 0 | 0 | 0 | 0 | 0 | ||
| 2 | 4.88E+05 | 0 | 0 | 0 | 0 | 0 | |||
| 10 | Medium | BL1 | 1 | 1.31E+05 | 0 | 0 | 0 | 0 | 0 |
| 2 | 6.35E+05 | 0 | 0 | 0 | 0 | 0 | |||
| D01 | 1 | 7.21E+05 | 0 | 0 | 0 | 0 | 0 | ||
| 2 | 5.82E+05 | 0 | 0 | 0 | 0 | 0 | |||
| D07 | 1 | 5.48E+05 | 0 | 18 | 52 | 23 | 0 | ||
| 2 | 1.06E+06 | 37 | 54 | 41 | 44 | 0 | |||
| 11 | Medium | BL1 | 1 | 2.10E+05 | 20 | 17 | 25 | 21 | 0 |
| 2 | 3.07E+05 | 0 | 0 | 0 | 0 | 0 | |||
| D01 | 1 | 5.38E+05 | 15 | 22 | 29 | 22 | 0 | ||
| 2 | 5.80E+05 | 0 | 0 | 0 | 0 | 0 | |||
| D07 | 1 | 8.57E+05 | 51 | 40 | 31 | 41 | 0 | ||
| 2 | 2.66E+05 | 0 | 0 | 0 | 0 | 0 | |||
| 13 | Medium | BL1 | 1 | 9.87E+005 | 11 | 26 | 0 | 13 | 0 |
| 2 | 9.09E+005 | 257 | 317 | 263 | 279 | 1 | |||
| D01 | 1 | 3.75E+005 | 0 | 0 | 0 | 0 | 0 | ||
| 2 | 4.91E+005 | 0 | 0 | 0 | 0 | 0 | |||
| D07 | 1 | 2.05E+005 | 22 | 10 | 0 | 11 | 0 | ||
| 2 | 4.04E+005 | 0 | 0 | 0 | 0 | 0 | |||
| 12 | Low | BL1 | 1 | 2.64E+05 | 1 | 1 | 1 | 1 | 0 |
| 2 | 3.07E+05 | 1 | 4 | 1 | 2 | 0 | |||
| D01 | 1 | 3.88E+05 | 2 | 3 | 3 | 3 | 0 | ||
| 2 | 3.78E+05 | 2 | 2 | 2 | 2 | 0 | |||
| D07 | 1 | 3.27E+05 | 0 | 1 | 1 | 1 | 0 | ||
| 2 | 2.55E+05 | 1 | 0 | 1 | 1 | 0 | |||
| 14 | Low | BL1 | 1 | 4.36E+005 | 212 | 219 | 244 | 225 | 1 |
| 2 | 7.67E+005 | 353 | 403 | 407 | 388 | 1 | |||
| D01 | 1 | 1.19E+005 | 22 | 18 | 270 | 103 | 1 | ||
| 2 | 4.17E+005 | 0 | 0 | 0 | 0 | 0 | |||
| D07 | 1 | 1.77E+005 | 207 | 0 | 103 | 103 | 1 | ||
| 2 | 9.59E+005 | 0 | 0 | 0 | 0 | 0 | |||
BL1 = baseline 1; D01 = point injection day 1; D07 = post injection day 7; Rep = replicate; Avg = average
Scoring 0=0–99, +1=100–500, +2=501–5,000, +3 = 5,001–50,000, +4 = >50,000 copies/0.5μg
Blood DNA were used for qPCR from two separately extraction.
NTC≤ 500, Copy number ≤ 500 as negative.
Discussion
While our phase I study was initially designed to evaluate safety rather than efficacy, when we compared treated eyes to fellow eyes of all patients in Groups I and II we did find a statistically significant effect of treatment on visual acuity improvement. The French Gensight study group in a press release (http://www.businesswire.com/news/home/20161219006275/en/GenSight-Biologics- Reports-Sustained-Visual-Acuity-Gain) also described a beneficial effect of allotopic ND4 gene therapy in their 14 patients of 0.61 logMAR with 18 months of follow-up. At baseline, their treated eyes were hand movements that they ascribed to a value of 2.79 logMAR. So in their low vision logMAR schema an improvement from HM to CF is 0.8 logMAR, whereas for our trial it is 0.3 logMAR. There are inconsistencies among gene therapy studies in the assignment of logMAR values to poor vision. The same investigative group assigned HM acuity as logMAR=2.0 in one publication13, but in another publication14 used logMAR=3.0 for HM. We followed Holladay’s15 convention of CF=2.0 logMAR, but felt that assigning Holladay’s logMAR score of 3.0 to HM (equivalent to a 10 lines worse than CF) would weight changes off the ETDRS chart too heavily, swamping loses and improvements of patients with acuities on the chart. We therefore assigned a conservative but meaningful difference of 0.3 logMAR (equivalent to 3 lines) worse to HM (2.3) and a further 0.3 logMAR worse to LP (2.6).
In our trial study drug improved visual acuity by 3 lines or more in one of six participants with visual loss longer than 12 months. The gene therapy clinical trial in China reported improvements of 3 lines or more in 5 of 9 G11778A LHON patients (7 of their patients were treated more than one year after visual loss) with 36 months of follow-up.16;17 In our natural history study,4 only 3 patients recovered vision of 3 lines or more 12 months after the onset of visual loss (7%). In our gene therapy study we observed increases in acuity of approximately 3 lines or more on the ETDRS chart in 3 of 6 patients treated within a year of visual loss. In the Chinese study 2 patients were treated within one year of visual loss, one showing improvement while the other did not.16;17
In designing the study we altered the timing of treatment to those with visual bilateral loss for more than a year (group I), less than a year (group II) and those who still retained good vision in one eye (group III). With the low and medium doses thus far, we have seen improvements in group I (n = 1 of 6 patients) and group II (n = 3 of 6 patients) and have seen loss of vision in group 3 (n = 1 of 2). At this point the response to treatment seems to be best when given with a year of visual loss. Improvements in vision of treated eyes was seen quickly within 7–30 days post injection, during a time when expression in preclinical studies was seen in 90% of rodent RGCs.18 Vision in these patients improved further with longer follow-up. Rapid and persistent expression of the vector seen in our animal studies may have played some role.19 While our rodent studies have demonstrated that transgene expression and integration of the allotopic ND4 into complex I of the rodent retina occurs in almost all RGCs within one week, it is unlikely that similar experiments will be done to determine whether this is also the case in human gene therapy patients as their eyes are not available for histochemical studies.
Despite vision improvements the PERG analysis suggests that injection of this vector has a small adverse effect on retinal ganglion cell function. In our preclinical animal studies we did find a drop in the PERG amplitude with injection of recombinant AAV containing an irrelevant gene (green fluorescent protein or cherry) into control eyes.20;21 It is unlikely that human gene therapy trials will include sham intravitreal injections into control eyes to ascertain effects on the PERG. Although a non-mitochondrial retinal disease, LCA2 caused by recessive mutations in the RPE gene RPE65 has undergone long term follow up in patients after subretinal AAV vector mediated delivery of the normal RPE65 cDNA.22
Outcomes from 14 participants enrolled in this trial treated with the low and medium dose study vector found no serious safety concerns associated with allotopic gene therapy for LHON. One patient in Group III lost vision due to the course of bilateral visual loss characteristic of LHON that was unaltered by treatment with the low dose. We judged the primary adverse event definitely related to study drug was anterior uveitis. Fortunately, uveitis associated with our gene therapy was mild, asymptomatic, transient and required no treatment. It is unclear whether it was related to levels of serum neutralizing antibodies. One of the patients had a rise in serum neutralizing antibodies post injection while the other had no change in neutralizing antibodies that were at the highest levels detected in our study prior to injection. While uveitis was not seen in our natural history of LHON patients,9 ocular inflammation was seen in our preclinical work with nonhuman primates and it also resolved without treatment or sequelae as detected clinically and at necropsy.23 The Chinese gene therapy trial for G11778A LHON did not describe uveitis in any of their 9 treated patients. They had medicated their patients with oral prednisone one week before treatment and continued it for 2 months after intravitreal injections.24 Ocular events related to the study drug injection procedure were elevated intraocular pressure and toxic keratitis in a single patient that we previously reported.9 Pre-and post-injection blood samples were negative for vector DNA, indicating there was no significant leakage of vector into the systemic circulation.
Despite the absence of vector DNA in participant blood samples, neutralizing serum antibodies (Nabs) to AAV2 that could potentially reduce the expression of the delivered wild-type ND4 gene or cause ocular inflammation were elevated in all participants prior to injection and increased in 3 participants. Uveitis was associated with a rise in serum neutralizing antibodies in one patient but not in the other who had very high levels at baseline. Surprisingly the four patients that showed the most improvement in visual acuity with treatment had the highest levels of serum neutralizing antibodies. Baseline Nab levels detected from intraocular fluid removed at the time of injection were much lower than serum levels in all participants. The 4 patients with improved vision had similar low levels of Nabs, detected in ocular fluid, as those that did not recover visual acuity. Taken together these findings suggest that high serum levels of Nabs may not be a barrier to successful ocular gene therapy.
In contrast to our initial preclinical studies showing rescue of oxidative phosphorylation in G11778A LHON cells,7 Oca-Cossio and coworkers25 reported that allotopic expression killed cultured cells, thus was deemed unsafe. Here we showed that the temporal RNFL of our treated patients followed for 12 months was not damaged by allotopic ND4 gene therapy. One year post treatment values were similar to those obtained prior to treatment. In contrast, temporal RNFL of fellow eyes continued to thin. If this finding was due to a lack of reproducibility of OCT in our patients it would lead to attenuated correlations and insufficient statistical power, that is, an inability to find truly significant effects. Thus, we can see how lack of reproducibility could explain our failure to find an effect for average RNFL, but not the difference we noted between loss rates at the temporal quadrant in injected versus fellow eyes.26 This finding could be spurious and confirmation would be desirable, but lack of reproducibility is not the cause. Thus, our OCT data shows here that allotopic ND4 was not harmful to visual function and it did not damage the temporal RNFL subserving macular fibers targeted by an intravitreal AAV2 injection.27;28 These results pave the way for injection of high dose cohorts next.
Acknowledgments
Funding/Support: Supported by the National Eye Institute, National Institutes of Health, Department of Health and Human Services. Grant numbers: 1U10EY023558-01A1 (Guy), 1U10EY024247-01 (Feuer) and P30EY014801 (Porciatti) and P30EY021721 (Hauswirth), Research to Prevent Blindness, Inc. (Ophthalmology, University of Miami and University of Florida)
Footnotes
Publisher's Disclaimer: This is a PDF file of an unedited manuscript that has been accepted for publication. As a service to our customers we are providing this early version of the manuscript. The manuscript will undergo copyediting, typesetting, and review of the resulting proof before it is published in its final citable form. Please note that during the production process errors may be discovered which could affect the content, and all legal disclaimers that apply to the journal pertain.
Dr. Guy is an inventor of the technology used in this Study (US Patent 7,405,284 “Reducing cellular dysfunction caused by mitochondrial genes) and it is possible that he may receive royalties in the future should the product ever become commercialized.
Here we initiated a human gene therapy trial in the USA designed to determine the effects of escalating doses of a modified adenoassociated vector containing a normal nuclear-encoded NADH:ubiquinone oxidoreductase subunit 4 (ND4) gene.
Reference List
- 1.Wallace DC, Singh G, Lott MT, et al. Mitochondrial DNA mutation associated with Leber’s hereditary optic neuropathy. Science. 1988;242:1427–30. doi: 10.1126/science.3201231. [DOI] [PubMed] [Google Scholar]
- 2.Prado RC, Moura FC. Leber Hereditary Optic Neuropathy with Interval of Visual Loss Greater Than 12 Months. Neuroophthalmology. 2016;40:243–6. doi: 10.1080/01658107.2016.1213860. [DOI] [PMC free article] [PubMed] [Google Scholar]
- 3.Ohden KL, Tang PH, Lilley CC, Lee MS. Atypical Leber Hereditary Optic Neuropathy: 18 Year Interval Between Eyes. J Neuroophthalmol. 2016;36:304. doi: 10.1097/WNO.0000000000000346. [DOI] [PubMed] [Google Scholar]
- 4.Lam BL, Feuer WJ, Schiffman JC, et al. Trial end points and natural history in patients with G11778A Leber hereditary optic neuropathy : preparation for gene therapy clinical trial. JAMA Ophthalmol. 2014;132:428–36. doi: 10.1001/jamaophthalmol.2013.7971. [DOI] [PMC free article] [PubMed] [Google Scholar]
- 5.Carelli V, Ghelli A, Bucchi L, et al. Biochemical features of mtDNA 14484 (ND6/M64V) point mutation associated with Leber’s hereditary optic neuropathy. Ann Neurol. 1999;45:320–8. [PubMed] [Google Scholar]
- 6.Ghosh SS, Fahy E, Bodis-Wollner I, et al. Longitudinal study of a heteroplasmic 3460 Leber hereditary optic neuropathy family by multiplexed primer-extension analysis and nucleotide sequencing. Am J Hum Genet. 1996;58:325–34. [PMC free article] [PubMed] [Google Scholar]
- 7.Guy J, Qi X, Pallotti F, et al. Rescue of a mitochondrial deficiency causing Leber Hereditary Optic Neuropathy. Ann Neurol. 2002;52:534–42. doi: 10.1002/ana.10354. [DOI] [PubMed] [Google Scholar]
- 8.Koilkonda RD, Yu H, Chou TH, et al. Safety and effects of the vector for the Leber hereditary optic neuropathy gene therapy clinical trial. JAMA Ophthalmol. 2014;132:409–20. doi: 10.1001/jamaophthalmol.2013.7630. [DOI] [PMC free article] [PubMed] [Google Scholar]
- 9.Feuer WJ, Schiffman JC, Davis JL, et al. Gene Therapy for Leber Hereditary Optic Neuropathy: Initial Results. Ophthalmology. 2016;123:558–70. doi: 10.1016/j.ophtha.2015.10.025. [DOI] [PMC free article] [PubMed] [Google Scholar]
- 10.Feuer WJ, Schiffman JC, Davis JL, et al. Gene Therapy for Leber Hereditary Optic Neuropathy: Initial Results. Ophthalmology. 2015 doi: 10.1016/j.ophtha.2015.10.025. [DOI] [PMC free article] [PubMed] [Google Scholar]
- 11.Porciatti V, Ventura LM. Normative data for a user-friendly paradigm for pattern electroretinogram recording. Ophthalmology. 2004;111:161–8. doi: 10.1016/j.ophtha.2003.04.007. [DOI] [PMC free article] [PubMed] [Google Scholar]
- 12.Ventura LM, Porciatti V, Ishida K, et al. Pattern electroretinogram abnormality and glaucoma. Ophthalmology. 2005;112:10–9. doi: 10.1016/j.ophtha.2004.07.018. [DOI] [PMC free article] [PubMed] [Google Scholar]
- 13.Maguire AM, Simonelli F, Pierce EA, et al. Safety and efficacy of gene transfer for Leber’s congenital amaurosis. N Engl J Med. 2008;358:2240–8. doi: 10.1056/NEJMoa0802315. [DOI] [PMC free article] [PubMed] [Google Scholar]
- 14.Maguire AM, High KA, Auricchio A, et al. Age-dependent effects of RPE65 gene therapy for Leber’s congenital amaurosis: a phase 1 dose-escalation trial. Lancet. 2009;374:1597–605. doi: 10.1016/S0140-6736(09)61836-5. [DOI] [PMC free article] [PubMed] [Google Scholar]
- 15.Holladay JT. Visual acuity measurements. J Cataract Refract Surg. 2004;30:287–290. doi: 10.1016/j.jcrs.2004.01.014. [DOI] [PubMed] [Google Scholar]
- 16.Wan X, Pei H, Zhao MJ, et al. Efficacy and Safety of rAAV2-ND4 Treatment for Leber’s Hereditary Optic Neuropathy. Sci Rep. 2016;6:21587. doi: 10.1038/srep21587. [DOI] [PMC free article] [PubMed] [Google Scholar]
- 17.Yang S, Ma SQ, Wan X, et al. Long-term outcomes of gene therapy for the treatment of Leber’s hereditary optic neuropathy. EBioMedicine. 2016;10:258–68. doi: 10.1016/j.ebiom.2016.07.002. [DOI] [PMC free article] [PubMed] [Google Scholar]
- 18.Koilkonda RD, Chou TH, Porciatti V, et al. Induction of rapid and highly efficient expression of the human ND4 complex I subunit in the mouse visual system by self-complementary adeno-associated virus. Arch Ophthalmol. 2010;128:876–83. doi: 10.1001/archophthalmol.2010.135. [DOI] [PMC free article] [PubMed] [Google Scholar]
- 19.Koilkonda RD, Chou TH, Porciatti V, et al. Induction of rapid and highly efficient expression of the human ND4 complex I subunit in the mouse visual system by self-complementary adeno- associated virus. Arch Ophthalmol. 2010;128:876–83. doi: 10.1001/archophthalmol.2010.135. [DOI] [PMC free article] [PubMed] [Google Scholar]
- 20.Koilkonda R, Yu H, Talla V, et al. LHON gene therapy vector prevents visual loss and optic neuropathy induced by G11778A mutant mitochondrial DNA: biodistribution and toxicology profile. Invest Ophthalmol Vis Sci. 2014;55:7739–53. doi: 10.1167/iovs.14-15388. [DOI] [PMC free article] [PubMed] [Google Scholar]
- 21.Koilkonda RD, Yu H, Chou TH, et al. Safety and effects of the vector for the Leber hereditary optic neuropathy gene therapy clinical trial. JAMA Ophthalmol. 2014;132:409–20. doi: 10.1001/jamaophthalmol.2013.7630. [DOI] [PMC free article] [PubMed] [Google Scholar]
- 22.Jacobson SG, Cideciyan AV, Roman AJ, et al. Improvement and decline in vision with gene therapy in childhood blindness. N Engl J Med. 2015;372:1920–6. doi: 10.1056/NEJMoa1412965. [DOI] [PMC free article] [PubMed] [Google Scholar]
- 23.Koilkonda RD, Yu H, Chou TH, et al. Safety and Effects of the Vector for the Leber Hereditary Optic Neuropathy Gene Therapy Clinical Trial. JAMA Ophthalmol. 2014 doi: 10.1001/jamaophthalmol.2013.7630. [DOI] [PMC free article] [PubMed] [Google Scholar]
- 24.Wan X, Pei H, Zhao MJ, et al. Efficacy and Safety of rAAV2-ND4 Treatment for Leber’s Hereditary Optic Neuropathy. Sci Rep. 2016;6:21587. doi: 10.1038/srep21587. [DOI] [PMC free article] [PubMed] [Google Scholar]
- 25.Oca-Cossio J, Kenyon L, Hao H, Moraes CT. Limitations of allotopic expression of mitochondrial genes in mammalian cells. Genetics. 2003;165:707–20. doi: 10.1093/genetics/165.2.707. [DOI] [PMC free article] [PubMed] [Google Scholar]
- 26.Barboni P, Savini G, Feuer WJ, et al. Retinal nerve fiber layer thickness variability in Leber hereditary optic neuropathy carriers. Eur J Ophthalmol. 2012:0. doi: 10.5301/ejo.5000154. [DOI] [PubMed] [Google Scholar]
- 27.Tshilenge KT, Ameline B, Weber M, et al. Vitrectomy Before Intravitreal Injection of AAV2/2 Vector Promotes Efficient Transduction of Retinal Ganglion Cells in Dogs and Nonhuman Primates. Hum Gene Ther Methods. 2016;27:122–34. doi: 10.1089/hgtb.2016.034. [DOI] [PubMed] [Google Scholar]
- 28.Yin L, Greenberg K, Hunter JJ, et al. Intravitreal injection of AAV2 transduces macaque inner retina. Invest Ophthalmol Vis Sci. 2011;52:2775–83. doi: 10.1167/iovs.10-6250. [DOI] [PMC free article] [PubMed] [Google Scholar]