

Abstract
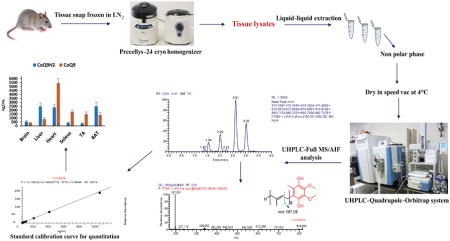
Coenzyme Q (CoQ) is a redox active molecule that plays a fundamental role in mitochondrial energy generation and functions as a potent endogenous antioxidant. Redox ratio of CoQ has been suggested as a good marker of mitochondrial dysfunction and oxidative stress. Nevertheless, simultaneous measurement of redox states of CoQ is challenging owing to its hydrophobicity and instability of the reduced form. In order to improve the analytical methodology, paying special attention to this instability, we developed a highly sensitive and selective high-resolution/accurate-mass (HR/AM) UHPLC-MS/MS method for the rapid determination of redox states of CoQ9 and CoQ10 by ultra-performance liquid chromatography-hybrid quadrupole-Orbitrap mass spectrometry. CoQs were extracted using hexane with the addition of butylated hydroxytoluene to limit oxidation during sample preparation. Chromatographic separation of the analytes was achieved on a Kinetex C18 column with the isocratic elution of 5 mM ammonium formate in 2-propanol/methanol (60:40) within 4 min. A full MS/all ion fragmentation (AIF) acquisition mode with mass accuracy < 5ppm was used for detection and determination of redox states of CoQ9 and CoQ10 in healthy mice tissues using reduced and oxidized CoQ4 as internal standards. The validated method showed good linearity (r2≥ 0.9991), intraday, inter-day precision (CVs ≤ 11.9%) and accuracy (≤ ±15.2%). In contrast to existing methods, the current method offers enhanced sensitivity (up to 52 fold) with LOD and LOQ ranged from 0.01–0.49 ng mL−1 and 0.04–1.48 ng mL−1, respectively. Moreover, we evaluated various diluents to investigate bench top stability (at 4°C) of targeted analytes in tissue samples during LC-MS assay up to 24 h. Ethanol was determined to be an optimum diluent without any significant oxidation of reduced CoQ up to 24 h. The developed method offers a rapid, highly sensitive and selective strategy for the measurement of redox states of CoQs in clinical studies.
Keywords: Coenzyme Q9, Coenzyme Q10, Redox states, Orbitrap, HR/AM
Graphical Abstract
1. Introduction
Coenzyme Q (CoQ), also known as ubiquinone, is a lipophilic molecule consisting of a redox active benzoquinone head conjugated to a polyisoprenoid side chain of species-specific length (6–10 subunits; within mammals only CoQ9 and CoQ10 are found) [1, 2]. It presents mainly in the inner mitochondrial membrane (IMM) of eukaryotic cells and exists in three redox states, i.e. oxidized (CoQ), free-radical intermediate (semiquinone, CoQH.−) and reduced (CoQH2) [1, 3]. CoQ plays a central role in cellular bioenergetics and functions as an electron carrier in the mitochondrial electron transport chain (ETC) for ATP production. Moreover, it acts as a potent endogenous antioxidant in its reduced form that prevents lipid peroxidation, protein carbonylation and oxidative damage to DNA, also capable of regenerating other powerful antioxidant e.g. α-tocopherol and ascorbate [1, 4]. Therefore, CoQ has been suggested as a good marker of mitochondrial dysfunction and oxidative stress. In addition, it has been used as a nutritional supplement or therapeutic agent in several diseases, i.e. cancer [5], cardiovascular [6] and neurodegenerative diseases [7].
As the vital functions of CoQ depend on its concentration and redox ratio, measurement of redox states has recently gained significant interest in clinical research [8–11]. A variety of analytical methods including high-performance liquid chromatography (HPLC) coupled with ultraviolet (UV) [11–16], chemiluminescence [17] and electrochemical detection (ECD) [15], ultra/high-performance liquid chromatography-tandem mass spectrometry (HPLC/UHPLC-MS/MS) [18–22] have been reported for assessment of CoQ9 and CoQ10 in biological fluids, cells, and tissues. Nevertheless, due to the hydrophobicity and instability of the reduced form of CoQ, highly sensitive and selective analytical methods should be further explored for the rapid measurement of redox states.
Only a handful of methods have been reported for simultaneous assessment of redox states of CoQ9 or CoQ10 however, these methods are limited by poor sensitivity and long analysis time [19, 23–25]. Moreover, the reported LC-MS/MS methods are mainly based on the triple quadrupole mass spectrometer (TQ-MS) that is prone to false compliant and non-compliant results due to low resolution [26–28]. Recent advancements in high-resolution mass spectrometry (HRMS) instrumentation resulted in the quadrupole-orbitrap (Q-Exactive) hybrid tandem mass spectrometer that combines the mass selection/isolation capability of the quadrupole with the high resolution/accurate mass (HR/AM) measurement capacity of Orbitrap, thereby potentially avoiding false positive and false negative findings [28–30]. Furthermore, several studies have demonstrated that in contrast to TQ-MS, HR/AM methods with resolution >50,000 full width at half-maximum (FWHM) and accuracy < 5ppm offers higher selectivity for trace level detection and quantification of compounds in complex biological matrices [28–31].
In this context, we developed and validated a highly sensitive and selective HR/AM UHPLC-MS method in full MS/all ion fragmentation (AIF) acquisition mode for rapid assessment of redox states of CoQ using UHPLC-Q-Orbitrap. The developed method was successfully applied to determine redox states of CoQ9 and CoQ10 in various tissues, i.e. brain, heart, liver, brown adipose tissue (BAT), soleus and tibialis anterior muscle (TA) of healthy mice using reduced and oxidized CoQ4 as internal standards (IS). Moreover, we have evaluated full MS/AIF and targeted SIM/data-dependent MS/MS (tSIM/ddMS/MS) acquisition modes of Q-Orbitrap with respect to sensitivity and different extraction solvents as well as diluents concerning the instability of reduced CoQ in biological matrices.
2. Materials and methods
2.1. Chemicals and reagents
LC-MS grade methanol, 2-propanol, 1-propanol, ammonium formate, chloroform and ACS reagent grade hexane, ethanol, butylated hydroxytoluene (BHT), sodium borohydride (NaBH4) and 6 N hydrochloric acid (HCl) solution were obtained from Fisher Scientific (Pittsburgh, PA, USA). Mass spectrometry calibration solutions (Thermo Scientific Pierce LTQ Velos ESI positive and negative ion calibration solutions) were procured from Thermo Fisher Scientific (San Jose, CA, USA). Coenzyme Q4 (purity ≥ 90%), used as an internal standard, coenzyme Q9 (purity ≥ 95% ) and coenzyme Q10 (purity ≥ 98%) were procured from Sigma–Aldrich (St. Louis, MO, USA), Cayman Chemical Company (Ann Arbor, MI, USA), Fisher Scientific, respectively. Ultrapure water was obtained from Milli-Q system (Millipore Co., Billerica, MA, USA).
2.2. Instrumentation and analytical conditions
The UHPLC-MS/MS analysis was performed on a Hybrid quadrupole-Orbitrap mass spectrometer (Q Exactive, Thermo Scientific, Waltham, MA, USA) hyphenated with a Thermo Scientific Accela 1250 UHPLC system via electrospray ionization source. The Accela UHPLC system equipped with a quaternary pump, vacuum degasser and an open autosampler with a temperature controller. Chromatographic separation of targeted analytes and internal standard was achieved on a Kinetex C18 150 × 2.1 mm (2.6 μm, 100 Å) column (Phenomenex, Torrance, CA) with isocratic elution of 5 μM ammonium formate in 2-propanol/methanol (60:40) at a flow rate of 260 μL min−1 within 4 min. The sample injection volume was 5 μL.
Detection and determination was performed in full MS/AIF mode with positive electrospray ionization mode. Optimized MS parameters were as follow: spray voltage, 4.0 kV; capillary temperature, 300 °C; sheath gas, 50 (arbitrary units); auxiliary gas, 10 (arbitrary units); microscans, 1; maximum injection time, 200 ms; AGC target, 1e6/5e5; mass resolution, 140,000/70,000 FWHM; m/z range, 150–1000, higher energy collisional dissociation (HCD) energy; 22 eV. Nitrogen was employed as a collision gas. The mass spectrometer was calibrated before analysis using commercial calibration solutions to maintain mass accuracy below 5 ppm. The Xcalibur 2.2 software (Thermo Scientific, Waltham, MA, USA) was used to control the instrument and for data acquisition and processing. Q Exactive 2.2 SP 1 (Thermo Scientific) was used to control the tuning window of mass spectrometer.
2.3 Sample preparation and extraction procedures
2.3.1. Calibration standards and quality control samples
The stock solutions (1000 μg mL−1) of CoQ4 (ubiquinone-4), CoQ9 (ubiquinone-9) and CoQ10 (ubiquinone-10) were prepared in hexane and stored at −80°C. As the reduced CoQs were not commercially available, ubiquinol-4 (CoQ4H2), ubiquinol-9 (CoQ9H2) and ubiquinol-10 (CoQ10H2) were prepared by reduction of the corresponding oxidized form following the previously reported procedure with slight modifications [19]. Briefly, 50 μL of the stock solution of CoQ9 or CoQ10 or CoQ4 was diluted with 1.95 mL hexane in a glass tube. Subsequently, 100 μL of methanol and 200 μL water containing 20 mg of NaBH4 were added and the reaction mixture was stirred for 3 min, then placed in dark for 30 min at RT. After reduction, 1 mL of water containing 100 μM of EDTA was added, the resulting solution was centrifuged at 4750 rpm for 8 min at 4°C and the supernatant was transferred to a glass tube. As the oxidized form was quantitatively converted to the reduced form, the concentration of the resulting reduced form should equal that of the starting CoQ (25 μg mL−1). The fresh stock solutions of the reduced form were prepared immediately prior to analysis due to their instability.
The calibration standards were prepared by serial dilution of stock solution of targeted analytes in blank tissue matrices within the ranges from 0.1–6000 ng mL−1. Internal standards (CoQ4 and CoQ4H2) were spiked in each calibration standard at a concentration of 250 ng mL−1. The blank tissue matrices were prepared by stripping tissue homogenates with activated charcoal following the procedure described by Y. Alnouti et al [32]. Quality control (QC) samples were prepared to evaluate precision, accuracy and matrix effect of the method by spiking standard stock solutions in neat diluent and blank tissue matrices at three concentration levels (10, 100, and 1000 ng mL−1) namely low QC, mid QC and high QC.
2.3.2. Tissue samples
All animal experiments were carried out in accordance to the Association for Assessment and Accreditation of Laboratory Animal Care (AAALAC) and approved by the Institutional Animal Care and Use Committee at The University of Texas at Austin (IACUC, AUP-2015-00175). All animals were fed standard chow diet and water ad libitum and housed on a 12:12 light dark cycle. Tissue harvesting took place at 15:00 and mice were euthanized prior to tissue harvest with isoflurane inhalation followed by cervical dislocation. Tissues were harvested from 7 week-old male wild-type C57B6/J mice, quickly perfused with ice cold PBS to remove contaminating blood (liver and heart), followed by flash freezing in LN2 and stored at −80°C until processing. Brown adipose tissue (BAT) was harvested from the interscapular region; brain denotes the neocortex and frontal cortex; TA corresponds to the tibialis anterior muscle.
Extraction of CoQs from tissue samples was performed by liquid-liquid extraction. Tissue aliquots were weighed (~5 mg) in 2 mL tissue homogenization tubes containing ceramic beads and homogenized in a Precellys-24 cryo homogenizer (BertinTechnologies, Saint Quentin en Yvelines, France, EU) for two cycles (6500 rpm, 30 s) at 4°C by adding 25 μL BHT solution (5000μg mL−1), 250 ng mL−1 IS solution and 500 μL chilled ethanol:2-propanol (95:5). Homogenates were transferred into glass vials containing 1250 μL chilled hexane and 250 μL water, vortexed for 30 s and centrifuged at 4750 rpm for 8 min at 4°C. The supernatant was transferred to a glass vial and evaporated to dryness in a CentriVap refrigerated vacuum concentrator (Labconco, Kansas City, MO, USA) at 4°C and re-suspended in 200 μL of ethanol/6N HCl (95:5) for LC-MS analysis. All the sample preparation steps were carried out on ice to maintain low temperature for stability of the targeted analytes.
3. Results and discussion
3.1. Optimization of extraction procedure
The assessment of redox states of CoQ in biological matrices is hampered by the instability of its reduced form; therefore, sample preparation is a crucial step that affects redox ratio or quantitative yield. Owing to their hydrophobic nature, CoQs are readily soluble in non-polar solvents, i.e. hexane, chloroform etc. and sparingly soluble in lower alcohols, i. e. 1-propanol > 2-propanol > ethanol. Here, we selectively extracted the non-polar phase from tissue samples using liquid-liquid extraction (LLE). We evaluated the extraction efficiency of two different solvent mixtures, i.e. water/ethanol:2-propanol (95:5)/hexane (1:2:5) and water/methanol/chloroform (1:2:5). Hexane was more efficient than chloroform with the signal enhancement factor ranging from 1.2–9.3 fold increase for both forms of CoQs (Table S1, Fig. S1). Therefore, water/ethanol:2-propanol/hexane was selected for subsequent studies. One-step extraction using 1-propanol/methanol was reported earlier for the rapid assessment of CoQs, but the lower solubility and complex sample matrix might lead to low extractive yield and ion suppression or matrix effect, thereby resulted in a less sensitive analysis [23, 24]. Furthermore, to ensure the stability of the targeted analytes and to limit oxidation during sample preparation and LC-MS analysis, we added BHT directly to the frozen tissue prior to addition of extractive solvents during homogenization. Ethanol acidified with HCl has been reported earlier as an optimum diluent for prolonged stability and preventing autoxidation of reduced CoQs [33–35]. Therefore, we compared different diluents (1-propanol, 2-propanol, ethanol and mobile phase) acidified with 5% 6N HCl to assess the stability of reduced CoQs in tissue samples on the autosampler during LC-MS assay up to 24 h (three-time points, i.e. 0 h, 6 h and 24 h). Stability was evaluated using paired t-test and ethanol with 5% 6N HCl resulted to be an optimum diluent, without any significant (p > 0.05) oxidation of the reduced form up to 24 h (Fig. 1). Therefore, this assay assured the accuracy of redox states quantitation during long sequence acquisition (more than 200 samples). The stability of targeted analytes was far better than the reported method using methanol, 1-propanol as diluents, which were stable for only 2/3.5 h [24, 25].
Figure 1.

Effect of different diluents on benchtop stability (4°C) of reduced CoQs in tissue samples indicating ethanol as an optimum diluent without any significant degradation up to 24 h, *; p < 0.05, n=5
3.2. Optimization of chromatographic conditions
Chromatographic parameters such as column, mobile phase, flow rate and injection volume were systematically optimized to achieve rapid separation and high signal sensitivity of targeted analytes. Initially, two different columns including Synergi Hydro-RP 150 × 2 mm (4 μm, 80 Å) and Kinetex C18 150 × 2.1 mm (2.6 μm, 100 Å) were assessed using isocratic elution of the 100% methanol containing 5 mM ammonium formate, which is the most widely used mobile phase in reported methods [19, 24, 25]. The Synergi Hydro-RP resulted in the broad and split peaks of targeted analytes whereas Kinetex C18 resulted in sharp peaks with higher signal sensitivity (Fig. S2) at 700 μL min−1 flow rate and 20 min of chromatographic run time. Recent studies have indicated that the better performance of Kinetex C18 column is due to core-shell silica packing and smaller particle size (2.6 μm ) that produce higher efficiency, resolution and ultimately sharp peaks [36, 37]. Therefore, it was selected for further chromatographic optimizations. Since the targeted analytes are hydrophobic, in order to achieve very short chromatographic run time we assessed mobile phase consisting of less polar alcohols: 2-propanol/methanol (60:40) and 100% 2-propanol containing 5mM ammonium formate. We observed that 2-propanol/methanol (60:40) resulted in up to a 48-fold signal enhancement in 2 min of analysis (Fig. S2 and Table 1). Furthermore, we studied the influence of flow rate on signal sensitivity and observed that a decrease in flow rate from 700 μL min−1 to 260 μL min−1 increased sensitivity (Fig. S2). Therefore, 2-propanol/methanol (60:40) containing 5 mM ammonium formate at a flow rate of 260 μL min−1 was ultimately selected as an optimum mobile phase to obtain high signal sensitivity within 4 min of chromatographic run time with 5 μL of sample injection volume.
Table 1.
Signal comparison of CoQs using different mobile phase
| Coenzyme Q | m/z | Signal Intensity | Enhancement factor | |
|---|---|---|---|---|
|
| ||||
| 100% MeOH | 2-Propanol/MeOH (60:40) | |||
| CoQ9H2 | 814.671 | 1.05E+06 | 1.23E+06 | 1.2 |
| CoQ10H2 | 882.733 | 4.03E+05 | 8.17E+05 | 2.0 |
| CoQ9 | 812.655 | 3.12E+06 | 4.38E+07 | 14.0 |
| CoQ10 | 880.718 | 7.17E+05 | 3.46E+07 | 48.3 |
3.3. Optimization of MS parameters and acquisition modes
Initially, MS parameters such as maximum injection time, AGC target, resolution, scan events, normalized collision energy (NCE) were tuned by continuous infusion of 50 ng mL−1 of individual standard through a T connected to LC system with a flow rate of 5 μL min−1. CoQ4 and CoQ4H2 were selected as internal standards due to their structural similarity to the targeted analytes. Subsequently, the LC-MS acquisition method was established combining optimized MS and chromatographic parameters to study the effect of all mentioned parameters on signal sensitivity and peak shape. The optimized parameters are summarized in section 2.2. In full MS scan/precursor ion scan, oxidized and reduced CoQs were detected as [M+NH4]+ and [M+Na]+ adduct ions and [M+H]+ ions were observed only for the oxidized forms. We observed the highest signal sensitivity of [M+NH4]+ ions for CoQ9 at m/z 812.655, CoQ10 at m/z 880.718, CoQ4 at m/z 472.342, CoQ9H2 at m/z 814.671 and CoQ10H2 at m/z 882.733 and CoQ4H2 at m/z 474.358.
AIF mode at 22 eV CE was used for confirmatory analysis or structural characterization; all the targeted analytes generated common abundant fragment ion/product ion at m/z 197.081 corresponds to benzoquinone head by the loss of the isoprenoid side chain [19] (Fig. 2). Furthermore, to obtain high signal sensitivity of the targeted analytes, full MS/AIF and tSIM/ddMS/MS acquisition modes consisting of sequential monitoring of a precursor and a product ion were studied. Although targeted SIM was reported to be more sensitive than full MS, we observed low sensitivity and broad chromatographic peak for all analytes in targeted SIM mode whereas full MS/AIF resulted in higher signal sensitivity and excellent peak shape (Fig. S3). Finally, the optimized UHPLC-full MS/AIF method, monitoring precursor and product ion at resolution 140,000 and 70,000 FWHM respectively with mass accuracy < 5ppm was applied for the simultaneous determination of redox states of CoQ9 and CoQ10.
Figure 2.

HCD-ESI- MS/MS spectra of reduced and oxidized CoQ
3.4. Analytical method validation
The developed analytical method was validated according to the US Food and Drug Administration (FDA) guidelines [38] for bioanalytical method validation and method performance evaluated in term of following parameters: selectivity, linearity, limit of detection (LOD), limit of quantification (LOQ), accuracy, precision, matrix effect, carry-over effect and stability. Results of method performance experiments are presented in Table 2, Table 3 and Fig. 3.
Table 2.
Calibration equation, LOD, LOQ and matrix effect of targeted analytes in blank tissue matrices
| Analyte | LOD (ng mL−1) | LOQ (ng mL−1) | Calibration equation | r2 | Linear range (ng mL−1) | Matrix effect (%) |
|---|---|---|---|---|---|---|
| CoQ9H2 | ||||||
| Brain | 0.07 | 0.20 | y = −0.163+0.193x | 0.9994 | 2–1000 | 108.2±6.2 |
| Liver | 0.38 | 1.16 | y = −0.006+0.163x | 0.9993 | 2–3000 | 93.2±3.9 |
| Heart | 0.04 | 0.13 | y = −0.092+0.163x | 0.9995 | 2–3000 | 107.9±9.9 |
| Soleus | 0.15 | 0.44 | y = −0.023+0.198 x | 0.9991 | 1–2000 | 87.1±9.4 |
| TA | 0.07 | 0.22 | y = −0.040+0.181x | 0.9993 | 2–2000 | 97.5±3.6 |
| BAT | 0.49 | 1.48 | y = −0.082+0.149x | 0.9993 | 2–3000 | 98.0±13.5 |
| CoQ10H2 | ||||||
| Brain | 0.01 | 0.04 | y = 0.006+0.160x | 0.9992 | 2–300 | 105.6±9.5 |
| Liver | 0.03 | 0.09 | y = −0.040+0.203x | 0.9992 | 2–300 | 101.0±11.9 |
| Heart | 0.05 | 0.15 | y = −0.020+0.171x | 0.9993 | 2–300 | 109.1±12.5 |
| Soleus | 0.03 | 0.09 | y = 0.056+0.216x | 0.9991 | 2–300 | 86.1±5.8 |
| TA | 0.01 | 0.04 | y = 0.233+0.191x | 0.9991 | 2–300 | 106.2±12.9 |
| BAT | 0.08 | 0.23 | y = −0.039+0.153x | 0.9995 | 0.5–2000 | 96.8±11.8 |
| CoQ9 | ||||||
| Brain | 0.07 | 0.21 | y= 0.034+0.062x | 0.9992 | 0.1–1000 | 106.8±4.8 |
| Liver | 0.29 | 0.86 | y = 0.012+0.043x | 0.9991 | 1–2000 | 109.1±6.8 |
| Heart | 0.20 | 0.59 | y = −0.003+0.044x | 0.9996 | 1–6000 | 106.5±9.5 |
| Soleus | 0.14 | 0.42 | y = 0.005+0.052x | 0.9994 | 1–3000 | 97.4±11.1 |
| TA | 0.19 | 0.58 | y = 0.008+0.051x | 0.9993 | 0.5–2000 | 105.7±13.5 |
| BAT | 0.05 | 0.14 | y = −0.003+0.046x | 0.9992 | 0.5–3000 | 112.2±11.2 |
| CoQ10 | ||||||
| Brain | 0.06 | 0.17 | y = 0.011+0.058x | 0.9991 | 1–1000 | 94.2±13 |
| Liver | 0.05 | 0.14 | y = 0.041+0.052x | 0.9991 | 0.5–1000 | 94.6±9 |
| Heart | 0.05 | 0.17 | y = 0.386+0.083x | 0.9992 | 1–1000 | 95.8±12.7 |
| Soleus | 0.03 | 0.10 | y = −0.057+0.058x | 0.9991 | 1–500 | 87.7±12 |
| TA | 0.02 | 0.07 | y = −0.072+0.072x | 0.9991 | 1–500 | 95.1±13 |
| BAT | 0.02 | 0.06 | y = −0.001+0.049x | 0.9991 | 0.5–1000 | 95.4±13.1 |
TA; tibialis anterior muscle, BAT; brown adipose tissue
Table 3.
Precision and accuracy for targeted analytes in the blank brain tissue matrix and neat diluent
| Analyte | Intraday validation (n=5)
|
Inter-day validation (n=15)
|
||||||||||
|---|---|---|---|---|---|---|---|---|---|---|---|---|
| Precision (CV %)
|
Accuracy (RE %)
|
Precision (CV %)
|
Accuracy (RE %)
|
|||||||||
| QC1 | QC2 | QC 3 | QC 1 | QC2 | QC3 | QC1 | QC2 | QC3 | QC1 | QC2 | QC3 | |
| CoQ9H2 | ||||||||||||
| Brain | 9.0 | 5.0 | 11.9 | 5.9 | −7.5 | 6.2 | 9.5 | 8.6 | 10.8 | −2.5 | −7.9 | 1.5 |
| Neat diluent | 9.6 | 5.1 | 10.5 | −4.0 | −11.1 | 6.3 | 9.2 | 4.9 | 11.5 | −8.3 | −11.5 | 3.9 |
| CoQ10H2 | ||||||||||||
| Brain | 2.8 | 1.6 | 4.1 | −13.1 | −12.9 | −12.1 | 4.1 | 3.1 | 4.3 | −11.8 | −12.8 | −11.2 |
| Neat diluent | 4.0 | 2.4 | 3.9 | −11.9 | −14.0 | −9.4 | 1.9 | 6.0 | 2.1 | −13.4 | −14.3 | −12.9 |
| CoQ9 | ||||||||||||
| Brain | 6.1 | 4.5 | 4.4 | 11.6 | 8.2 | 9.9 | 10.8 | 7.9 | 3.1 | 1.7 | 5.7 | 9.5 |
| Neat diluent | 4.6 | 5.4 | 0.7 | 7.3 | 7.6 | 15.2 | 9.1 | 11.7 | 8.8 | 4.7 | 0.4 | 9.6 |
| CoQ10 | ||||||||||||
| Brain | 4.5 | 1.2 | 3.0 | 11.6 | 10.5 | 13.1 | 10.6 | 11.2 | 9.7 | 1.6 | −0.5 | −0.6 |
| Neat diluent | 11.0 | 3.5 | 5.2 | 4.1 | 10.3 | 13.0 | 7.6 | 2.2 | 2.0 | −7.3 | 10.5 | 12.5 |
QC1; low QC (10 ng mL−1), QC2; mid QC (100 ng mL−1), QC3; high QC (1000 ng mL−1), n; technical replicates
Figure 3.

Stability of targeted analytes on autosampler at (A) low QC (10 ng mL −1), (B) mid QC (100 ng mL −1 ), and high QC (1000 ng mL −1 ) levels, *; p < 0.05, n=5
The selectivity of the method was demonstrated by LC-MS/MS analysis of blank tissue matrix from six different tissues. No interference peak was observed at the retention time of the targeted analytes and the internal standards (Fig. S4).
Linearity was assessed by analyzing calibration standards at a minimum of seven concentration levels ranging from 0.1–6000 ng mL−1. Calibration curves were constructed by plotting the analytes-to-IS peak area ratio (analyte/IS) versus nominal concentration using least-squares linear regression with a weight factor of 1/x2. As presented in Table 2, all targeted analytes showed good linearity of calibration curves with the correlation coefficient r2 ≥ 0.9991 within the test ranges. The LOD and LOQ were determined based on calibration curve method using following equations: LOD = (3.3×Sxy)/Sa and LOQ = (10×Sxy)/Sa, where Sxy is the residual standard deviation of the regression line and Sa is the slope of calibration curve. The LOD for CoQ9H2, CoQ10H2, CoQ9 and CoQ10 ranged from 0.01–0.49 ng mL−1and LOQs from 0.04–1.48 ng mL−1 in all tissue matrices (Table 2). The developed method was more sensitive than the reported methods with 13 to 52 fold enhancement in detection sensitivities of targeted analytes (Table S2).
Accuracy and intra and inter-day precisions were assessed by replicate injections (n=5) of QC samples in neat diluents and blank brain tissue matrix at three concentration levels (low, mid and high QC) within the same day and by repeating the experiments on three successive days. Accuracy was expressed as the percent error of measured concentrations from the nominal concentrations and calculated as follow: Mean relative error = (measured concentration – nominal concentration)/nominal concentration × 100.
Precision was expressed as the coefficient of variation (CV) of the measured concentration among each assay. As shown in Table 3, accuracies of low, mid and high QC ranged from −14.3 to 15.2% and CVs of intra-day and inter-day precisions were ≥ 11.9%.
Matrix effect (ME) was evaluated by comparing the peak areas (B) of targeted analytes in blank tissue matrix (spiked post extraction) with the peak areas (A) of targeted analytes in neat diluent and calculated using the following equation: ME (%) = B/A × 100. In all the investigated tissue matrices, ME for targeted analytes ranged between 86.1 and 112.2 %, indicating negligible or minor effect on ionization (Table 2)
Carryover effect was assessed by injecting high QC followed by solvent blank in five replicates. No carry-over peak of targeted analytes was observed in the solvent blank injected immediately after high QC (n=5).
Stability of targeted analytes was studied in term of short-term stability and long-term stability. It was evaluated as the deviation of peak area obtained after various storage conditions from the freshly prepared QC samples. Short-term stability was performed by analyzing (n=5) QC samples kept on the autosampler (at 4°C) after 4, 8, 12, 16 and 24 h. No significant (p > 0.05) degradation was observed for all targeted analytes up to 12 h at high QC level and up to 8 h at low and mid QC levels (Fig. 3). However, using BHT as an antioxidant, all targeted analytes were stable in tissue samples up to 24 h (discussed in section 3.1, Fig. 1). Long-term stability was performed by analyzing QC samples kept at −80°C after 2 months. All the analytes were found stable at mid and high QC levels for 2 months.
3.5. Application of method
To demonstrate the applicability of the fully validated HR/AM UHPLC-MS method, it was subsequently used to measure levels of reduced and oxidized CoQ9 and CoQ10 in different tissue homogenates, i.e. brain, heart, liver, BAT, soleus and TA muscles of healthy mice using reduced and oxidized CoQ4 as IS. UHPLC-MS base peak chromatograms of all tissues are presented in Fig. 4.
Figure 4.

Base peak chromatograms of targeted analytes and IS, (A) brain, (B) liver, (C) heart, (D) soleus muscle, (E) tibialis anterior muscle (TA) (F) brown adipose tissue (BAT), 1; CoQ4H2, 2; CoQ4, 3; CoQ9H2, 4; CoQ10H2, 5; CoQ9, 6; CoQ10
As shown in Table 4 and Fig. 5 reduced CoQ9 dominated in liver (74.4%), BAT (64.1%), brain (58.5%), and oxidized CoQ9 in TA (84.4%), soleus (81.2%) and heart (69.8%). Coenzyme Q9 is the predominant form in the mice tissue, however considerable amounts of total CoQ10 were observed in all investigated tissues with the highest amount in brain (27.4%) and lowest amount in liver (2.2%). Abundant levels of reduced CoQ10 were found in BAT (88%) and liver (80.5%) whereas oxidized CoQ10 dominated in TA (80.5%), soleus (78.4%), brain (65.6%) and heart (64.9). The highest concentration of total CoQ was observed in heart (8300 ng mL−1) followed by BAT (4201 ng mL−1), liver (3415 ng mL−1), soleus (2321 ng mL−1), TA (1877 ng mL−1) and brain (1305 ng mL−1).
Table 4.
Concentration of redox states of coenzymes Q9 and Q10 in various tissues of healthy mice
| Mice Tissue (n=5) | Coenzmye Q (ng mL−1)
|
T CoQ | T CoQ9 | T CoQ10 | %T CoQ9 | %T CoQ10 | |||
|---|---|---|---|---|---|---|---|---|---|
| CoQ9H2 | CoQ9 | CoQ10H2 | CoQ10 | ||||||
| Brain | 554 | 393 | 123 | 235 | 1305 | 947 | 358 | 72.6 | 27.4 |
| SD | 135 | 86.0 | 30.4 | 57.7 | 277 | 213 | 65.4 | ||
| CV(%) | 24.3 | 21.9 | 24.7 | 24.6 | 21.2 | 22.5 | 18.3 | ||
| Liver | 2483 | 856 | 61.2 | 14.8 | 3415 | 3339 | 76.0 | 97.8 | 2.2 |
| SD | 464 | 210 | 14.4 | 3.4 | 542 | 528 | 15.3 | ||
| CV(%) | 18.7 | 24.5 | 23.6 | 23.2 | 15.9 | 15.8 | 20.1 | ||
| Heart | 2357 | 5445 | 175 | 323 | 8300 | 7802 | 498 | 94.0 | 6.0 |
| SD | 330 | 566 | 30.2 | 46.8 | 799 | 741 | 67.1 | ||
| CV(%) | 14.0 | 10.4 | 17.2 | 14.5 | 9.6 | 9.5 | 13.5 | ||
| Soleus | 418 | 1809 | 20.5 | 74.1 | 2321 | 2226 | 94.6 | 95.9 | 4.1 |
| SD | 96.1 | 252 | 4.0 | 17.4 | 330 | 316 | 18.2 | ||
| CV(%) | 23.0 | 13.9 | 19.7 | 23.5 | 14.2 | 14.2 | 19.2 | ||
| TA | 317 | 1489 | 13.9 | 57.1 | 1877 | 1806 | 71.0 | 96.2 | 3.8 |
| SD | 69.4 | 284 | 2.9 | 13.1 | 350 | 337 | 15.1 | ||
| CV(%) | 21.9 | 19.1 | 20.9 | 23.0 | 18.7 | 18.6 | 21.3 | ||
| BAT | 2500 | 1400 | 265 | 36.0 | 4201 | 3900 | 301 | 92.8 | 7.2 |
| SD | 501 | 337 | 63.5 | 8.0 | 861 | 805 | 66.5 | ||
| CV(%) | 20.0 | 24.1 | 24.0 | 22.1 | 20.5 | 20.6 | 22.1 | ||
T; total, n; biological replicates, TA; tibialis anterior muscle, BAT; brown adipose tissue
Figure 5.

Concentration of redox states of coenzymes Q9 and Q10 in various tissues of healthy mice
In the published literature, only one study has been reported for simultaneous measurement of redox states of CoQ9 and CoQ10 in mice tissues, i.e. liver, heart, brain and muscle tissues using HPLC with coulometric detection [23]. They found the highest abundance of reduced CoQ in liver, heart and muscle tissue and oxidized CoQ in brain. In contrast to the coulometric detector, HR/AM-MS detector with full MS/AIF mode is highly sensitive and selective, also the UHPLC separation facilitates fast analysis. Compared to the previously reported HPLC method, that required 10–20 mg of tissue and long analysis time (16 min), the present method requires only a small amount (<5 mg) of sample and 4 min of analysis time; therefore, it is more efficient for clinical research where the amount of samples is typically limited.
Conclusions
The current study presents the comprehensive development and validation of a rapid and highly sensitive HR/AM UHPLC-MS method for the measurement of redox states of CoQ9 and CoQ10. The developed method markedly increased the detection sensitivities of targeted analytes up to 52 fold more than the existing methods and was very efficient for the determination of both forms of CoQ in a small amount (< 5 mg) of tissue sample. This study demonstrated that the application of accurate mass/high-resolution Q-Exactive mass spectrometer resulted in excellent selectivity with minor or no matrix effect. Moreover, using ethanol as a diluent and BHT as an antioxidant the current method assures the stability of reduced CoQs in tissue samples up to 24 h on auto-sampler, therefore provides a promising tool for the accurate quantification of redox states during long sequence batch. Regarding its high sensitivity, selectivity and fast analysis time, this method could be applicable for the clinical diagnosis and therapeutic interventions of diseases associated with mitochondrial dysfunction and oxidative stress.
Supplementary Material
A high-resolution/accurate-mass UHPLC-MS/MS method was developed and validated.
It was successfully applied to measure redox states of CoQ9 and CoQ10 in mice tissues.
Different extractive solvents and diluents were evaluated concerning the instability of reduced CoQs.
Present method offers enhanced sensitivity and selectivity compared to existing methods.
Acknowledgments
This work was supported by grants from the University of Texas System (ST: STAR Award), Hyundai Hope on Wheels research program, NIH R01 CA206210-01, and Cancer Prevention & Research Institute of Texas (CPRIT, DP150061).
Footnotes
Conflict of interest statement
Authors declare no competing financial or conflicts of interest.
Publisher's Disclaimer: This is a PDF file of an unedited manuscript that has been accepted for publication. As a service to our customers we are providing this early version of the manuscript. The manuscript will undergo copyediting, typesetting, and review of the resulting proof before it is published in its final citable form. Please note that during the production process errors may be discovered which could affect the content, and all legal disclaimers that apply to the journal pertain.
References
- 1.Wang Y, Hekimi S. Understanding ubiquinone. Trends in cell biology. 2016;26:367–378. doi: 10.1016/j.tcb.2015.12.007. [DOI] [PubMed] [Google Scholar]
- 2.Sohal RS, Forster MJ. Coenzyme Q, oxidative stress and aging. Mitochondrion. 2007;7:S103–S111. doi: 10.1016/j.mito.2007.03.006. [DOI] [PMC free article] [PubMed] [Google Scholar]
- 3.Quinzii CM, Hirano M. Coenzyme Q and mitochondrial disease. Developmental disabilities research reviews. 16:183–188. doi: 10.1002/ddrr.108. [DOI] [PMC free article] [PubMed] [Google Scholar]
- 4.Bentinger M, Tekle M, Dallner G. Coenzyme Q–biosynthesis and functions. Biochemical and biophysical research communications. 2010;396:74–79. doi: 10.1016/j.bbrc.2010.02.147. [DOI] [PubMed] [Google Scholar]
- 5.Roffe L, Schmidt K, Ernst E. Efficacy of coenzyme Q10 for improved tolerability of cancer treatments: a systematic review. Journal of Clinical Oncology. 2004;22:4418–4424. doi: 10.1200/JCO.2004.02.034. [DOI] [PubMed] [Google Scholar]
- 6.Graham D, Huynh NN, Hamilton CA, Beattie E, Smith RA, Cochemé HM, Murphy MP, Dominiczak AF. Mitochondria-targeted antioxidant MitoQ10 improves endothelial function and attenuates cardiac hypertrophy. Hypertension. 2009;54:322–328. doi: 10.1161/HYPERTENSIONAHA.109.130351. [DOI] [PubMed] [Google Scholar]
- 7.Spindler M, Beal MF, Henchcliffe C. Coenzyme Q10 effects in neurodegenerative disease. Neuropsychiatric disease and treatment. 2009;5:597. doi: 10.2147/ndt.s5212. [DOI] [PMC free article] [PubMed] [Google Scholar]
- 8.Götz M, Gerstner A, Harth R, Dirr A, Janetzky B, Kuhn W, Riederer P, Gerlach M. Altered redox state of platelet coenzyme Q10 in Parkinson’s disease. Journal of Neural Transmission. 2000;107:41–48. doi: 10.1007/s007020050003. [DOI] [PubMed] [Google Scholar]
- 9.Niklowitz P, Menke T, Wiesel T, Mayatepek E, Zschocke J, Okun JG, Andler W. Coenzyme Q 10 in plasma and erythrocytes: comparison of antioxidant levels in healthy probands after oral supplementation and in patients suffering from sickle cell anemia. Clinica chimica acta. 2002;326:155–161. doi: 10.1016/s0009-8981(02)00328-5. [DOI] [PubMed] [Google Scholar]
- 10.Schottlaender LV, Bettencourt C, Kiely AP, Chalasani A, Neergheen V, Holton JL, Hargreaves I, Houlden H. Coenzyme Q10 levels are decreased in the cerebellum of multiple-system atrophy patients. PloS one. 2016;11:e0149557. doi: 10.1371/journal.pone.0149557. [DOI] [PMC free article] [PubMed] [Google Scholar]
- 11.Menke T, Niklowitz P, Reinehr T, De Sousa GJ, Andler W. Plasma levels of coenzyme Q10 in children with hyperthyroidism. Hormone Research in Paediatrics. 2004;61:153–158. doi: 10.1159/000075670. [DOI] [PubMed] [Google Scholar]
- 12.Duncan AJ, Heales SJ, Mills K, Eaton S, Land JM, Hargreaves IP. Determination of coenzyme Q10 status in blood mononuclear cells, skeletal muscle, and plasma by HPLC with di-propoxy-coenzyme Q10 as an internal standard. Clinical chemistry. 2005;51:2380–2382. doi: 10.1373/clinchem.2005.054643. [DOI] [PubMed] [Google Scholar]
- 13.Karpińska J, Mikołuć B, Motkowski R, Piotrowska-Jastrzębska J. HPLC method for simultaneous determination of retinol, α-tocopherol and coenzyme Q 10 in human plasma. Journal of pharmaceutical and biomedical analysis. 2006;42:232–236. doi: 10.1016/j.jpba.2006.03.037. [DOI] [PubMed] [Google Scholar]
- 14.Lee BL, Ong CN. Comprehensive high-performance liquid chromatographic method for the measurements of lipophilic antioxidants in human plasma. Journal of Chromatography A. 2009;1216:3131–3137. doi: 10.1016/j.chroma.2009.01.101. [DOI] [PubMed] [Google Scholar]
- 15.Franke AA, Morrison CM, Bakke JL, Custer LJ, Li X, Cooney RV. Coenzyme Q10 in human blood: native levels and determinants of oxidation during processing and storage. Free Radical Biology and Medicine. 2010;48:1610–1617. doi: 10.1016/j.freeradbiomed.2010.03.002. [DOI] [PMC free article] [PubMed] [Google Scholar]
- 16.Nohara Y, Suzuki J, Kubo H. Determination of ubiquinone in blood by high-performance liquid chromatography with post-column fluorescence derivatization using 2-cyanoacetamide. Journal of fluorescence. 2011;21:2093–2100. doi: 10.1007/s10895-011-0908-1. [DOI] [PubMed] [Google Scholar]
- 17.Kishikawa N, Ohkubo N, Ohyama K, Nakashima K, Kuroda N. Selective determination of ubiquinone in human plasma by HPLC with chemiluminescence reaction based on the redox cycle of quinone. Analytical and bioanalytical chemistry. 2011;400:381–385. doi: 10.1007/s00216-011-4662-7. [DOI] [PubMed] [Google Scholar]
- 18.Teshima K, Kondo T. Analytical method for ubiquinone-9 and ubiquinone-10 in rat tissues by liquid chromatography/turbo ion spray tandem mass spectrometry with 1-alkylamine as an additive to the mobile phase. Analytical biochemistry. 2005;338:12–19. doi: 10.1016/j.ab.2004.12.007. [DOI] [PubMed] [Google Scholar]
- 19.Ruiz-Jiménez J, Priego-Capote F, Mata-Granados J, Quesada J, de Castro ML. Determination of the ubiquinol-10 and ubiquinone-10 (coenzyme Q10) in human serum by liquid chromatography tandem mass spectrometry to evaluate the oxidative stress. Journal of chromatography A. 2007;1175:242–248. doi: 10.1016/j.chroma.2007.10.055. [DOI] [PubMed] [Google Scholar]
- 20.Li L, Pabbisetty D, Carvalho P, Avery MA, Avery BA. Analysis of CoQ 10 in rat serum by ultra-performance liquid chromatography mass spectrometry after oral administration. Journal of pharmaceutical and biomedical analysis. 2008;46:137–142. doi: 10.1016/j.jpba.2007.10.019. [DOI] [PubMed] [Google Scholar]
- 21.Duberley KE, Hargreaves IP, Chaiwatanasirikul KA, Heales SJ, Land JM, Rahman S, Mills K, Eaton S. Coenzyme Q10 quantification in muscle, fibroblasts and cerebrospinal fluid by liquid chromatography/tandem mass spectrometry using a novel deuterated internal standard. Rapid Communications in Mass Spectrometry. 2013;27:924–930. doi: 10.1002/rcm.6529. [DOI] [PubMed] [Google Scholar]
- 22.Itkonen O, Suomalainen A, Turpeinen U. Mitochondrial Coenzyme Q10 Determination by Isotope-Dilution Liquid Chromatography–Tandem Mass Spectrometry. Clinical chemistry. 2013;59:1260–1267. doi: 10.1373/clinchem.2012.200196. [DOI] [PubMed] [Google Scholar]
- 23.Tang PH, Miles MV, Miles L, Quinlan J, Wong B, Wenisch A, Bove K. Measurement of reduced and oxidized coenzyme Q 9 and coenzyme Q 10 levels in mouse tissues by HPLC with coulometric detection. Clinica chimica acta. 2004;341:173–184. doi: 10.1016/j.cccn.2003.12.002. [DOI] [PubMed] [Google Scholar]
- 24.Tang Z, Li S, Guan X, Schmitt-Kopplin P, Lin S, Cai Z. Rapid assessment of the coenzyme Q 10 redox state using ultrahigh performance liquid chromatography tandem mass spectrometry. Analyst. 2014;139:5600–5604. doi: 10.1039/c4an00760c. [DOI] [PubMed] [Google Scholar]
- 25.Claessens AJ, Yeung CK, Risler LJ, Phillips BR, Himmelfarb J, Shen DD. Rapid and sensitive analysis of reduced and oxidized coenzyme Q10 in human plasma by ultra performance liquid chromatography-tandem mass spectrometry and application to studies in healthy human subjects. Annals of clinical biochemistry. 2016;53:265–273. doi: 10.1177/0004563215593097. [DOI] [PMC free article] [PubMed] [Google Scholar]
- 26.Schürmann A, Dvorak V, Crüzer C, Butcher P, Kaufmann A. False-positive liquid chromatography/tandem mass spectrometric confirmation of sebuthylazine residues using the identification points system according to EU directive 2002/657/EC due to a biogenic insecticide in tarragon. Rapid Communications in Mass Spectrometry. 2009;23:1196–1200. doi: 10.1002/rcm.3982. [DOI] [PubMed] [Google Scholar]
- 27.Gallart-Ayala H, Nuñez O, Moyano E, Galceran M, Martins CP. Preventing false negatives with high-resolution mass spectrometry: the benzophenone case. Rapid Communications in Mass Spectrometry. 2011;25:3161–3166. doi: 10.1002/rcm.5200. [DOI] [PubMed] [Google Scholar]
- 28.Kaufmann A, Butcher P, Maden K, Walker S, Widmer M. Comprehensive comparison of liquid chromatography selectivity as provided by two types of liquid chromatography detectors (high resolution mass spectrometry and tandem mass spectrometry):”Where is the crossover point?”. Analytica Chimica Acta. 2010;673:60–72. doi: 10.1016/j.aca.2010.05.020. [DOI] [PubMed] [Google Scholar]
- 29.Stoev G, Xuan Y, Peycheva M, Scigelova M. Quantitative assessment of the contribution of high resolution mass spectrometric analysis to the reliability of compound confirmation. Talanta. 2012;98:19–27. doi: 10.1016/j.talanta.2012.06.026. [DOI] [PubMed] [Google Scholar]
- 30.Kumar P, Rúbies A, Centrich F, Granados M, Cortés-Francisco N, Caixach J, Companyó R. Targeted analysis with benchtop quadrupole–orbitrap hybrid mass spectrometer: Application to determination of synthetic hormones in animal urine. Analytica chimica acta. 2013;780:65–73. doi: 10.1016/j.aca.2013.04.017. [DOI] [PubMed] [Google Scholar]
- 31.Henry H, Sobhi HR, Scheibner O, Bromirski M, Nimkar SB, Rochat B. Comparison between a high-resolution single-stage Orbitrap and a triple quadrupole mass spectrometer for quantitative analyses of drugs. Rapid Communications in Mass Spectrometry. 2012;26:499–509. doi: 10.1002/rcm.6121. [DOI] [PubMed] [Google Scholar]
- 32.Alnouti Y, Csanaky IL, Klaassen CD. Quantitative-profiling of bile acids and their conjugates in mouse liver, bile, plasma, and urine using LC–MS/MS. Journal of Chromatography B. 2008;873:209–217. doi: 10.1016/j.jchromb.2008.08.018. [DOI] [PMC free article] [PubMed] [Google Scholar]
- 33.Birch-Machin MA, Turnbull DM. Assaying mitochondrial respiratory complex activity in mitochondria isolated from human cells and tissues. Methods in cell biology. 2001;65:97–117. doi: 10.1016/s0091-679x(01)65006-4. [DOI] [PubMed] [Google Scholar]
- 34.Cipollone M, Fiorentini D, Galli MC, Sechi AM, Landi L. Autoxidation and antioxidant activity of ubiquinol homologues in large unilamellar vesicles. Chemistry and physics of lipids. 1994;69:87–94. doi: 10.1016/0009-3084(94)90030-2. [DOI] [PubMed] [Google Scholar]
- 35.Speck SH, Margoliash E. Characterization of the interaction of cytochrome c and mitochondrial ubiquinol-cytochrome c reductase. Journal of Biological Chemistry. 1984;259:1064–1072. [PubMed] [Google Scholar]
- 36.Hayes R, Ahmed A, Edge T, Zhang H. Core–shell particles: Preparation, fundamentals and applications in high performance liquid chromatography. Journal of Chromatography A. 2014;1357:36–52. doi: 10.1016/j.chroma.2014.05.010. [DOI] [PubMed] [Google Scholar]
- 37.Gritti F, Guiochon G. Performance of columns packed with the new shell Kinetex-C 18 particles in gradient elution chromatography. Journal of Chromatography A. 2010;1217:1604–1615. doi: 10.1016/j.chroma.2010.01.008. [DOI] [PubMed] [Google Scholar]
- 38.U.S.D.o. Health, S. Human. Guidance for industry, bioanalytical method validation. 2001 http://www.fda.gov/cder/guidance/index.htm.
Associated Data
This section collects any data citations, data availability statements, or supplementary materials included in this article.