

Abstract
Mutations in the MATR3 gene encoding the nucleotide binding protein Matrin 3 have recently been identified as causing a subset of familial amyotrophic lateral sclerosis (fALS) and more rarely causing distal myopathy. Translating the identification of MATR3 mutations into an understanding of disease pathogenesis and the creation of mouse models requires a complete understanding of normal Matrin 3 levels and distribution in vivo. Consequently, we examined the levels of murine Matrin 3 in body tissues and regions of the central nervous system. We observed a significant degree of variability in Matrin 3 protein levels among different tissues of adult animals, with the highest levels found in reproductive organs and the lowest in muscle. Within the adult CNS, Matrin 3 levels were lowest in spinal cord. Further, we found that Matrin 3 declines significantly in CNS through early development and young adulthood before stabilizing. As previously reported, antibodies to Matrin 3 primarily stain nuclei; but the intensity of staining was not uniform in all nuclei. The low levels of Matrin 3 in spinal cord and muscle could mean that that these tissues are particularly vulnerable to alterations in Matrin 3 function. Our study is the first to characterize endogenous Matrin 3 in rodents across the lifespan, providing the groundwork for deciphering disease mechanisms and developing mouse models of MATR3-linked ALS.
Keywords: Matrin 3, amyotrophic lateral sclerosis, aging, development, neurodegeneration, RRID: AB525453, RRID: AB11128483, RRID: 151542, SCR_013724
Graphical Abstract
Our study is the first to characterize the endogenous expression of the ALS-associated gene Matrin3 in murine central nervous system. Using immunohistochemistery, we provide evidence for the nuclear localization of Matrin3 and the heterogenous expression of the protein in varying brain regions and spinal cord of an adult mouse.
Introduction
Amyotrophic lateral sclerosis (ALS) is characterized by a progressive loss of upper and lower motor neurons leading to muscle wasting and death, typically due to respiratory failure. This catastrophic collapse of the motor system usually results in death within three to five years of onset (Donaghy 1999).
While the basis of idiopathic ALS has remained elusive, linkage studies of the familial form of disease (fALS) have identified a host of genes that cause the disease when mutated [for reviews see (Leblond, Kaneb et al. 2014)]. The most recent of these is MATR3. An autosomal dominant (S85C) mutation in MATR3 was first identified in a large, multigenerational family, in association with a vocal cord and pharyngeal weakness and distal myopathy with death from respiratory failure after 15 years (Senderek, Garvey et al. 2009). Two additional mutations in MATR3 which segregated with classic ALS in two separate families were discovered by exome sequencing (Johnson, Pioro et al. 2014). An F115C mutation was identified as the cause of a typically aggressive form of ALS which resulted in death within five years of diagnosis in five affected members of an American family, and a T622A mutation was identified in a smaller Italian kindred with three affected individuals (Johnson, Pioro et al. 2014).
In the last several years, the identification of fALS mutations in TARDBP (Sreedharan, Blair et al. 2008), FUS (Kwiatkowski, Bosco et al. 2009; Vance, Rogelj et al. 2009), HNRNPA2B1 and HNRNPA1 (Kim, Kim et al. 2013) has implicated dysfunction of proteins with a primary function in basal RNA metabolism. This has catalyzed RNA biology research in the neurodegenerative disease field and highlighted a hitherto underappreciated role for RNA processing in ALS. Intriguingly, the MATR3 gene encodes a 93kDa protein containing two RNA recognition motifs (RRMs) that are homologous to those found in heterogeneous nuclear ribonucleoprotein L and H (HNRNPL/HNRNPH) (Hibino, Usui et al. 2006). Further supporting a role for the protein in RNA biology, additional studies have identified Matrin 3 in complexes that participate in the retention of hyper-edited RNA in the nucleus (Zhang and Carmichael 2001), miRNA-induced silencing of expression (Hock, Weinmann et al. 2007), the stabilization of mRNAs (Salton, Elkon et al. 2011) and cytoplasmic accumulation and translation of viral mRNA (Kula, Guerra et al. 2011; Yedavalli and Jeang 2011). Matrin 3 was also found to complex in an RNA-dependent manner with HNRNPK and the RNA helicase DHX9 (Salton, Elkon et al. 2011). Typically, RNA binding proteins with multiple functions and substrates have the ability to shuttle between various compartments of the cell, an activity that is dependent on nuclear localization sequences (NLS) and nuclear export sequences (NES) contained within the primary polypeptide sequence (Pinol-Roma and Dreyfuss 1992; Winton, Igaz et al. 2008). Matrin 3 contains both a NLS and NES, and removal of these results in accumulation in the nucleus and cytoplasm, respectively, in vitro (Hibino, Usui et al. 2006; Hisada-Ishii, Ebihara et al. 2007). These findings suggest that endogenous Matrin 3 may have a wide range of activities in various pathways related to RNA metabolism, and that nuclear and cytoplasmic localization may change as part of this activity. Indeed, there is some qualitative evidence in patients with sporadic ALS to suggest that Matrin 3 levels may be increased in neurons and glia, and may be found in small cytoplasmic aggregates (Johnson, Pioro et al. 2014). Importantly, Matrin 3 unambiguously interacts with TDP-43 in cultured cells (Ling, Albuquerque et al. 2010; Salton, Lerenthal et al. 2010), potentially positioning Matrin 3 in the same pathogenic pathways as the principal pathological substrate of ALS.
These findings suggest that studies of Matrin 3 may provide insight into important mechanisms of ALS pathogenesis that extend beyond the smaller subset of MATR3-linked families and into sporadic forms of disease. One of the obvious next steps in understanding the role of MATR3 in both normal and disease states is the development of in vivo models; however, the expression of Matrin 3 remains poorly characterized and very little is known regarding its expression pattern in vivo. In humans, Matrin 3 immunoreactivity has been reported in the nucleus of motor neurons and surrounding glia of the spinal cord (Belgrader, Dey et al. 1991; Johnson, Pioro et al. 2014). It is unknown if this is true for all regions of the brain, or if levels are equivalent across regions. Furthermore, the expression of Matrin 3 during developmental periods and in the aging, vulnerable CNS is poorly understood. Consequently, we analyzed levels of endogenous Matrin 3 in five major organs, the sex organs, and the CNS of adult mice. We also assessed Matrin 3 levels and distribution during postnatal development, adulthood and aging in the murine CNS. Our study provides the first comprehensive assessment of Matrin 3 in multiple CNS structures from early post-natal development onward. This new information that represents a platform from which we can build our understanding of the normal and disease roles of Matrin 3, and will aid investigators in designing animal models of ALS associated with MATR3 mutations.
Materials and Methods
Animal husbandry and tissue harvest
All procedures involving mice were conducted according to the National Institutes of Health guide for animal care and approved by the Institutional and Animal Care and Use Committee (IACUC) at University of Florida. Mice were euthanized by cervical dislocation and brains were immediately removed and hemisected along the sagittal midline. One half was immersion-fixed in 10% formalin for 24 hours and then transferred to PBS for storage at 4°C until processed for immunohistochemical analysis. The remaining half brain was either snap frozen on dry ice and stored at −80°C or micro-dissected to yield the brain regions shown in Figure 1d, followed by snap freezing and storage. For all the animals, the cervical portion of the spinal cord was snap frozen and the remainder of the spinal column was fixed as described above. Figures 1, 2, and 3 contain data obtained from both Swiss Webster (SW) and C57BL6/J (B6) strain mice, Figure 4 contains data from the SW strain only, and Figures 5 and 6 contain data from the B6 strain alone (see Table 1 for a summary of strains and animals per cohort).
Figure 1.

Analysis of Matrin 3 in adult mice. (A) Western blot of Matrin 3 protein in peripheral organs of 4 month old C57BL6/J (B6) mice (N = 4 female, N = 4 male). Arrowhead indicates the band corresponding to full length murine Matrin 3. H = heart, Li = liver, L = lung, K = kidney, S = spleen, M = muscle (gastrocnemius), O = ovary, T = testis (B) Quantification of representative blot in A and three additional replicates (not shown). (C) Identically loaded blots run in parallel and probed with two different antibodies to Matrin 3 from Abcam (left) and Novus (right). Various species of Matrin 3 migrating at ~180kDa, ~115kDa (full length) and ~75kDa detected by both antibodies are labelled. (D) Schematic of brain dissection performed in adult mice. Ob = olfactory bulb, Co = cortex, St = striatum (including striatum and basal ganglia), Hi = hippocampus, Mi = mid region (incorporating midbrain, thalamus and hypothalamus), Cb = cerebellum, Bs = brain stem. Spinal cord is not shown. (E) Representative western blot of indicated regions from B6 mice, arrowhead denotes full length Matrin 3. Upper blot is probed with Matrin 3 antibody, lower is Gapdh. Sc = spinal cord. (F) Quantification of representative blot in E and 2 additional replicates (not shown). (G) Representative western blot of indicated regions from Swiss Webster (SW) mice, arrowhead denotes full length Matrin 3. Upper blot is probed with Matrin 3 antibody, lower is Gapdh. (H) Quantification of representative blot in G and 3 additional replicates (not shown). Loading is normalized to Gapdh within each blot. * p < 0.05, ** p <0.01, *** p <0.001, one way ANOVA, Tukey post-hoc analysis.
Figure 2.

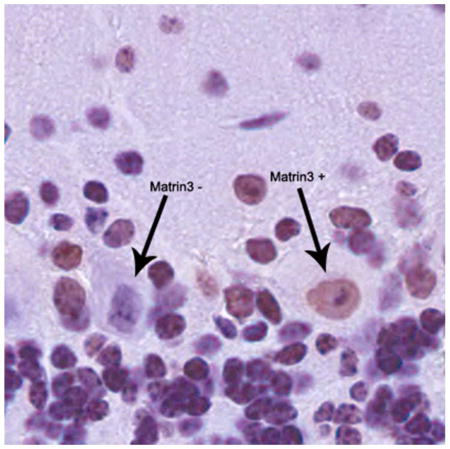
(A) Immunohistochemical staining of four month old B6 male using Matrin 3 antibody supports western blotting data showing Matrin 3 levels throughout the brain. (B) Higher magnification of the cortex demonstrating the heterogeneity of immunostaining between cells. Arrow, example of intensely stained cell; arrowhead, example of a weakly stained cell. The more intensely stained cell is a Betz cell in cortical layer V; note the lack of cytoplasmic staining. (C) Immunohistochemistry using Matrin 3 antibody in the B6 cerebellum (D) Immunohistochemical staining of five month old SW male using Matrin 3 antibody supports western blotting data showing Matrin 3 protein throughout the brain. (E) Higher magnification of the cortex demonstrating the heterogeneity of immunostaining amongst cells. Arrow, intensely stained cell; arrowhead, weakly stained cell. (F) Immunohistochemistry using Matrin 3 antibody in the SW cerebellum. Scale bar is 1mm (A and D). Scale bar is 50μM (B, C, E, and F). In (C) and (F), Matrin 3 positive Purkinje cells (labelled P+) can be seen juxtaposed with weakly stained cells (C, labelled P- in bottom panel) or cells lacking staining (F, labelled P- in bottom panel), while in other areas of the cerebellum, well-stained cells predominate over the poorly stained cells (C and F, top panel).
Figure 3.

Levels of Matrin 3 in developing post-natal mouse brain and spinal cord. (A) Representative western blot of Matrin 3 in whole brain of SW developmental cohort at post-natal day P1, P9, P21, and P37. (B) Densitometric quantification of Matrin 3 protein levels in the brains of cohorts described in blot in A (N = 3 per group). (C) Representative western blot of Matrin 3 in SW spinal cord of the same developmental cohorts. (D) Densitometric quantification of Matrin 3 protein levels in the conditions described in blot shown in C (N = 3 per group). (E) Representative western blot of Matrin 3 in whole brain of B6 developmental cohort at post-natal day P9, P21, and P60. (F) Densitometric quantification of Matrin 3 protein levels in the brains of cohorts described in blot in E (N = 4 per group). (G) Representative western blot of Matrin 3 in B6spinal cord of the same developmental cohorts. (H) Densitometric quantification of Matrin 3 protein levels in the conditions described in blot shown in G. In B, D, F and H, *p < 0.05, **p < 0.01, ***p < 0.001, one-way ANOVA, Tukey post-hoc analysis.
Figure 4.

Localization of Matrin 3 in in post-natal murine CNS. (A–D) Staining of sections at ages P1 (A), P9 (B), P21 (C), and P37 (D) with antibody to Matrin 3 demonstrated widespread Matrin 3 immunoreactivity throughout the brain. Inset shows higher magnification of boxed areas in whole brain section, note the nuclear localization. Arrows denote cells that are more intensely stained for Matrin 3; arrowheads denote examples of weakly stained cells. (E) Immunohistochemical analysis of sections from spinal cords at ages indicated display nuclear immunoreactivity of Matrin 3 in many cells. Arrows and arrowheads again denote strongly and weakly stained cells. Asterisk indicates cells with obvious cytoplasmic staining. Scale bars indicate 3mm in whole brain sections and 50μm for remaining images.
Figure 5.

Aging per se has no effect on Matrin 3 levels in mice. (A) Representative western blots at 1 month, 4 month and 21 months of age in indicated brain regions. Abbreviations correspond to that used in Figure 1. For each brain region, the upper panel corresponds to Matrin 3 and the lower to Gapdh. (B). Quantification of blots described in (A) (for cerebellum and brainstem, N = 3; all others, N = 4 per group). Values are normalized to Gapdh. For each region, average levels for 1 month cohorts were set at an arbitrary value of 1. Arbitrary values across regions are not comparable. Error bars are SEM, * p < 0.05, ** p <0.01, *** p <0.001, one way ANOVA, Tukey post-hoc analysis.
Figure 6.

Aging per se has no effect on Matrin 3 localization in mouse spinal cord. (A) Immunohistochemistry using Matrin 3 antibody shows nuclear localization throughout the lumbar spinal cord of four month old female mice. (C) This pattern is replicated in the spinal cord of twenty-one month old mice. (B & D) Immunohistochemistry using antibody to Matrin 3 demonstrates heterogeneity in level of immunostaining between cells in the ventral horn (arrow denotes high-expressing cell, arrowhead low expressing cell). In A and B, scale bars are 100μM, in C and D, scale bars are 50μM.
Table 1.
Summary of number, sex, and ages of animals in each cohort and the corresponding figures in the study
| Strain | Figure | N | Gender | Age |
|---|---|---|---|---|
| B6 | 1A | N = 4 | Female | 4 months |
| N = 4 | Male | |||
| B6 | 1E & 1F | N = 3 per brain region | Male | 4 months |
| SW | 1G & 1H | N = 4 per brain region | Male | 5 months |
| B6 | 2A–2C | N = 3 | Male | 4 months |
| SW | 2D–2F | N = 4 | Male | 5 months |
| SW | 3A–3D | N = 3 per age | Unknown mix | P1, P9, P21, P37 |
| B6 | 3E–3H | N = 4 per age | Unknown mix | P9, P21, P60 |
| SW | 4 | N = 3 per age | Unknown mix | P1, P9, P21, P37 |
| B6 | 5 | N = 4* for indicated regions | Male | 1, 4, and 21 months |
| 5 | N = 3† for indicated regions | Male | 1, 4, and 21 months | |
| B6 | 6A & 6B | N = 3 | Male | 4 months |
| 6C & 6D | N = 4 | Male | 21 months |
Sc, Hi, Mi, St, Co;
Cb, Bs
Lysate preparation and western blotting
The frozen brain and spinal cord tissue were homogenized in 6 volumes of homogenate buffer [50 mM Tris-HCl pH 7.4, 300 mM NaCl, 5 mM EDTA, 1% Triton, 1x protease inhibitor cocktail (Sigma), and 1x phosphatase inhibitor cocktails I and II (Sigma)] and stored in aliquots at −80°C. For analysis, an aliquot of the homogenate was further diluted to 10 volumes of homogenate buffer and SDS added to a final concentration of 2%. Following centrifugation at 50,000rpm for 20 min at 4°C, the supernatant was collected and protein concentration was determined using BCA protein assay (Pierce). 20μg of protein was resolved on a 3–8% Tris-acetate gel, and transferred to nitrocellulose membrane. The blots were blocked in 5% milk in Tris-buffered saline (TBS) and incubated overnight with Matrin 3 antibody (Novus Biologicals, Cat# NB100-1761, RRID: AB525453; 1:10K; Abcam, Cat# ab151714, RRID: AB11128483, 1:10K) or Gapdh antibody (Meridian Life Sciences, Cat# H86504M, RRID: 151542). Following washes in TBS, blots were incubated with horseradish peroxidase-conjugated anti-rabbit or mouse (1:5000, Jackson Labs, West Grove, PA) for one hour. Protein was detected with ECL (Perkin Elmer) and imaged using the FluorChem E System (ProteinSimple, San Jose, CA). We used Coomassie blue staining of gels to ensure equal protein loading for western analysis of the developmental cohort.
Quantification
Immunoblots for Matrin 3 were quantified using AlphaView SA (ProteinSimple). For analysis of Matrin 3 in peripheral organs and during development, raw values from immunoblots were used in analysis, and all samples were analyzed on the same immunoblot. To analyze Matrin 3 levels in the adult murine peripheral tissue, 20ug of liver lysate was loaded onto each blot to normalize the exposure across blots. In the analysis of Matrin 3 in adult murine brain regions, all regions from a single mouse were analyzed on an individual blot for each mouse strain. 20μg of cortical lysate and 20μg of hippocampal lysate from independent animals were analyzed on either end of the blot to provide a basis for normalizing exposure across blots. This was performed for both Gapdh and Matrin 3, and loading was normalized using Gapdh, to produce the final analysis. For analysis of Matrin 3 in the aging cohorts, all samples were run on the same western blot and Matrin 3 values were normalized to Gapdh. Analysis for all the cohorts was performed using one way ANOVA with Tukey post hoc used to assess significance.
Immunohistochemistry
Spinal cord was dissected from immersion-fixed columns. Both brain and spinal cord were paraffin embedded and cut into 5μm sections, and subsequently deparaffinized in xylene and rehydrated in a descending ethanol gradient. The sections were steamed in 10mM citrate buffer (pH 6.0) containing 0.05% Tween-20 for 30 minutes and cooled to room temperature. Endogenous peroxidase was blocked by immersion for 20 minutes in 0.3% H2O2/PBS. Following thorough washing in PBS, sections were blocked in 10% normal goat serum in PBS-T (0.05% Tween-20), and incubated overnight at 4°C with Matrin 3 antibody from Novus (1:1K in 5% normal goat serum/PBS-T). Subsequently, sections were incubated in biotinylated anti-rabbit antibody (Vector Labs) for 1 hour. The signal was detected with a standard peroxidase ABC system (Vector Labs) with DAB as the chromogen, counterstained with hematoxylin, dehydrated and coverslipped with Cytoseal (Thermo Scientific).
Antibody characterization
The primary antibodies used in this study are detailed in the antibody table.
| Name | Immunogen | Manufacturer, Catalog number, RRID, Host species | Concentration |
|---|---|---|---|
| Matrin 3 | Region between residue 800 and the C-terminus (residue 847) of human Matrin 3 (numbering given in entry NP_061322.2 (GeneID 9782)) | Novus Biologicals, Cat# NB100-1761, RRID: AB525453, rabbit polyclonal | WB: 1:10K, IHC: 1:1000 |
| Matrin 3 | Synthetic peptide within Human Matrin 3 residue 750 to the C-terminus (UniProt: P43243) | Abcam, Cat# ab151714, RRID: AB11128483, mouse monoclonal | WB: 1:10K, IHC: 1:1000 |
| Gapdh | Purified rabbit muscle Gapdh (whole molecule) | Meridian Life Sciences, Cat# H86504M, RRID: 151542, mouse monoclonal | WB: 1:10K |
The Matrin 3 antibody from Abcam is a monoclonal antibody that recognizes a synthetic peptide within human Matrin 3 residue 750 to the C-terminus. Initial characterization of this antibody by Johnson et al. (2014) showed a decrease in Matrin 3 in lysates from HEK293FT cells transfected with siRNA compared to untransfected control. The western blot analysis displayed a band approximately 120 kDa (Johnson, Pioro et al. 2014). We detected a similar size band with the Abcam antibody as well as another Matrin 3 antibody by Novus Biologicals in lysates prepared from mouse liver, cortex, brainstem, and cerebellum. The Novus Matrin 3 antibody is a polyclonal antibody raised to a region between residue 800 and the C-terminus (residue 847) of human Matrin 3. Additionally, Johnson et al. (2014) described nuclear staining patterns with the Abcam antibody in spinal cord motor neurons which we were able to replicate with both antibodies in mouse CNS tissue, supportive of antibody specificity. Lastly, secondary antibody specificity was confirmed with incubation of tissue in the absence of primary that resulted in no immunoreactivity.
Results
Peripheral levels of Matrin 3 are highest in sex organs
Matrin 3 protein has previously been identified in the liver and spinal cord by independent groups using different techniques (Hibino, Usui et al. 2006; Johnson, Pioro et al. 2014). In order to ascertain whether Matrin 3 is ubiquitously present throughout the body, we performed immunoblotting on SDS-soluble fractions of major organs from four month old B6 mice (N = 4 females, N = 4 males). Matrin 3, with a major band running at approximately 115kDa, was broadly expressed in all organs examined; however, there were additional Matrin 3 immunopositive bands of approximately 180kDa and 75kDa (Figure 1a). After using densitometry to quantify the major band, we performed a one way ANOVA to compare Matrin 3 levels across tissue type within a single sex. Levels of Matrin 3 in the reproductive organ (ovary or testes) were significantly higher than most other peripheral tissue examined within that sex (Table 2). Qualitatively, the muscle expressed the lowest levels of Matrin 3 in comparison to all other organs in both sexes; however, this difference was only significant when compared to ovary or testes (Figures 1a, b; Table 2). To determine if there were any differences within tissue but across sex, we performed a 2-tailed t-test and did not see a statistically significant difference within each tissue type when compared across sex.
Table 2.
Summary of significant differences in Matrin 3 expression measured in peripheral organs of C57BL6/J mice. A. One-way ANOVA of the densitometry of normalized Matrin 3 expression in peripheral organs of 4 month old female B6 mice (N = 4). B. One-way ANOVA of the densitometry of normalized Matrin 3 expression in peripheral organs of 4 month old male B6 mice (N = 4).
| A. | Female
|
B. | Male
|
||
|---|---|---|---|---|---|
| Tukey’s multiple comparison test | P Value | Tukey’s multiple comparison test | P Value | ||
|
|
|
||||
| Heart v. Ovary | P < 0.01 | Heart v. Testis | P < 0.001 | ||
| Lung v. Ovary | P < 0.05 | Liver v. Testis | P < 0.001 | ||
| Kidney v. Ovary | P < 0.01 | Lung v. Testis | P < 0.001 | ||
| Muscle v. Ovary | P < 0.01 | Kidney v. Testis | P < 0.001 | ||
| Spleen v. Testis | P < 0.001 | ||||
| Muscle v. Testis | P < 0.001 | ||||
In order to determine if the additional Matrin 3 immunopositive species in our peripheral studies may be due to non-specific binding on the part of the antibody utilized (Novus biologicals NB100-1761), we employed a second antibody (Abcam ab151714) to probe identically loaded and treated immunoblots in parallel (Figure 1c). Immunopositive bands at 115kDa, 180kDa, and 75kDa were identified with both antibodies in all tissues examined, suggesting that the additional species were unlikely to be due to non-specific recognition of another protein. Given the similarity in staining between the two antibodies, we continued the remainder of our studies with the Matrin 3 antibody from Novus (Novus biologicals NB100-1761).
Disparate levels of Matrin 3 within the adult murine CNS
Focusing on the CNS, we investigated the possibility that Matrin 3 level varies between neuroanatomical regions. Consequently, we microdissected the brain of four month old B6 and five month old SW mice (Figure 1d; B6 males, N = 3; SW males, N = 4) and performed immunoblotting on SDS-soluble fractions. Matrin 3 was variable across regions of the CNS (Figures 1e–1h). Specifically, in the B6 cohort, Matrin 3 within the olfactory bulb was significantly higher relative to spinal cord, brainstem, and midbrain (Figure 1f, all regions p < 0.05; one way ANOVA, Tukey post hoc analysis). Qualitatively, the majority of the brain regions display a higher level than the spinal cord; however, the cerebellum was the only other structure with statistically higher levels than the spinal cord within this cohort (Figure 1f, cerebellum p < 0.05; one way ANOVA, Tukey post hoc analysis). In general, the pattern of Matrin 3 was qualitatively similar between our studies on B6 mice and those on SW mice. Similar to B6, the SW cohort showed higher Matrin 3 in the olfactory bulb in comparison to spinal cord, brainstem, and midbrain, but Matrin 3 in the olfactory bulb was also significantly higher than in the hippocampus, striatum, and cortex (Figure 1h; spinal cord, brainstem, hippocampus, midbrain, p < 0.001; striatum, cortex, p < 0.01; one way ANOVA, Tukey post hoc analysis). As also observed in the B6 cohort, Matrin 3 in the cerebellum of the SW cohort was statistically higher than in the spinal cord; however, Matrin 3 in the cerebellum was also significantly higher than in the brainstem and midbrain (spinal cord, p < 0.001; brainstem, p < 0.05; midbrain p < 0.01; one way ANOVA, Tukey post hoc analysis). Given the susceptibility of the spinal cord to degeneration in ALS, we were surprised to note the relatively low level of Matrin 3 in this tissue, in both strains of mice, compared to other regions of the CNS.
To confirm the results of our immunoblotting analysis and to provide a greater understanding of subcellular localization of Matrin 3, we also performed immunohistochemical analysis on brain sections from four month old B6 (Figure 2a–c) and five month old SW (Figure 2d–f) mice using the Novus antibody. Consistent with our western blot findings, Matrin 3 immunoreactivity was detected in every region of the brain (Figures 2a and 2d). Upon closer examination, we determined that Matrin 3 immunostaining was not equivalent in all cells, with some cells immunostaining more intensely than others (Figures 2b and 2e). In all cases, Matrin 3 localization was nuclear and we failed to detect any cytoplasmic staining in the brain. This pattern of localization was the case even in large cells such as Betz cells in the motor cortex (Figures 2b and 2e) and Purkinje cells (PCs) of the cerebellum (Figures 2c and 2f) which have a more visible cytoplasm than smaller neurons and glia. In the case of PCs, we frequently observed heterogeneous Matrin 3 immunostaining in this ‘homogeneous’ cell population. Matrin 3 positive PCs repeatedly neighbored other Purkinje neurons that were completely devoid of immunostaining or displayed low levels of the protein (Figures 2c and 2f). In some regions, Matrin 3 positive PCs predominated (Figures 2c and 2f, upper panel), whilst in others, large numbers of cells were negative (Figures 2c and 2f, lower panel).
Level of Matrin 3 decreases in the murine CNS during post-natal development
We characterized Matrin 3 levels throughout post-natal development with immunoblot analysis on hemi-brain and spinal cord tissue from naïve SW mice at post-natal day one (P1), nine (P9), twenty-one (P21), and thirty-seven (P37). An antibody for Matrin 3 detected a band of approximately 115 kDa in total brain lysate (Figure 3a). From P1 to P37, we observed a progressive reduction in levels of Matrin 3 in the brain (Figure 3a and 3b). Compared to P1, Matrin 3 levels at P21 and P37 were approximately 1.5-fold and 2.5-fold lower respectively (Figure 3b, N = 3 per group. P1 v P21, p < 0.05; P1 v P37, p < 0.01, one way ANOVA, Tukey post hoc). This association of decreased Matrin 3 with post-natal maturation was replicated in the spinal cord (Figure 3c) in which we found approximately 6- and 11-fold decrease in levels of Matrin 3 in P21 and P37 respectively when compared to P1 levels (Figures 3c and 3d, P1 v P21 and P1 v P37, p < 0.05, one way ANOVA, Tukey post hoc). To determine if Matrin 3 declined similarly through post-natal development in a second strain (B6) of mice and to extend the post-natal window in which we performed the analysis, we ran immunoblots on hemi-brain and spinal cord lysates from B6 mice at post-natal day nine (P9), twenty one (P21), and sixty (P60). Similar to the SW cohort, we detected an 115kDa band in both brain and spinal cord lysates (Figure 3e and 3g, N = 4 per group). Additionally, we saw the progressive decrease in Matrin 3 in the B6 tissues similar to the SW cohort, with a significant decrease of Matrin 3 from P9 to P21 and P60 as well as P21 to P60 in the brain (Figures 3e and 3f, P9 v P21 and P21 v P60, p < 0.05; P9 v P60, p < 0.01; one way ANOVA, Tukey post hoc analysis) and a significant decrease in the spinal cord between P9 to P21 and P60 and P21 to P60 (Figures 3g and 3h, P9 v P21 and P9 v P60, p < 0.001; P21 v P60, p < 0.05; one way ANOVA, Tukey post hoc analysis).
Nuclear and cytoplasmic localization of Matrin 3 during postnatal CNS development
Matrin 3 was first identified in rat liver as a component of the nuclear matrix, which is thought to provide structural support for proper nuclear function (Belgrader, Dey et al. 1991; Nakayasu and Berezney 1991). Recently, Johnson et al. showed nuclear localization of Matrin 3 in neurons and glia of human spinal cord sections (Johnson, Pioro et al. 2014). Our visualization of Matrin 3 immunoreactivity showed a similar preponderance of nuclear localization throughout the brain at all ages that we examined (Figure 4a–d). However, the intensity of immunostaining was heterogeneous, with high- and low- intensity staining for Matrin 3 apparent (arrows and arrowheads, respectively, Figure 4a–d insets) which mirrored our findings in 4–5 month old mice (Figure 2). Immunostaining for Matrin 3 in the spinal cord was also heterogeneous between cells (Figure 4e); however, Matrin 3 localization extended to the cytoplasm in a minority of cells of the spinal cord of post-natal mice (asterisk, inset in Figure 4e). In both brain and spinal cord, we found no evidence that post-natal age, alone, alters the general localization of Matrin 3 within the cell during development. We performed the same immunohistochemical analysis on sections from B6 mice at P9, P21, and P60 and obtained similar results (data not shown).
Aging per se has no effect on Matrin 3 levels or localization
As aging remains the greatest known risk factor for the development of ALS as an adult, and Matrin 3 may be increased in sporadic forms of the disease (Johnson, Pioro et al. 2014), we sought to determine if there might be changes in the levels or localization of Matrin 3 during aging. To evaluate this possibility, we analyzed Matrin 3 levels by immunoblot in numerous CNS structures of three cohorts of male B6 mice aged to one, four and twenty-one months of age (Figure 5a). We observed significant reductions in the levels of Matrin 3 between the ages of one and four months of age in spinal cord, hippocampus, ventral mid brain (incorporating midbrain, thalamus and hypothalamus) and striatum (Figure 5b, spinal cord p < 0.01; hippocampus p < 0.05; mid region p < 0.05; striatum p < 0.001; one way ANOVA, Tukey post-hoc analysis). Matrin 3 levels did not significantly decline in any tissue examined between four and twenty-one months of age, indicating that the reduction in Matrin 3 levels occurs early in life.
We also considered whether subcellular distribution of Matrin 3 may change with aging, given that this has been proposed to be a pathological feature of sporadic ALS (Johnson, Pioro et al. 2014). To examine this possibility, we conducted immunohistochemistry using an antibody to Matrin 3 on the brains (not shown) and spinal cord of four and twenty-one month old animals described above. We found extensive staining in the ventral horn of the spinal cord of four month mice (Figure 6a). Under closer examination, there was again heterogeneity in immunostaining intensity amongst cells, but the location of staining was nuclear (Figure 6b). We found identical staining in the spinal cords of twenty-one month old mice (Figure 6c and 6d). Similar results were obtained in SW mice in the oldest ages examined, four month and twelve month (data not shown).
Discussion
Mutations in MATR3 are responsible for a subset of familial ALS cases (Johnson, Pioro et al. 2014); however, the pathogenic process associated with these mutations is unknown. In the current report, we have attempted to characterize normal Matrin 3 expression to provide fundamental knowledge required to ultimately understand the pathogenicity of MATR3 mutations and to provide a basis for creating rodent models of MATR3-linked ALS. Through this analysis, we identified the presence of three Matrin 3 immunopositive bands on immunoblots, migrating at approximate molecular weights of 180kDa, 115kDa and 75kDa. The major band of the three runs at 115kDa and likely corresponds to the full length protein, which has a predicted molecular weight of 95kDa. Although it is unknown why the full-length polypeptide fails to run at this molecular weight, this has been observed consistently elsewhere (Hibino, Usui et al. 2006; Johnson, Pioro et al. 2014). The identity of the 180kDa and 75kDa species and their functionality or role in normal and disease biology remains unknown.
In adult mice, we observed Matrin 3 was found throughout all peripheral tissues tested in both SW and B6. This widespread pattern suggests that Matrin 3 may be important in processes common across these tissues, which is congruent with evidence to date of a role in the metabolism of RNA species and attachment to DNA architecture. Matrin 3 levels were quantitatively lower in the muscle compared to other peripheral tissues, though it was only significantly lower when compared to the reproductive organs. Furthermore, Matrin 3 was consistently low in the spinal cord; however, it was only significantly lower when compared to the cerebellum and olfactory bulbs in both B6 and SW. Interestingly, the muscle and spinal cord are regions that are critically affected in distal myopathy and ALS, diseases to which MATR3 mutations have been linked. Studies aimed at determining whether muscle and spinal cord levels of Matrin 3 are lower relative to other tissues in humans may be rewarding, yet might be technically difficult given the low abundance of high quality, post mortem tissue. If Matrin 3 levels are normally low in adult muscle and spinal cord, it may sensitize these structures to changes in the levels of functional Matrin 3, which could be diminished by the mutations associated with these diseases (Johnson, Pioro et al. 2014).
During the course of these studies, we found heterogeneity in immunostaining levels and predominantly nuclear localization of Matrin 3 at all ages examined. Cells exhibiting high and low immunostaining intensity were apparent, suggesting that Matrin 3 is not regulated in all cells in the same manner, which may have consequences for the interpretation of disease mechanism(s) or therapeutic endeavors. We were surprised to find variation in Matrin 3 immunostaining within a single ‘cell type’. We observed Matrin 3 positive and Matrin 3 negative Purkinje cells of the cerebellum juxtaposed with one another. This finding adds to other studies that have revealed heterogeneity in the proteome of PCs (Shimizu-Albergine, Rybalkin et al. 2003), adding to a growing appreciation for the diversity within this cell type (Zhou, Voges et al. 2015). Although there was heterogeneity in the intensity of immunostaining, the preponderance of staining for Matrin 3 was observed in the nucleus, with only rare examples of cytoplasmic staining in spinal cord.
We were also interested in potential changes in Matrin 3 levels during development, and found a significant decrease in levels in both the brain and spinal cord during the initial postnatal time period. Although the dynamic range of immunohistochemistry is not as great as immunoblotting, we did not detect obvious changes in regional distribution, as immunostaining with a Matrin 3 antibody demonstrated immunosignal throughout the brain at all timepoints. These findings may be indicative of a decreased requirement for Matrin 3 function as development of the CNS reaches maturity, and may implicate Matrin 3 function in developmental pathways. Indeed, it has recently been demonstrated that Matrin 3 is expressed in the neural crest and that de facto Matrin 3 knock out mice are embryonic lethal (Quintero-Rivera, Xi et al. 2015). This information may have important consequences for the development of murine models of disease that utilize mutant Matrin 3 expression. Previously, we and others in the field attempted to create mouse models of TDP-43-linked ALS; however, the phenotypes in some of these lines occurred in early postnatal stages, complicating any interpretation of disease relevant phenomena (Wils, Kleinberger et al. 2010; Xu, Gendron et al. 2010; Xu, Zhang et al. 2011; Cannon, Yang et al. 2012; Janssens, Wils et al. 2013). It may be important to interpret any biochemical, pathological or behavioral phenotype derived from the overexpression of exogenous Matrin 3 in the early postnatal period within the context of declining levels of endogenous Matrin 3. We also did not find significant alterations in the intracellular distribution of Matrin 3 across developmental age points.
In contrast to these findings from early in the life span, we identified no alterations in the levels of Matrin 3 in aged, twenty one month old mice compared to the four month old cohort. We did observe significant reductions in Matrin 3 levels between the ages of one and four months. However, given our findings from the immediate postnatal period, we believe that these reductions likely represent the effects of residual developmental processes which have yet to fully cease at one month of age. Furthermore, we found no change in the intracellular localization of Matrin 3. Clearly, murine and human genetics differ considerably, as do the environments that each species encounters during life; however, aging per se had no effect on either the levels or cellular distribution of Matrin 3, even in relatively old cohorts of mice.
The discovery of ALS-linked mutations in a gene has typically catalyzed research into the function of the translated protein and potential pathogenic mechanisms underlying disease. This is sure to be the case for Matrin 3. Here, we have laid some of the foundational groundwork for subsequent research by determining Matrin 3 levels and distribution in the CNS of mice at a variety of different points in the lifespan. Our findings are likely to have important ramifications for the understanding of disease and the interpretation of in vivo experiments.
Acknowledgments
Funded by the McKnight Brain Institute, Department of Neuroscience, CTRND at UF to J.L. and D.R.B, the SantaFe Alzheimer’s Center to D.R.B. and the Wilder Foundation to S.D., and T32 Predoctoral Interdisciplinary Training in Movement Disorders and Neurorestoration (NIH T32-NS082128)
Footnotes
Conflict of Interest
The authors claim no conflict of interest.
Role of authors
All authors had full access to all the data in the study and take responsibility for the integrity of the data and the accuracy of the data analysis. Study concept and design: JL, DRB, SD, SR. Acquisition of data: SR, SD, KC, CM, JH, CD, MC, ZS, CGI, ARH. Analysis and interpretation of data: SR, SD. Drafting of the manuscript: SR, SD. Critical revision of the manuscript for important intellectual content: JL, DRB. Statistical analysis: SR, SD. Obtained funding: JL, DRB. Administrative, technical, and material support: JH
Literature cited
- Belgrader P, Dey R, et al. Molecular cloning of matrin 3. A 125-kilodalton protein of the nuclear matrix contains an extensive acidic domain. J Biol Chem. 1991;266(15):9893–9899. [PubMed] [Google Scholar]
- Cannon A, Yang B, et al. Neuronal sensitivity to TDP-43 overexpression is dependent on timing of induction. Acta Neuropathol. 2012;123(6):807–823. doi: 10.1007/s00401-012-0979-3. [DOI] [PMC free article] [PubMed] [Google Scholar]
- Donaghy M. Classification and clinical features of motor neurone diseases and motor neuropathies in adults. J Neurol. 1999;246(5):331–333. doi: 10.1007/s004150050358. [DOI] [PubMed] [Google Scholar]
- Hibino Y, Usui T, et al. Molecular properties and intracellular localization of rat liver nuclear scaffold protein P130. Biochim Biophys Acta. 2006;1759(5):195–207. doi: 10.1016/j.bbaexp.2006.04.010. [DOI] [PubMed] [Google Scholar]
- Hisada-Ishii S, Ebihara M, et al. Bipartite nuclear localization signal of matrin 3 is essential for vertebrate cells. Biochem Biophys Res Commun. 2007;354(1):72–76. doi: 10.1016/j.bbrc.2006.12.191. [DOI] [PubMed] [Google Scholar]
- Hock J, Weinmann L, et al. Proteomic and functional analysis of Argonaute-containing mRNA-protein complexes in human cells. EMBO Rep. 2007;8(11):1052–1060. doi: 10.1038/sj.embor.7401088. [DOI] [PMC free article] [PubMed] [Google Scholar]
- Janssens J, Wils H, et al. Overexpression of ALS-associated p.M337V human TDP-43 in mice worsens disease features compared to wild-type human TDP-43 mice. Mol Neurobiol. 2013;48(1):22–35. doi: 10.1007/s12035-013-8427-5. [DOI] [PMC free article] [PubMed] [Google Scholar]
- Johnson JO, Pioro EP, et al. Mutations in the Matrin 3 gene cause familial amyotrophic lateral sclerosis. Nat Neurosci. 2014;17(5):664–666. doi: 10.1038/nn.3688. [DOI] [PMC free article] [PubMed] [Google Scholar]
- Kim HJ, Kim NC, et al. Mutations in prion-like domains in hnRNPA2B1 and hnRNPA1 cause multisystem proteinopathy and ALS. Nature. 2013;495(7442):467–473. doi: 10.1038/nature11922. [DOI] [PMC free article] [PubMed] [Google Scholar]
- Kula A, Guerra J, et al. Characterization of the HIV-1 RNA associated proteome identifies Matrin 3 as a nuclear cofactor of Rev function. Retrovirology. 2011;8:60. doi: 10.1186/1742-4690-8-60. [DOI] [PMC free article] [PubMed] [Google Scholar]
- Kwiatkowski TJ, Jr, Bosco DA, et al. Mutations in the FUS/TLS gene on chromosome 16 cause familial amyotrophic lateral sclerosis. Science. 2009;323(5918):1205–1208. doi: 10.1126/science.1166066. [DOI] [PubMed] [Google Scholar]
- Leblond CS, Kaneb HM, et al. Dissection of genetic factors associated with amyotrophic lateral sclerosis. Exp Neurol. 2014;262(Pt B):91–101. doi: 10.1016/j.expneurol.2014.04.013. [DOI] [PubMed] [Google Scholar]
- Ling SC, Albuquerque CP, et al. ALS-associated mutations in TDP-43 increase its stability and promote TDP-43 complexes with FUS/TLS. Proc Natl Acad Sci U S A. 2010;107(30):13318–13323. doi: 10.1073/pnas.1008227107. [DOI] [PMC free article] [PubMed] [Google Scholar]
- Nakayasu H, Berezney R. Nuclear matrins: identification of the major nuclear matrix proteins. Proc Natl Acad Sci U S A. 1991;88(22):10312–10316. doi: 10.1073/pnas.88.22.10312. [DOI] [PMC free article] [PubMed] [Google Scholar]
- Pinol-Roma S, Dreyfuss G. Shuttling of pre-mRNA binding proteins between nucleus and cytoplasm. Nature. 1992;355(6362):730–732. doi: 10.1038/355730a0. [DOI] [PubMed] [Google Scholar]
- Quintero-Rivera F, Xi QJ, et al. MATR3 disruption in human and mouse associated with bicuspid aortic valve, aortic coarctation and patent ductus arteriosus. Hum Mol Genet. 2015;24(8):2375–2389. doi: 10.1093/hmg/ddv004. [DOI] [PMC free article] [PubMed] [Google Scholar]
- Salton M, Elkon R, et al. Matrin 3 binds and stabilizes mRNA. PLoS One. 2011;6(8):e23882. doi: 10.1371/journal.pone.0023882. [DOI] [PMC free article] [PubMed] [Google Scholar]
- Salton M, Lerenthal Y, et al. Involvement of Matrin 3 and SFPQ/NONO in the DNA damage response. Cell Cycle. 2010;9(8):1568–1576. doi: 10.4161/cc.9.8.11298. [DOI] [PubMed] [Google Scholar]
- Senderek J, Garvey SM, et al. Autosomal-dominant distal myopathy associated with a recurrent missense mutation in the gene encoding the nuclear matrix protein, matrin 3. Am J Hum Genet. 2009;84(4):511–518. doi: 10.1016/j.ajhg.2009.03.006. [DOI] [PMC free article] [PubMed] [Google Scholar]
- Shimizu-Albergine M, Rybalkin SD, et al. Individual cerebellar Purkinje cells express different cGMP phosphodiesterases (PDEs): in vivo phosphorylation of cGMP-specific PDE (PDE5) as an indicator of cGMP-dependent protein kinase (PKG) activation. J Neurosci. 2003;23(16):6452–6459. doi: 10.1523/JNEUROSCI.23-16-06452.2003. [DOI] [PMC free article] [PubMed] [Google Scholar]
- Sreedharan J, I, Blair P, et al. TDP-43 mutations in familial and sporadic amyotrophic lateral sclerosis. Science. 2008;319(5870):1668–1672. doi: 10.1126/science.1154584. [DOI] [PMC free article] [PubMed] [Google Scholar]
- Vance C, Rogelj B, et al. Mutations in FUS, an RNA processing protein, cause familial amyotrophic lateral sclerosis type 6. Science. 2009;323(5918):1208–1211. doi: 10.1126/science.1165942. [DOI] [PMC free article] [PubMed] [Google Scholar]
- Wils H, Kleinberger G, et al. TDP-43 transgenic mice develop spastic paralysis and neuronal inclusions characteristic of ALS and frontotemporal lobar degeneration. Proc Natl Acad Sci U S A. 2010;107(8):3858–3863. doi: 10.1073/pnas.0912417107. [DOI] [PMC free article] [PubMed] [Google Scholar]
- Winton MJ, Igaz LM, et al. Disturbance of nuclear and cytoplasmic TAR DNA-binding protein (TDP-43) induces disease-like redistribution, sequestration, and aggregate formation. J Biol Chem. 2008;283(19):13302–13309. doi: 10.1074/jbc.M800342200. [DOI] [PMC free article] [PubMed] [Google Scholar]
- Xu YF, Gendron TF, et al. Wild-type human TDP-43 expression causes TDP-43 phosphorylation, mitochondrial aggregation, motor deficits, and early mortality in transgenic mice. J Neurosci. 2010;30(32):10851–10859. doi: 10.1523/JNEUROSCI.1630-10.2010. [DOI] [PMC free article] [PubMed] [Google Scholar]
- Xu YF, Zhang YJ, et al. Expression of mutant TDP-43 induces neuronal dysfunction in transgenic mice. Mol Neurodegener. 2011;6:73. doi: 10.1186/1750-1326-6-73. [DOI] [PMC free article] [PubMed] [Google Scholar]
- Yedavalli VS, Jeang KT. Matrin 3 is a co-factor for HIV-1 Rev in regulating post-transcriptional viral gene expression. Retrovirology. 2011;8:61. doi: 10.1186/1742-4690-8-61. [DOI] [PMC free article] [PubMed] [Google Scholar]
- Zhang Z, Carmichael GG. The fate of dsRNA in the nucleus: a p54(nrb)-containing complex mediates the nuclear retention of promiscuously A-to-I edited RNAs. Cell. 2001;106(4):465–475. doi: 10.1016/s0092-8674(01)00466-4. [DOI] [PubMed] [Google Scholar]
- Zhou H, Voges K, et al. Differential Purkinje cell simple spike activity and pausing behavior related to cerebellar modules. J Neurophysiol. 2015;113(7):2524–2536. doi: 10.1152/jn.00925.2014. [DOI] [PMC free article] [PubMed] [Google Scholar]