Abstract
Background
Operating room slowdowns occur at specific intervals in the year as a cost-saving measure. We aim to investigate the impact of these slowdowns on the care of oral cavity cancer patients at a Canadian tertiary care centre.
Methods
A total of 585 oral cavity cancer patients seen between 1999 and 2015 at the London Health Science Centre (lhsc) Head and Neck Multidisciplinary Clinic were included in this study. Operating room hours and patient load from 2006 to 2014 were calculated. Our primary endpoint was the wait time from consultation to definitive surgery. Exposure variables were defined according to wait time intervals occurring during time periods with reduced operating room hours.
Results
Overall case volume rose significantly from 2006 to 2014 (p < 0.001), while operating room hours remained stable (p = 0.555). Patient wait times for surgery increased from 16.3 days prior to 2003 to 25.5 days in 2015 (p = 0.008). Significant variability in operating room hours was observed by month, with lowest reported for July and August (p = 0.002). The greater the exposure to these months, the more likely patients were to wait longer than 28 days for surgery (odds ratio per day [or]: 1.07, 95% confidence interval [ci]: 1.05 to 1.10, p < 0.001). Individuals seen in consultation preceding a month with below average operating room hours had a higher risk of disease recurrence and/or death (hazard ratio [hr]: 1.59, 95% ci: 1.10 to 2.30, p = 0.014).
Conclusions
Scheduled reductions in available operating room hours contribute to prolonged wait times and higher disease recurrence. Further work is needed to identify strategies maximizing efficient use of health care resources without negatively affecting patient outcomes.
Keywords: Oral cancer, wait times, resources
INTRODUCTION
Head and neck cancer (hnc) has not gained the public awareness of other more common adult solid tumours, yet it remains a formidable public health problem. It is the fifth most common cancer worldwide, accounting for approximately 500,000 cases per annum, and 4,500 cases in Canada1–3. Unfortunately, both the disease process and current treatment strategies can have a profound negative impact on patient quality of life, due to difficulty eating and speaking, as well as possible disfigurement. Survival rates for hnc continue to be poor, with fewer than 50% of patients with advanced disease alive at five years4.
Across Canada, wait times for cancer diagnosis and treatment remain an obstacle to optimal patient care. Previous studies have demonstrated that surgical wait times may influence survival outcomes in uterine and bladder cancers, respectively5,6. A landmark investigation by Van Harten et al.7 in the Netherlands showed that longer wait times for head and neck cancer surgery were associated with a higher risk of death; the hazard of dying increased by 7% for each week waited for treatment. Longer wait times for cancer surgery put patients not only at risk of increased morbidity due to larger resections secondary to tumour progression7, but also at increased risk of mortality. Thus, strategies to ensure prompt treatment are crucial to obtain optimal patient outcomes.
In Canada, frequently cited barriers to timely hnc care include delay in referrals from primary care physicians to community otolaryngologists and, subsequently, delays in referral from these specialists to head and neck surgical oncologists. However, another barrier often cited has been lack of operating room time8. Cancer Care Ontario (cco) guidelines for hnc treatment include a target wait time of 28 days from specialist consult to treatment for surgery. Despite this, cco has reported that only 83% of hnc patients receive treatment within this time frame9. Data from the Maritime provinces has revealed even longer wait times10, suggesting that this may be a nationwide problem.
To reduce costs, many Canadian tertiary care centres reduce the operating room (or) hours available to surgeons during specific periods in the year, typically in the summer months and over the Christmas holidays. Despite this wide-spread practice, there is a paucity of data studying the impact of these slowdown periods on surgical wait times and patient outcomes. We examined these outcomes for oral cavity cancer patients at a large, tertiary-care institution.
METHODS
Patient Population
Of all oral cavity cancer patients seen in consultation between January 1999 and December 2015 at the London Health Science Centre (lhsc) Head and Neck Cancer Multidisciplinary Clinic (hn mdt clinic) patients who met the following inclusion criteria were included in our analysis: diagnosis of a primary oral cavity squamous cell carcinoma, cancer treated with primary surgery with or without adjuvant therapy, surgery and adjuvant therapy provided at lhsc. Patients with inadequate electronic or paper records were excluded.
Patient demographic data (Table I), date of consultation, date of surgery, and date of adjuvant radiotherapy initiation were extracted by retrospective chart review. Operating room hours for all head and neck surgical oncologists were tabulated from Department of Otolaryngology – Head and Neck Surgery records for the same time period. In addition, we tabulated the total number of hnc patients referred to our Multidisciplinary Clinic between 2006 and 2014.
TABLE I.
Baseline tumour, patient and treatment characteristics for all patients (n=585)
| Characteristic | N | Patients (n=585) |
|---|---|---|
| Age at Diagnosis – mean ± SD, median (min, max) | 585 | 62.8 ± 12.4 |
| 63.0 (22.0, 95.0) | ||
| Stage – n (%) | 525 | |
| I | 125 (23.8) | |
| II | 98 (18.7) | |
| III | 77 (14.7) | |
| IV | 225 (42.9) | |
| T Stage – n (%) | 585 | |
| T1 | 204 (34.9) | |
| T2 | 183 (31.3) | |
| T3 | 55 (9.4) | |
| T4 | 143 (24.4) | |
| N Stage – n (%) | 585 | |
| N0 | 314 (53.7) | |
| N1 | 78 (13.3) | |
| N2 | 122 (20.9) | |
| N3 | 6 (1.0) | |
| NX | 65 (11.1) | |
| Location – n (%) | 585 | |
| Tongue | 276 (47.2) | |
| Palate | 23 (3.9) | |
| Cheek/Buccal/Mucosa | 63 (10.8) | |
| Floor of Mouth | 102 (17.4) | |
| Mandible/Gingiva/Alveolus | 94 (16.1) | |
| Retromolar Trigone | 27 (4.6) |
Statistical Analysis
The primary end point of interest was wait time from the date of consultation to the date of definitive surgery. Exposure variables were defined according to wait time intervals occurring during time periods (or months) with reduced or hours. Each time period (or month) was classified according to whether the total or hours was: (1) below the overall mean (“below mean”), (2) below the overall mean minus 10% (“below mean – 10%”), and (3) during the summer months of July or August. Total or hours were examined over time and grouped by month to investigate seasonal trends. Trend tests were performed to test for increases in wait time over time using the linear trend test for wait time as a continuous variable. Multivariable logistic regression and Cox proportional hazards regression were performed to identify significant (p < 0.05) predictors of wait times > 28 days and overall and progression-free survival, respectively. All variables with available data for > 70% of patients (e.g., n > 410) were entered into a multivariable model and sequentially removed using backward elimination techniques until all remaining covariates had p < 0.10. For overall survival (os) and progression-free survival (pfs), wait time (as a continuous variable) was retained during all stages of model building in an effort to reduce bias. All statistical analysis was performed using SAS version 9.4 (SAS institute, Cary, NC, U.S.A.), using two-sided statistical testing at the 0.05 significance level.
RESULTS
Head and Neck Cancer Case Numbers and Surgical Oncology Time
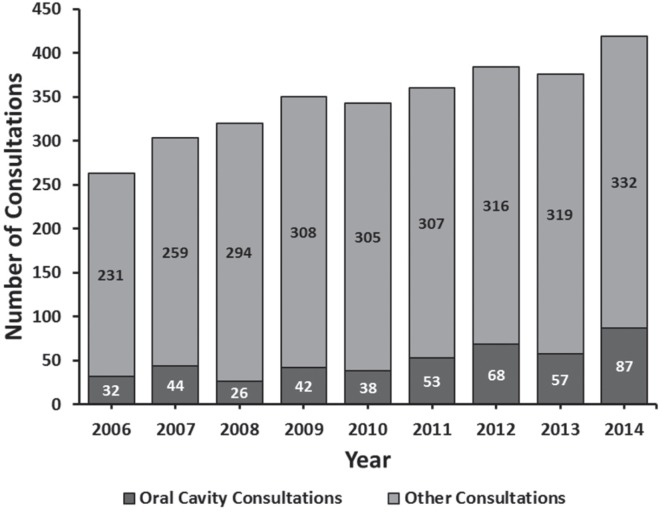
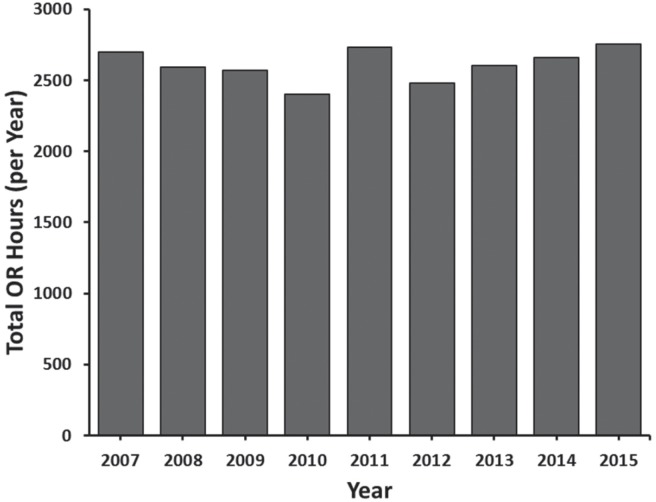
The overall case volume rose dramatically, from 263 cases in 2006 to 419 cases in 2014, with an average increase of 16.4 patients per year (p < 0.001) (Figure 1). Both the absolute number and the proportion of oral cavity cancer patients also increased significantly (p = 0.004 and p < 0.001, respectively). Conversely, during this time period the number of or hours available to our surgeons remained stable (p = 0.555) (Figure 2).
FIGURE 1.
Number of head and neck cancer consultations from 2006 to 2014. Stacked bars represent the entire patient cohort per year, including number of oral cavity cases (light) and cases from all other sites (dark).
FIGURE 2.
Annual operating room hours available for head and neck surgical oncology at London Health Sciences Centre. OR = operating room.
Wait Times to Surgery and Adjuvant Radiotherapy
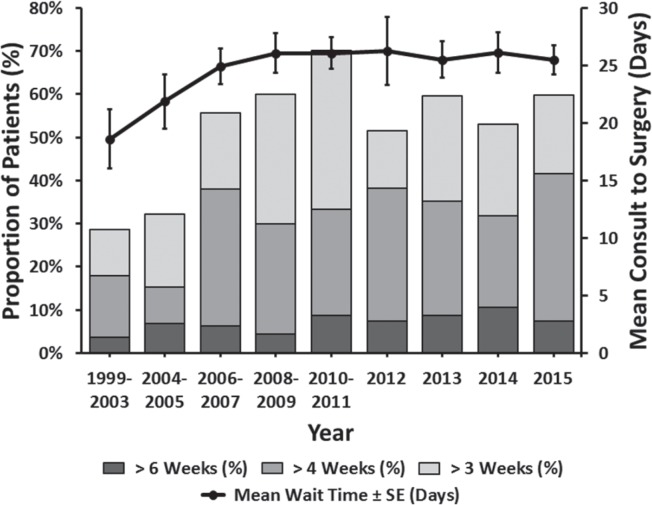
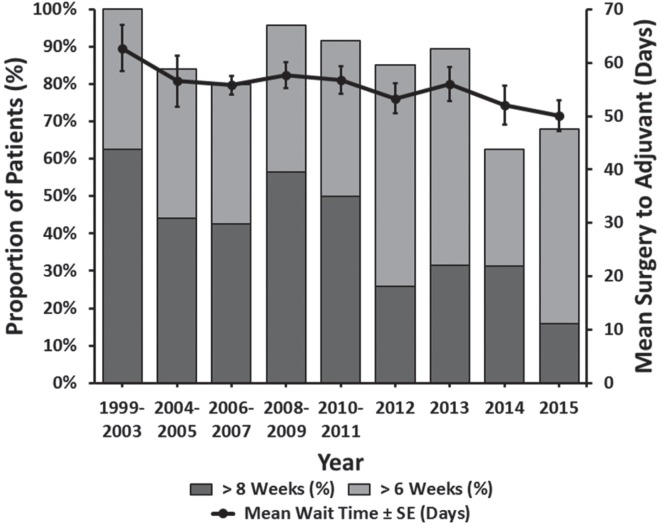
Between 1999 and 2015, patient wait times for surgery increased, from an average of 16.3 days prior to 2003 to 25.5 days in 2015 (p = 0.008) (Figure 3). Specifically, the percentage of patients waiting longer than four weeks (the cco guideline) significantly increased over this time frame (p = 0.006). Interestingly, during the same time period, we found that the mean patient wait time for adjuvant therapy decreased (p = 0.042) (Figure 4).
FIGURE 3.
Wait time from consultation to operation.
FIGURE 4.
Wait times for post-operative radiation from date of surgery.
Impact of OR Resources on Wait Times
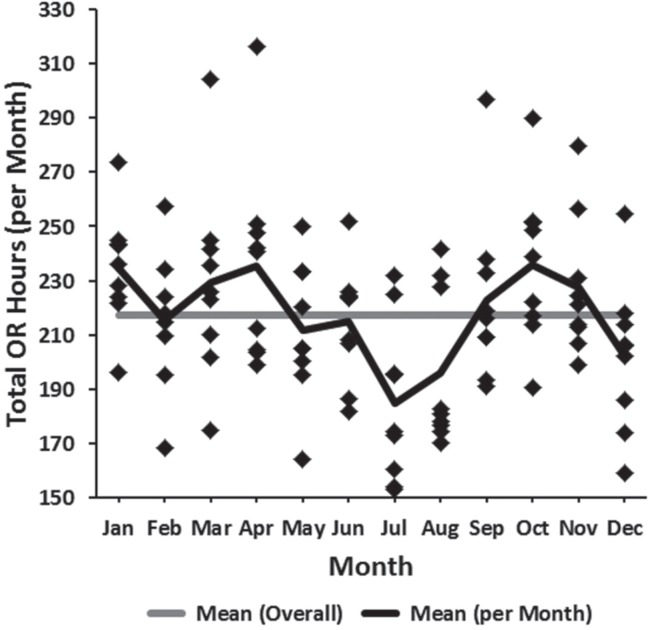
Variability in or resources on a month-to-month basis was observed (Figure 5). This was found to be statistically significant (p = 0.002) and was largely due to fewer available or hours during the months of July and August (the traditional summertime “slowdown” months), followed thirdly by December (Figure 5).
FIGURE 5.
Head and neck surgery available operating room time (2007–2015) plotted by month. OR = operating room.
Multivariable logistic regression analysis revealed that patients who had their initial surgical consultation in June immediately preceding the months of July and August had increased odds of waiting longer than 28 days for surgery (odds ratio: 3.07, 95% confidence interval: 1.96 to 4.81, p < 0.001). Furthermore, each day of “exposure” a patient had to the summertime slowdown period of July and August caused an increased odds of prolonged wait times (odds ratio: 1.07, 95% confidence interval: 1.05 to 1.10, p < 0.001).
Impact of OR Resources on Patient Outcomes
Multivariable Cox proportional hazards regression analyses are shown in Table II. The analysis revealed that individuals who were seen in initial consultation preceding a month with total or hours falling below the overall mean minus 10% had a significantly increased hazard of disease recurrence and/or death (hazard ratio: 1.59, 95% confidence interval: 1.10 to 2.30, p = 0.014).
TABLE II.
Univariate and multivariate Cox proportional hazards regression models predictive of overall survival and progression-free survival
| Dependent Variable | Overall Survival | Progression-Free Survival | ||||||
|---|---|---|---|---|---|---|---|---|
|
|
|
|||||||
| Univariable | Multivariablea (C-index: 0.741) | Univariable | Multivariable1 (C-index: 0.653) | |||||
|
|
|
|
|
|||||
| Variable | HR (95% CI) | p value | HR (95% CI) | p value | HR (95% CI) | p value | HR (95% CI) | p value |
| Wait time (per 1 day increase) | 1.01 (1.00, 1.02) | 0.106 | 1.00 (0.99, 1.01) | 0.920 | 1.00 (0.99, 1.01) | 0.457 | 1.00 (0.99, 1.01) | 0.576 |
| Wait time >3 weeks (vs. ≤3 weeks)b | 1.24 (0.88, 1.74) | 0.229 | — | — | 0.89 (0.68, 1.16) | 0.387 | — | — |
| Wait time >4 weeks (vs. ≤4 weeks)b | 1.14 (0.79, 1.65) | 0.478 | — | — | 0.94 (0.70, 1.26) | 0.683 | — | — |
| Wait time >6 weeks (vs. ≤6 weeks)b | 1.49 (0.80, 2.76) | 0.211 | — | — | 1.37 (0.84, 2.26) | 0.211 | — | — |
| Below mean (yes vs. no)a | 1.10 (0.66, 1.82) | 0.719 | — | — | 1.42 (0.96, 2.10) | 0.080 | — | — |
| Below mean – 10% (yes vs. no)a | 1.45 (0.91, 2.31) | 0.116 | 1.59 (0.98, 2.57) | 0.059 | 1.38 (0.97, 1.96) | 0.074 | 1.59 (1.10, 2.30) | 0.014 |
| Summer (yes vs. no)a | 1.45 (0.87, 2.40) | 0.156 | — | — | 1.33 (0.90, 1.97) | 0.151 | — | — |
| Age at diagnosis (per 5-year increase) | 1.15 (1.07, 1.24) | <0.001 | 1.14 (1.04, 1.26) | 0.008 | 1.04 (0.99, 1.10) | 0.132 | — | — |
| Male (vs. female) | 1.37 (0.95, 1.99) | 0.096 | — | — | 1.39 (1.04, 1.86) | 0.026 | — | — |
| Clinical stage III–IV (vs. I–II)b | 2.32 (1.57, 3.43) | <0.001 | — | — | 1.48 (1.10, 2.01) | 0.010 | — | — |
| Clinical T3–T4 (vs. T1–T2)b | 2.16 (1.48, 3.16) | <0.001 | — | — | 1.55 (1.15, 2.10) | 0.005 | — | — |
| Clinical N1–N2 (vs. N0)b | 1.96 (1.34, 2.88) | <0.001 | — | — | 1.63 (1.20, 2.21) | 0.002 | — | — |
| Pathological stage III–IV (vs. I–II) | 2.52 (1.72, 3.70) | <0.001 | — | — | 1.52 (1.15, 2.02) | 0.004 | — | — |
| Pathological T3–T4 (vs. T1–T2) | 2.03 (1.44, 2.87) | <0.001 | 1.92 (1.17, 3.13) | 0.009 | 1.50 (1.14, 1.97) | 0.004 | 1.68 (1.14, 2.47) | 0.008 |
| Pathological N1–N3 (vs. N0) | 2.60 (1.84, 3.67) | <0.001 | 4.48 (2.52, 7.95) | <0.001 | 1.77 (1.35, 2.31) | <0.001 | 3.17 (2.08, 4.85) | < 0.001 |
| Location | ||||||||
| Tongue | 0.68 (0.48, 0.97) | 0.032 | — | — | 0.86 (0.66, 1.13) | 0.280 | — | — |
| Cheek/Buccal/Mucosa | 1.21 (0.68, 2.15) | 0.516 | — | — | 1.02 (0.65, 1.62) | 0.923 | — | — |
| Floor of mouth | 1.17 (0.78, 1.76) | 0.440 | — | — | 1.12 (0.81, 1.55) | 0.482 | — | — |
| Mandible/Gingiva/Alveolus | 1.30 (0.84, 2.01) | 0.243 | — | — | 1.05 (0.73, 1.49) | 0.811 | — | — |
| Adjuvant treatment (vs. no) | 1.62 (1.15, 2.29) | 0.006 | 0.56 (0.31, 1.00) | 0.048 | 0.94 (0.72, 1.24) | 0.667 | 0.45 (0.29, 0.69) | < 0.001 |
| Perineural invasionb | 1.42 (0.94, 2.15) | 0.094 | — | — | 1.12 (0.80, 1.58) | 0.510 | — | — |
| Lymphatic invasionb | 1.82 (1.08, 3.07) | 0.024 | — | — | 1.57 (1.00, 2.48) | 0.051 | — | — |
| Vascular invasionb | 2.67 (1.60, 4.45) | <0.001 | — | — | 2.03 (1.29, 3.21) | 0.002 | — | — |
| Extracapsular spreadb | 3.83 (2.43, 6.05) | <0.001 | — | — | 2.48 (1.64, 3.74) | <0.001 | — | — |
| Differentiationb | 0.199 | 0.604 | ||||||
| Moderate vs. Well | 1.31 (0.86, 2.01) | 0.210 | — | — | 1.01 (0.72, 1.43) | 0.946 | — | — |
| Poor vs. Well | 2.09 (1.03, 4.24) | 0.041 | — | — | 1.51 (0.81, 2.82) | 0.200 | — | — |
| None/Unknown vs. Well | 1.03 (0.40, 2.66) | 0.960 | — | — | 0.93 (0.42, 2.03) | 0.848 | — | — |
Hazard ratios adjusted for wait time modelled as continuous.
Not eligible for multivariable modelling.
P values < 0.05 shown in bold.
HR = hazard ratio; CI = confidence interval.
DISCUSSION
This large study, from a high-volume tertiary care centre, strongly suggests that patients who present for care before a month with reduced or hours experience long wait times and have a higher risk of disease recurrence. To our knowledge, this is the first such study looking specifically at the holiday-related or slowdown periods.
Many system factors affect wait times for Canadian cancer patients, including lack of access to primary care, insufficient numbers of community and tertiary care specialists, and insufficient resources, particularly or time8. Canadian investigators have already reported that hnc patients are waiting longer than recommended for initial assessment and treatment10. Our report identifies excessive wait times for oral cavity cancer surgery that are increasing over time. This appears to be due to a rise in case numbers without an increase in available or hours.
We identified that scheduled reductions in available or hours are a contributing factor to prolonged wait times. In an attempt to preserve healthcare resources by cutting or time for surgeons, the healthcare system may be putting patients at risk for poorer outcomes. These findings are consistent with those of Van Harten et al.7, who reported a causal relationship between delays to treatment and higher patient mortality in a similar patient population. We observed that individuals “exposed” to months with less than average or hours were at higher risk of cancer recurrence and trended toward higher mortality. We are in the process of opening a study to validate these findings with Canadian population-based data through the Institute for Clinical Evaluative Sciences (ices) program. If these findings hold true, they raise the following question: Is it ethical that patients diagnosed prior to or during planned or slowdowns receive suboptimal care?
Finding an alternative to the traditional summertime or slowdown that occurs in many tertiary care centres nationwide might be a challenge. More dispersed, less drastic reductions in or hours spread over multiple months of the year may represent a solution to this issue. Doing so might mitigate the severe reduction in time available to surgeons seen during the summer months. Ideally, increased funding and better rationing of or hours are required.
On a positive note, the wait times for adjuvant radiotherapy at our centre have declined over time. We believe this improvement may be attributable to coordinated improvements in pathology processing, radiation oncology consultation, and communication between caregivers. Efforts have been made to streamline surgical wait times by advocating for additional or resources and sharing cases among surgical oncologists to balance or waitlists. Despite these initiatives, wait times have only plateaued, which can be considered positively in view of increasing patient cases in a setting of fixed resources. We caution, however, that this maintenance of wait times may be at the expense of the treatment of less time-sensitive benign and malignant tumours such as salivary and thyroid tumours that head and neck surgeons often triage behind squamous cell cancer cases. This can potentially result in poorer outcomes for these patients, even if they are lower risk. Future research directions for our research group include examining wait times for all major histologies treated by our disease site to further understand the impact of increasing patient loads in the face of fixed resources.
CONCLUSIONS
Limitations of our study include its retrospective nature, the inclusion of only one hnc site, and study of a limited time period at one institution. We were limited to an eight-year period as the site of hnc surgery in our city changed in 2005; thus accurate or hour records could only be obtained for 2006 onward.
Our healthcare system is challenged by an aging population and rising technology costs. While fiscal prudence is a necessity, our investigation suggests the possibility of harm due to seasonal or closures. Further work to identify strategies maximizing efficient use of health care resources without negatively affecting patient outcomes should continue.
CONFLICT OF INTEREST DISCLOSURES
We have read and understood Current Oncology’s policy on disclosing conflicts of interest and declare that we have none.
REFERENCES
- 1.Jemal A, Bray F, Center MM, Ferlay J, Ward E, Forman D. Global cancer statistics. Ca Cancer J Clin. 2011;61(2):69. doi: 10.3322/caac.20107. [DOI] [PubMed] [Google Scholar]
- 2.Chaturvedi AK, Anderson WF, Lortet-Tieulent J, et al. Worldwide trends in incidence rates for oral cavity and oropharyngeal cancers. J Clin Oncol. 2013;31(36):4550. doi: 10.1200/JCO.2013.50.3870. [DOI] [PMC free article] [PubMed] [Google Scholar]
- 3.Ferlay J, Shin HR, Bray F, Forman D, Mathers C, Parkin DM. Estimates of worldwide burden of cancer in 2008: GLOBO-CAN 2008. Int J Cancer. 2010;127(12):2893. doi: 10.1002/ijc.25516. [DOI] [PubMed] [Google Scholar]
- 4.Pulte D, Brenner H. Changes in survival in head and neck cancers in the late 20th and early 21st century: a period analysis. Oncologist. 2010;15(9):994–1001. doi: 10.1634/theoncologist.2009-0289. [DOI] [PMC free article] [PubMed] [Google Scholar]
- 5.Elit LM, O’Leary EM, Pond GR, Seow HY. Impact of wait times on survival for women with uterine cancer. J Clin Oncol. 2014;32(1):27–33. doi: 10.1200/JCO.2013.51.3671. [DOI] [PubMed] [Google Scholar]
- 6.Kulkarni GS, Urbach DR, Austin PC, Fleshner NE, Laupacis A. Longer wait times increase overall mortality in patients with bladder cancer. J Urol. 2009;182(4):1318–24. doi: 10.1016/j.juro.2009.06.041. [DOI] [PubMed] [Google Scholar]
- 7.Van Harten MC, Hoebers FJ, Kross KW, Van Werkhoven ED, Van Den Brekel MW, Van Dijk BA. Determinants of treatment waiting times for head and neck cancer in the Netherlands and their relation to survival. Oral Oncol. 2015;51(3):272–8. doi: 10.1016/j.oraloncology.2014.12.003. [DOI] [PubMed] [Google Scholar]
- 8.Bilimoria KY, Ko CY, Tomlinson JS, et al. Wait times for cancer surgery in the United States: trends and predictors of delays. Ann Surg. 2011;253(4):779–85. doi: 10.1097/SLA.0b013e318211cc0f. [DOI] [PubMed] [Google Scholar]
- 9.Cancer Care Ontario . Systemic Treatment Wait Times. [Available at: https://www.cancercare.on.ca/cms/One.aspx?portalId=1377&pageId=8888#stwtcurmon; cited 19 October 2016] [Google Scholar]
- 10.Belyea J, Rigby M, Jaggi R, Hart RD, Trites J, Mark Taylor S. Wait times for head and neck cancer patients in the Maritime provinces. J Otolaryngol Head Neck Surg. 2011;40(4):318–22. [PubMed] [Google Scholar]


