Abstract
CRISPR (Clustered Regularly Interspaced Short Palindromic Repeats) and the nearby cas (CRISPR-associated) operon establish an RNA-based adaptive immunity system in prokaryotes1–5. Molecular memory is created when a short foreign DNA-derived prespacer is integrated into the CRISPR array as a new spacer6–9. Whereas the RNA-guided CRISPR interference mechanism varies widely among CRISPR-Cas systems, the spacer integration mechanism is essentially identical7–9. The conserved Cas1 and Cas2 proteins form an integrase complex consisting two distal Cas1 dimers bridged by a Cas2 dimer in the middle6,10. The prespacer is bound by Cas1-Cas2 as a dual forked DNA, and the terminal 3′-OH of each 3′-overhang serves as an attacking nucleophile during integration11–14. Importantly, the prespacer is preferentially integrated into the leader-proximal region of the CRISPR array1,7,10,15, guided by the leader sequence and a pair of inverted repeats (IRs) inside the CRISPR repeat7,15–20. Spacer integration in the most well-studied Escherichia coli Type I-E CRISPR system further relies on the bacterial Integration Host Factor (IHF)21,22. In Type II-A CRISPR, however, Cas1-Cas2 alone integrates spacer efficiently in vitro18; other Cas proteins (Cas9 and Csn2) play accessory roles in prespacer biogenesis17,23. Focusing on the Enterococcus faecalis Type II-A system24, here we report four structure snapshots of Cas1-Cas2 during spacer integration. EfaCas1-Cas2 selectively binds to a splayed 30-bp prespacer bearing 4-nt 3′-overhangs. Three molecular events take place upon encountering a target: Cas1-Cas2/prespacer first searches for half-sites stochastically, then preferentially interacts with the leader-side CRISPR repeat and catalyzes a nucleophilic attack that connects one strand of the leader-proximal repeat to the prespacer 3′-overhang. Recognition of the spacer half-site requires DNA bending and leads to full integration. We derive a mechanistic framework explaining the stepwise spacer integration process and the leader-proximal preference.
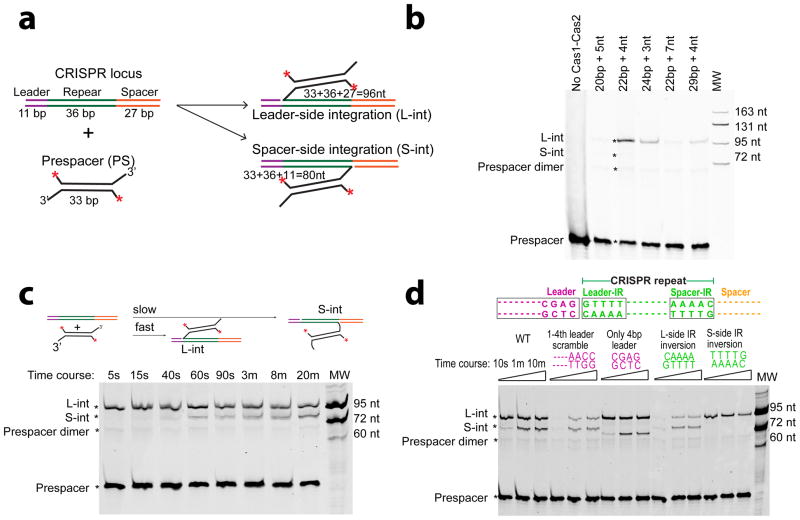
EfaCas1-Cas2 preferred a splayed prespacer containing a 22-bp mid-duplex and two 4-nt 3′-overhangs (Fig. 1a–b). The leader half-site is preferred; integration reached completion within seconds, whereas the spacer-side integration took minutes and plateaued to a lesser extent (Fig. 1c). The first 4-bp of the leader was sufficient in guiding the leader-side integration; trimming sequences further upstream had negligible effect (Fig. 1d). Complementing the spacer-side IR sequence selectively abolished spacer-side integration, whereas the same change in leader-side IR still allowed some integration to the leader-side (Fig. 1d). These observations suggest that the leader and IR work synergistically to guide the leader-side integration, whereas the spacer-side integration relies primarily on the spacer-side IR. Based on the biochemistry, we designed the splayed prespacer and minimum leader-repeat substrates for crystallization and determined the EfaCas1-2/prespacer binary structure and two EfaCas1-2/prespacer/target ternary structures (Extended Data Tables 1–2).
Figure 1. Spacer integration by E. fae Cas1-Cas2.
a, schematics of leader- and spacer-side integration by a 5′-fluorescently labeled self-annealed prespacer. b, Determining the prespacer duplex and 3′-overhang preference by EfaCas1-Cas2. c, Leader-side integration is more efficient than the spacer-side. d. Mutagenesis mapping of sequence determinants in the integration target. Time points were 10 s, 1 min, and 10 min. Biochemistry was done in triplicates, and representative gels are shown.
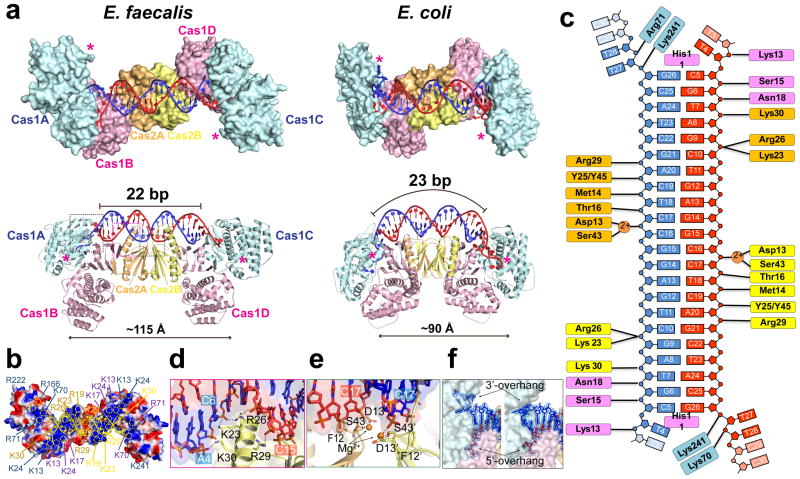
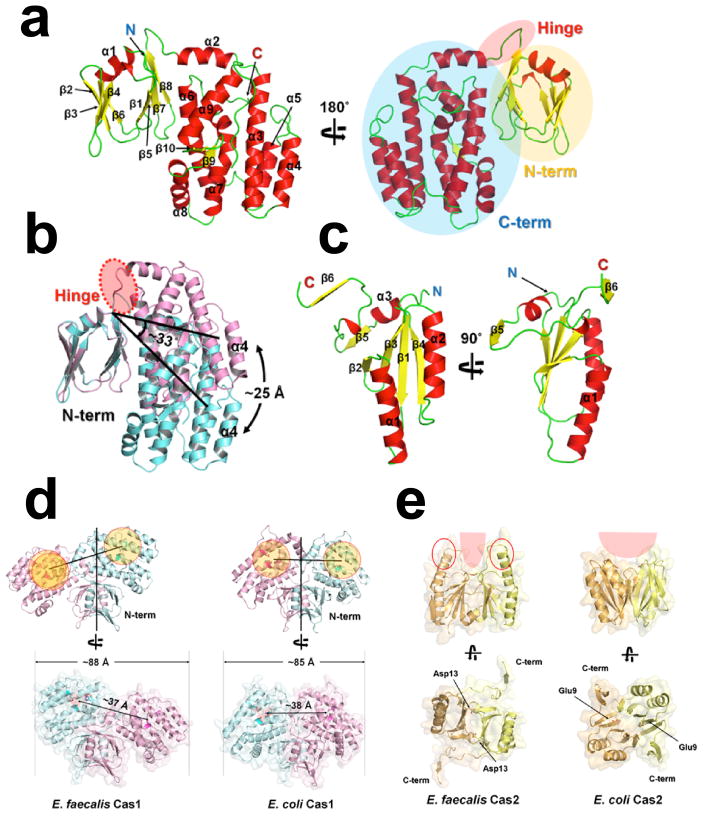
Whereas E. coli Cas1-Cas2 integrates a 33-bp prespacer into the beginning and end of a 28-bp CRISPR repeat, E. fae Cas1-Cas2 prefers a shorter prespacer (30-bp), but a longer repeat (36-bp). Comparison of the two Cas1-Cas2/prespacer structures nicely explain their distinct substrate preferences (Fig. 2)11,12. Both adopt a dumbbell-shaped architecture, in which two asymmetrically assembled Cas1 dimers are handcuffed by a Cas2 dimer in the middle (Fig. 2a). Only one Cas1 in each dimer catalyzes spacer integration; the other is oriented incorrectly. In comparison to the E. coli counterpart, EfaCas2 dimerizes at a tilted angle rather than in a juxtaposed fashion; the dimer orients in parallel rather than in perpendicular to the axis of the prespacer; and the Cas1-Cas2 contact is mediated by the C-terminal tail from the adjacent Cas2, rather than from the domain-swapped Cas2 (Fig. 2a; Extended Data Figures 1–3). These factors contribute to a ~15 Å extension between the two Cas1 active sites, allowing EfaCas1-Cas2 to integrate prespacers into an 8-bp longer repeat. EfaCas1-Cas2 further displays two positively-charged stripes and chelates two Mg2+ ions to mediate favorable contacts to prespacer backbone (Fig. 2b–e). Consistent with biochemistry, EfaCas1-Cas2 displays the 30-bp prespacer as a 22-bp duplex with a 4-bp splayed region at each end. The duplex length is specified by the end-stacking of His11 in each catalytic Cas1 (Fig. 2c). The two overhangs are guided to different paths by the positive charges in Cas1: 5′-overhang to Cas1-NTD and 3′-overhang to Cas1-CTD (Fig. 2f). Interestingly, the 3′-overhang is not stably docked in the active site and has equal propensity to fold into a tetraloop (Fig. 2f).
Figure 2. Architectural differences between the 3.25 Å E. fae and E. coli Cas1-Cas2/prespacer structures (PDB: 5DS512) explain their distinct substrate preference.
a, Comparison in the overall dimension, active site distance (in asterisks), and the prespacer duplex curvature. b, Distinct stripes of positive charges on the prespacer-binding surface of EfaCas1-Cas2. c, Interactions diagram between EfaCas1-Cas2 and prespacer. d, An α-helix in EfaCas2 mediates major groove sugarphosphate backbone contacts. e, E13 and S43 in each EfaCas2 coordinate a Mg2+ for DNA backbone contact. f, Prespacer 3′-overhang adopts two distinct conformations.
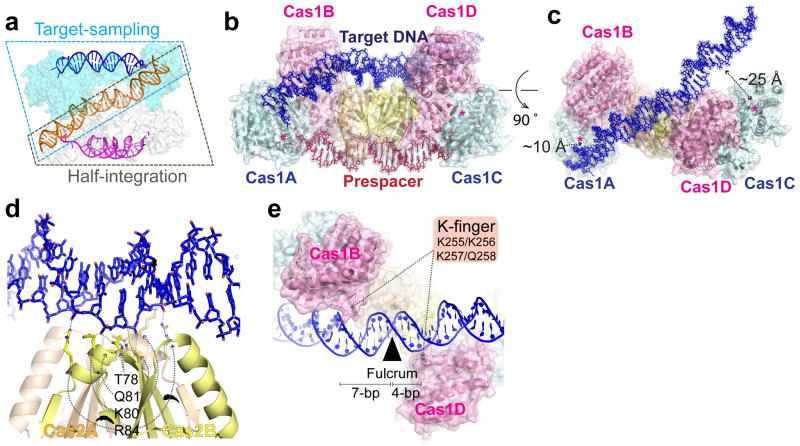
To understand the spacer integration mechanism, we determined a 3.1 Å EfaCas1-Cas2/prespacer/target ternary structure. The target contains a CRISPR repeat flanked by two 5-bp leaders to promote full-integration. To our surprise, the structure instead captures two Cas1-Cas2/prespacer complexes bound to one target; one Cas1-Cas2 is sampling dsDNA nonspecifically, and the other is catalyzing the leader-side half-integration (Fig. 3a). The sequence-nonspecific DNA contacts are similar in these two states. Each Cas2 contributes Thr78 and a nearby positive patch (K80/Q81/R84) to form a fulcrum to balance the target in the middle, ~30 Å above the prespacer and with a ~30° included angle (Fig. 3b–d). Because Cas1 active sites are recessive relative to the Cas2 fulcrum, the two half-sites cannot simultaneously access the active sites without a bend in the middle, therefore half-site recognition must take place in a sequential fashion. Lacking sequence-specific contacts, the target DNA in the substrate-sampling structure still dips down towards the Cas1 active site at one end and tips up at the other (Fig. 3c). This is because each non-catalytic Cas1 contacts target with a Lys-rich β-hairpin (K-finger: K255/K256/K257/Q258), and one K-finger contact is 3-bp closer to the fulcrum than the other, resulting in DNA tilting (Fig. 3e).
Figure 3. Structure snapshot of EfaCas1-Cas2 sampling a DNA target.
a, The asymmetric unit of the 3.1 Å ternary crystal structure contains two EfaCas1-Cas2/prespacer complexes interacting with one DNA target. b, c, Orthogonal views of the target-sampling complex showing the DNA target is balanced on the Cas2 dimer, in a tilted fashion. The two ends are ~10 and 25 Å away from the nearby Cas1 active sites. d, Nonspecific DNA contacts by the Cas2 fulcrum. e, Each non-catalytic Cas1 contributes a K-finger for nonspecific DNA contact. The right-side K-finger contact is closer to the fulcrum than the left-side, causing the DNA to tilt.
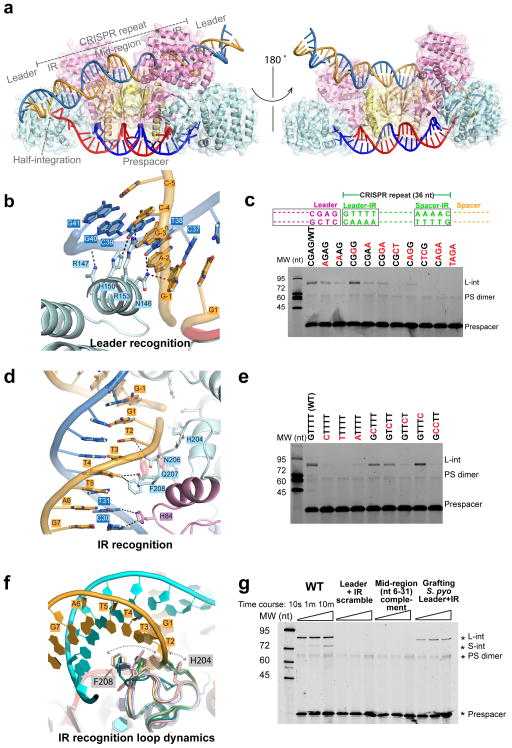
The half-integration snapshot provides direct evidence that the two integration events happen in a sequential fashion. A more pronounced DNA tilting enables the catalytic Cas1 subunit to gain direct contact, inserting an α-helix (aa145-159; hence named the leader-recognition helix) into the minor groove of the leader duplex (Fig. 4a–b; Extended Data Figure 4). Normally DNA minor groove is too narrow to accommodate an α-helix; here DNA bending and minor groove widening enabled the insertion (Fig. 4b)25,26. Since the location of this helix is conserved in other Cas1-Cas2 structures11,12, and Cas1 was shown to possess intrinsic sequence specificity for the leader-repeat boundary14, this is likely a conserved leader-recognition mechanism. Because the minor groove α-helix insertion is likely rate-limiting, any process that introduces local DNA bending and minor groove widening would facilitate leader-proximal integration. This would rationalize the IHF requirement for spacer acquisition in E. coli, as IHF introduces severe bending in DNA21,22. Consistent with our biochemistry, Cas1 only contacts the first four base-pairs in the leader region (Fig. 1d, 4b). The detailed Cas1-leader contacts include two H-bonds from Asn146 to N3 of G-1 and N2 of T38, one H-bond from His150 to N2 of C39, and one from Arg153 to N2 of C-4 (Fig. 4b; Extended Data Figure 4).
Figure 4. Leader-IR recognition as revealed by the half-integration snapshot.
a, Front and back views of the half-integrated EfaCas1-Cas2/prespacer/target complex. The DNA is modeled in the post-integration state. b, Leader sequence recognition by the minor groove α-helix insertion. Dashed lines indicate H-bonds. c, Base substitutions to validate the leader recognition. d, Inverted repeat (IR) recognition by a flexible loop. Dashed lines indicate van der Waals contacts in the range of 3.5–4 Å. e, Base substitutions to validate the IR recognition. f, Cas1 structural alignment revealing the conformation dynamics in the IR recognition loop. F208 and H204 sweep a wide range. g, Base substitutions suggest additional sequence determinants are present in the middle of the CRISPR repeat. Biochemistry was done in triplicates, and representative gels are shown.
Since the DNA minor groove sequence read-out is usually promiscuous and the observed contacts appear to only specify the orientation of the purine-pyrimidine pairing at each base-pair, we used sequence substitutions to further define the leader-preference by EfaCas1-Cas2 (Fig. 4c). Indeed, transition substitutions had mild effect on integration efficiency, even when two-base-pair transitions were combined. In contrast, two-base-pair transversions consistently abolished spacer integration. The sequence promiscuity makes sense because the same α-helix is likely involved in the spacer-side recognition. We reason that the leader sequence is not conserved solely for the purpose of guiding prespacer integration – a set of leader sequences promote efficient integration (Fig. 4c). This echoes a previous observation that leader disruption redirects spacer integration to CRISPR repeats preceded by leader-like sequences16.
The symmetrically placed inverted repeats (IR) play important roles in guiding integration7,18,19, and the half-integration snapshot provides an explanation (Fig. 4d). Near the major groove of the leader-side IR is a flexible loop (aa203-210; IR-recognition loop) from the catalytic Cas1. This loop harbors two conserved residues (His204 and Phe208) and only assumes its final conformation during half-site docking (Fig. 4d–f; Extended Data Figure 4). H204 coordinates the prespacer 3′-OH for integration chemistry; the 3′-OH is not docked into the catalytic center until H204 assumes its final conformation (Fig. 2f, 4f). Sequence-specific IR recognition focus on the poly-dT track (T2-T4). F208 makes a van der Waals contact to the 5-Methyl group of T4; no other nucleotides satisfy this contact. The conformation of the IR-recognition loop varies significantly among Cas1 subunits, and F208’s location varies from the vicinity of T2 to T4 (Fig. 4f). Therefore F208 may be responsible for the sequence readout of the entire T-track as the half-site docks. In its final conformation, N206 and Q207 also make weak van der Waals contacts to T3 and T4, respectively (Fig. 4d). T-to-C transitions were introduced to evaluate the van der Waals contacts. Indeed, changes were not tolerated at T4 and T2/T3 (Fig. 4e). Base substitutions also suggest the identity of G1 is absolutely critical (Fig. 4e). Surprisingly, we did not observe any base-specific contact to the G1-C36 pair. It is possible that a contact to G1-C36 is critical during, but not after the half-site docking process. Alternatively, a loop on the opposite side (T165-E169) may recognize G1-C36, if it dynamically samples alternative conformations. Additional studies are required to resolve this ambiguity. Lastly, we show that although sequences between two IRs are degenerate, complementing the entire mid-portion was as severe as disrupting the leader-side leader-IR sequences - spacer integration was completely abolished (Fig. 4g). Supplementing the mid-portion with the S. pyogenes counterpart strongly impaired integration (Fig. 4g). Therefore additional sequence determinants are present in the middle of the CRISPR repeat.
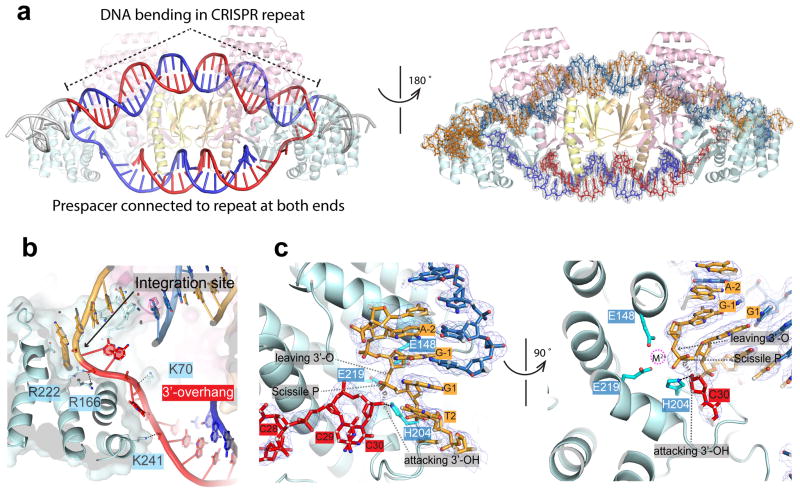
Using a target containing a CRISPR repeat flanked by two 9-bp leader duplexes, we captured a 3.0 Å crystal structure of the fully integrated ternary complex (Fig. 5a). The resulting structure shows that in order for the second half-site to access the Cas1 active site, the target DNA is bent at the central dyad by 30° (Fig. 5a). Here DNA bending likely relies on passive conformation capture, and the efficiency is likely determined by the affinity of the leader-recognition helix for the first 4-bp spacer-side sequence. Because most spacer-side sequences do not support favorable contact, the spacer-side integration is inefficient and secondary (Fig. 1c). Leader-side integration would promote the spacer-side integration by increasing the local substrate concentration. The sequential nature explains why disrupting leader-side integration also abolished the spacer-side integration (Fig. 4g).
Figure 5. The 3.0 Å full-integration snapshot and the prespacer integration mechanism.
a, Front-and-back views of the fully-integrated complex. Note that DNA bending is a prerequisite for full integration. Left: red and blue trace the two prespacer strands to the top and bottom strands of the CRISPR repeat after integration. Right: nucleic acid coloring scheme follows Figure 4. Electron densities are contoured at 1.5 σ level. b, Positive charges guiding the entry of prespacer 3′-overhang. DNA is modeled in the post-integration state. c, Integration chemistry. DNA is modeled in the pre-integration state to show that the 3′-OH of the prespacer is optimally positioned for in-line attack. The magenta circle shows the expected position of the catalytic metal ion. The omit density map excluding the 3′-overhang, G1 and G-1 shows a mixture of the pre- and post-integration in the active site.
Both the full- and half-integration structures provided a consistent mechanistic framework explaining integration chemistry. The prespacer 3′-overhang is guided by a line of positive charges (K241/K70/R166/R222) into the active site (Fig. 5b). The sugarphosphate backbone of the target integration site is slightly distorted to expose the scissile phosphate in G1 (Fig. 5c). The unbiased omit map density agrees with either the pre-cleavage or post-cleavage scenario; there is no clear breakage in electron density to indicate which state is predominant. This is consistent with the crystal content analysis (Fig. 5c, Extended Data Figure 5–6), and suggests that the free energy gain of the transesterification reaction may be small. When modeled in the pre-integration state, the terminal 3′-OH is in optimal orientation and distance (2.9 Å) for the nucleophilic attack (Fig. 5c). Three Cas1 residues (E148/E219/H204) catalyze a one-metal-ion based nucleolytic reaction27. H204 is found at the 5′-side of the scissile phosphate, serving as the general base to activate the attacking 3′-OH in prespacer (Fig. 5c). The catalytic Mg2+ ion is chelated away by the citrate buffer, but is expected to be coordinated by E148, E219, a non-bridging phosphoryl oxygen, and the 3′-oxygen of the leaving nucleotide (G-1), to stabilize the pentavalent transition state27 (Fig. 5c).
Our structure-function analysis leads to an updated model explaining the stepwise spacer integration mechanism (Extended Data Figure 7). We show that the Cas1-Cas2 architecture is highly adaptable to distinct spacer and insertion site specifications in CRISPR systems. A DNA target is balanced on the Cas2 dimer for half-site sampling. Optimal leader-side recognition orients the reactants as well as the catalytic residue; the subsequent integration chemistry is fast. The spacer-side integration involves DNA bending and a suboptimal half-site recognition, therefore is much less efficient. The subsequent steps to disassemble the post-integration complex, incorporate the spacer, and duplicate the CRISPR repeat are less clear. It presumably involves DNA repair, gap-filling, and ligation. We anticipate our thorough structure-function understanding of Type II-A spacer integration will translate to more robust applications6,18,28 in cell barcoding, information storage, lineage tracing and more.
At least two major mechanistic questions remain unanswered. Spacers are preferentially acquired adjacent from a Protospacer Adjacent Motif (PAM)29. This not only enables efficient CRISPR interference, but also prevents self-targeting30. There seems to be more than one mechanism to achieve PAM-dependent spacer acquisition6. In Type II-A, for example, Cas9 dictates the PAM-proximal prespacer biogenesis17,23, but the mechanistic details remains unclear. A related observation is that in vivo, spacers are almost always integrated in the same orientation as their parental protospacers. This orientation preference is lost when Cas1-Cas2 is programmed with a splayed prespacer DNA in vitro. The orientation preference may be determined at the biogenesis step, and/or during the stepwise integration process. Our structural snapshots open the door for deeper mechanistic investigation.
METHODS
Cloning, expression, and purification
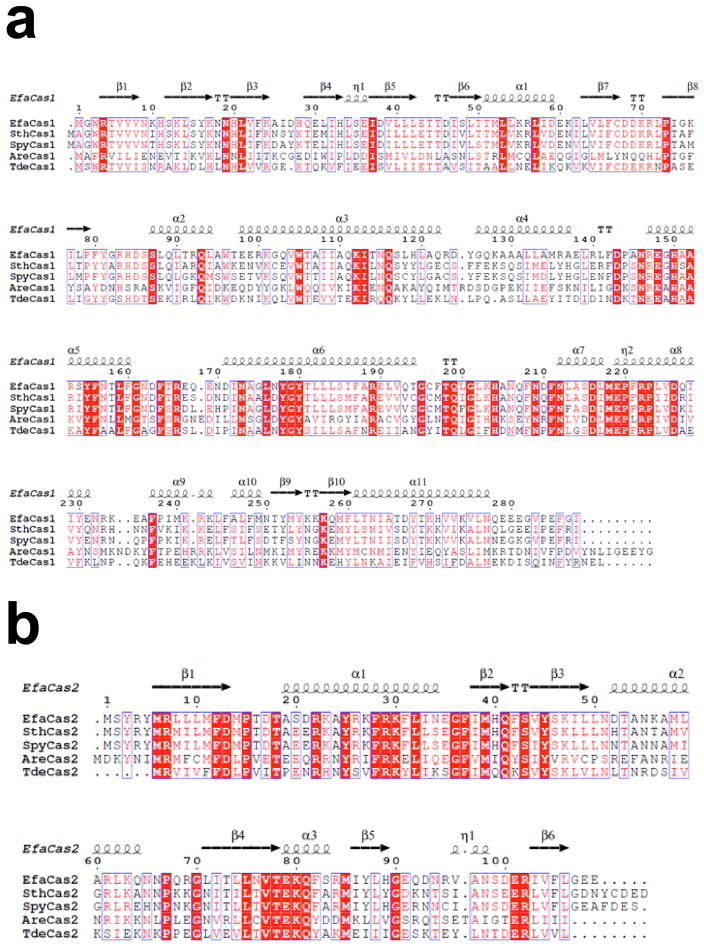
Full-length cas1 and cas2 genes were cloned from E. faecalis genomic DNA into separate His6-Twin-Strep-SUMO-pET28a vectors (KanR), between BamHI and XhoI sites. Refer to Extended Data Figure 8 for sequence alignment between E. fae and other representative Type II-A Cas1 and Cas2 proteins. Sequence verified plasmids were transformed into E. coli BL21 (DE3) star cells. The cell culture was grown in LB medium at 37°C until the optical density at 600 nm reached 0.8. Expression was induced by adding isopropyl-β-D-thiogalactopyranoside (IPTG) to a final concentration of 0.5 mM at 25°C overnight. Cells were harvested by centrifugation and lysed by sonication in buffer A containing 50 mM HEPES pH 7.5, 20 mM imidazole and 500 mM NaCl. The lysate was centrifuged at 15,000 rpm for 60 min at 4°C, and the supernatant was applied onto the pre-equilibrated Ni-NTA column (Qiagen). After washing with 100 mL of buffer A, the protein was eluted with buffer B (50 mM HEPES pH 7.5, 500 mM NaCl, and 300 mM imidazole), and incubated with SUMO-protease at 4°C overnight. The His6-Twin-Strep-SUMO tag cleaved Cas1 and Cas2 proteins were mixed with a molar ratio of 2:1 and further purified by size-exclusion chromatography (SEC, HiLoad 16/60 Superdex 200; GE Healthcare) equilibrated with buffer C (10 mM HEPES pH 7.5, 500 mM NaCl, 5 mM DTT), the peak fractions were pooled and snap-frozen in liquid nitrogen for later usage. Se-methionine replaced proteins were produced from the B834 (DE3) cells using Se-methionine media (Molecular Dimensions).
DNA substrate preparation
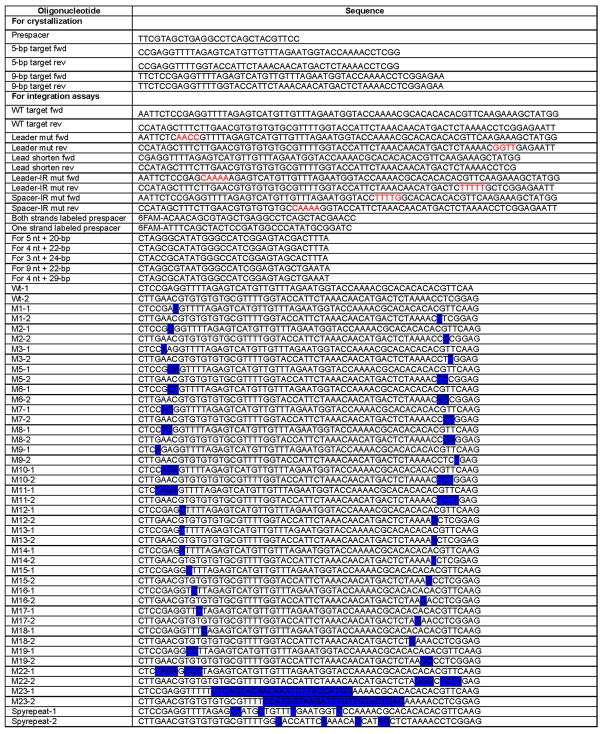
DNA oligonucleotides for crystallization and integration assays (Extended Data Table 1) were synthesized by Integrated DNA Technologies. The spacer and leader-repeat target site duplexes were annealed by heating to 95 °C and slow cooling to room temperature in annealing buffer containing 20 mM HEPES pH 7.5, 100 mM NaCl.
Crystallization, data collection, and structure determination
The Cas1-Cas2-prespacer binary complex was reconstituted by incubating Cas1-Cas2 complex and dual-forked DNA (22-bp duplex flanked by 4-nt 3′ overhangs and 2-nt 5′-overhang at both sides) at a molar ratio of 1:1.4 on ice for 30 min. The mixture was SEC-purified on Superdex 200 equilibrated with buffer D (10 mM HEPES pH 7.5, 150 mM NaCl, 5 mM MgCl2). The binary complex fractions were concentrated to a final OD280nm of ~5. The Cas1-Cas2-prespacer binary complex crystals were grown at 18°C using the hanging drop vapor diffusion method by mixing 1.5 μl complex solution with 1.5 μl well solution containing 100 mM Tris-HCl, pH 8.5, and 8% (w/v) PEG 8000. To crystallize the Cas1-Cas2-prespacer-dsDNA target ternary complex, we mixed the Cas1-Cas2-prespacer binary complex with various dsDNA targets at a molar ratio of 1:1.2, and purified the ternary complex away from individual components on Superdex 200 before setting up crystallization screens. The estimated molecular weight from SEC profile and the SDS-PAGE both indicated a roughly 1:1:1 stoichiometry between the Cas14-Cas22 complex, prespacer, and the DNA target (Extended Data Figure 5). Using a 46-bp dsDNA target (36-bp repeat sequence flanked by two 5-bp leader sequences, leading to the half-integration structure), crystals were obtained from conditions containing 100 mM sodium acetate, 100 mM sodium citrate, pH 6.2, and 4–7% (w/v) PEG 4000. The crystal content analysis indicated that the DNA target became sub-stoichiometric during crystallization, possibly due to prespacer disintegration in that particular condition (Extended Data Figure 6). A second crystal form was obtained using a 54-bp dsDNA target (36-bp repeat sequence flanked by two 9-bp leader sequences, leading to the full-integration structure), crystals were obtained from conditions containing 100 mM sodium acetate, 100 mM sodium citrate, pH 4.8, and 4–7% (w/v) PEG 4000. Complexes with less optimal spacer-side sequences fail to crystallize. The crystal content analysis indicated that the DNA target remained stoichiometric in this crystal form, and the extent of prespacer integration became more pronounced (Extended Data Figure 5). All the crystals were cryoprotected by soaking the crystals in the well solution supplemented with 25% (v/v) ethylene glycol and flash frozen in liquid nitrogen.
Data collection was plagued by problems of inconsistent diffraction quality and frequent macroscopic twinning. Over 400 crystals were screened at Cornell MacCHESS beam line F1. Crystals suitable for data collection were selected and dataset was collected at the NE-CAT beam line 24ID-C at APS. Diffraction data sets were indexed, integrated, and scaled using HKL200031. Molecular replacement attempts were not successful despite the availability of multiple homologous Cas1 and Cas2 structures. Ultimately, experimental phases were obtained from a 3.7 Å Se-methionine SAD data set from a half-integration crystal using the direct method in SHELXC/D/E32. Structure building was greatly accelerated by the manual-docking of EfaCas2 and Cas1 structures (unpublished results) into the experimental density map, followed by rigid-body refinement and iterative rounds of MR-SAD phasing to improve the phases and to refine the Se sites. With most Se sites located accurately, a second route of phasing was carried out against a 3.2 Å Se-Met data set, resulting in an unbiased set of phases that allowed unambiguous tracing of proteins and nucleic acids (Extended Data Figure 6). Iterative rounds of refinement were carried out using the programs COOT33, PHENIX34, and REFMAC35. The prespacer structure and the full-integration structure were solved using the refined Cas1-Cas2 complex as the search model in molecular replacement using PHASER36. The spacer and target DNAs were manually built, and the structure models were refined as described above. Due to the presence of a leader sequence on both ends of the CRISPR repeat, the DNA target in the full-integration structure could be built in both orientations without affecting the refinement statistics. Its orientation in the full-integration structure was arbitrarily chosen. Statistics for the final crystal structures is reported in the Extended Data Table 2.
Structure analysis
The sequence alignment was performed using the Type II-A cas1 and cas2 sequences from Enterococcus faecalis, Streptococcus thermophilus, Streptococcus pyogenes serotype M1, Agathobacter rectalis, and Treponema denticola. The structure-based sequence alignment was generated using Clustal Omega37 and the ESPRIPT38. Molecular contacts and B-factor distributions were analyzed using the CCP4 suite39. All figures were generated using PyMol.
Integration assays
The in vitro integration assays were set up as follows. A DNA oligo containing palindromic sequence in the middle (5 nM) was 5′-6FAM labeled and self-annealed to generate the splayed prespacer duplex. 20 nM of prespacer was then incubated with 20 nM Cas1–Cas2 complex and 100 nM cold target site in an integration buffer containing 20 mM HEPES pH 7.5, 150 mM NaCl, and 5 mM MgCl2. Reactions were incubated at 22 °C and quenched by the addition of an equal volume of 95% formamide and 50 mM EDTA. Samples were run on 12% urea-PAGE. Fluorescent signals were recorded using a Typhoon 9200 scanner. Spacer integration to the target site was detected based on changes in the fluorescent oligo length.
Data availability statement
Structure factors and coordinates that support the findings of this study have been deposited in the Protein Data Bank under accession numbers of 5XVN (prespacer-bound), 5XVO (half-integration), and 5XVP (full-integration). Plasmids used in this study are available upon request.
Extended Data
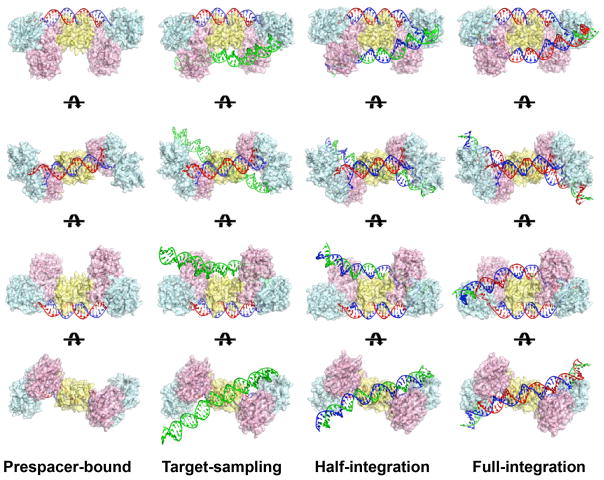
Extended Data Figure 1.
Comparison of EfaCas1-Cas2 structures in prespacer-bound, target-sampling, half-integration, and full-integration states.
Extended Data Figure 2. Comparison of the Cas1 and Cas2 dimer structures in E. faecalis and E. coli Cas1-Cas2/DNA complexes.
a, Structural analysis of individual Cas1 subunit in the EfaCas1-Cas2/DNA complex. Cas1 consists of a N-term β-sandwich (in yellow circle) and a C-term helical domain (in blue circle). These two domains are connected by a flexible hinge loop (in red circle). b, Superposition of the catalytic (Cas1B, in Cyan) and non-catalytic (Cas1A, in violet) Cas1 subunit in the complex. Note the ~33° hinge motion between NTD and CTD, taking place at the circled region. c, Structural analysis of individual Cas2 subunit in the EfaCas1-Cas2/DNA complex. Monomeric EfaCas2 structure contains a ferredoxin domain. d, Comparison of E. faecalis and E. coli Cas1 in the corresponding Cas1-Cas2/DNA complexes along the 2-fold symmetry axis of the Cas1-NTD dimer. The Cas1-CTD dimer tilts at different angles in these two compex structures. e, EfaCas2 dimerizes at a tilted angle whereas EcoCas2 dimerizes in a juxtaposed fashion (follow the angle between major helices in the dimer). EfaCas2 features long positively charged spikes at its dorsal region, which are inserted into the major grooves of dsDNA for prespacer binding. Overall, the structures of individual Cas1 and Cas2 domains are fairly conserved. The altered overall dimension of the Cas1-Cas2 compex was due to the altered domain orientation at each subunit interface.
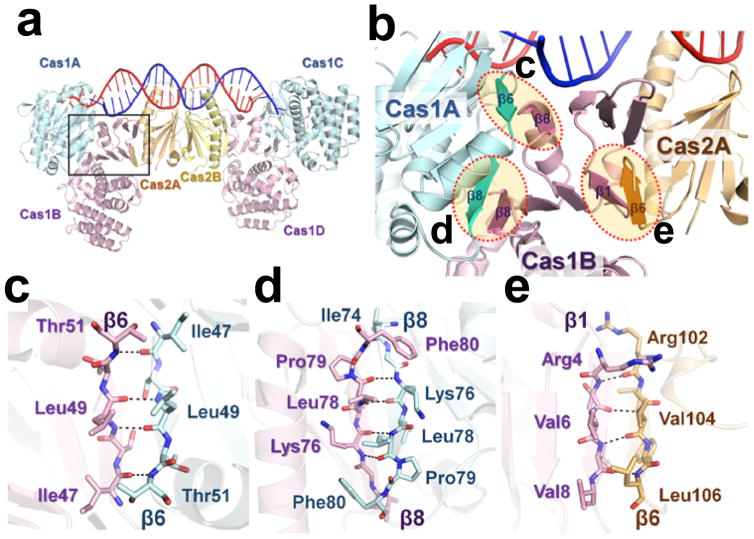
Extended Data Figure 3. Subunit interface analysis in the binary complex.
a, Overall structure of the EfaCas1-Cas2-prespacer complex. Cas1B (pink) molecule is positioned between the Cas1A (cyan) and Cas2A (Orange). There is no direct contact between Cas1A and Cas2A. b, Location of the Cas1A-Cas1B and Cas1B-Cas2A interface. The β-sandwich domain in Cas1B-NTD bridges between Cas1A and Cas2A. Close-up views of the β-sheet interface for Cas1A-Cas1B (c,d) and Cas1B-Cas2A (e) are shown.
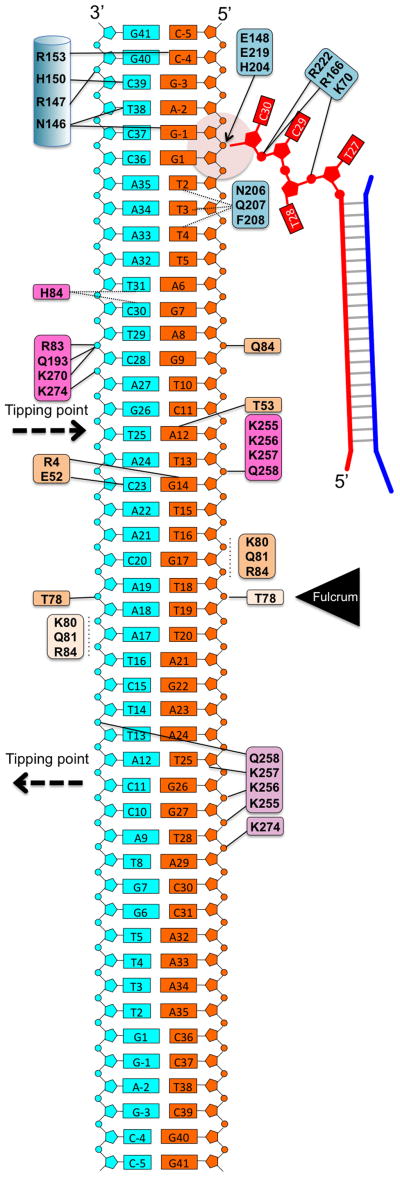
Extended Data Figure 4. Protein-DNA interaction diagram derived from the half-integration snapshot.
The prespacer is illustrated as a simple splayed duplex, with the interactions to the attacking 3′-overhang at the half-integration site highlighted. The catalytic center is denoted with a beige circle. Target DNA-contacting residues are organized into groups, and colored according to the subunit they reside in. The lines distinguish base-specific versus sugarphosphate contacts. The coloring scheme follows that of Figure 4.
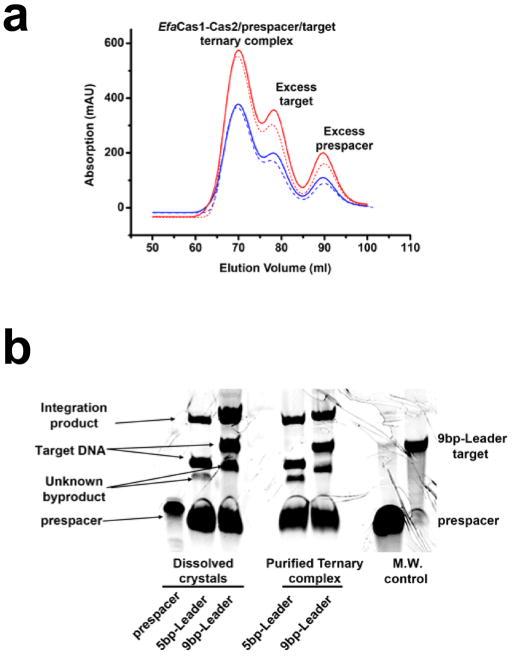
Extended Data Figure 5. SEC and crystal content analyses.
a, Size-exclusion Chromatography (HiLoad 16/60 Superdex 200) of two EfaCas1-Cas2/prespacer/target ternary complexes. The solid line corresponds to the ternary complex with the 5bp-leader DNA that yielded the half-integration structure; the dotted line is for the 9-bp-leader DNA containing complex that yielded the full-integration structure. Red and blue traces correspond to 260 and 280 nm UV absorptions, respectively. The two complexes eluted at the same retention volume of 69 ml, which corresponds to an estimated molecular weight of 200 kDa. This suggests the two complexes had the same stoichiometry before crystallization (Cas14:Cas22:prespacer:target). b, SDS-PAGE analysis of the dissolved crystals, side-by-side with the before-crystallization sample. Note the relative intensity of the target DNA band and the integration product band. The 5-leader crystal contained less integration product than the starting sample, which is consistent with the resulting structure containing two Cas1-Cas2/prespacer complexes bound to one DNA target. In contrast, the 9-leader crystal contained the extent of integration product as before-crystallization, which is consistent with it yielding a fully integrated crystal structure. The cleaved leader DNA ran out of the gel due to its much smaller size.
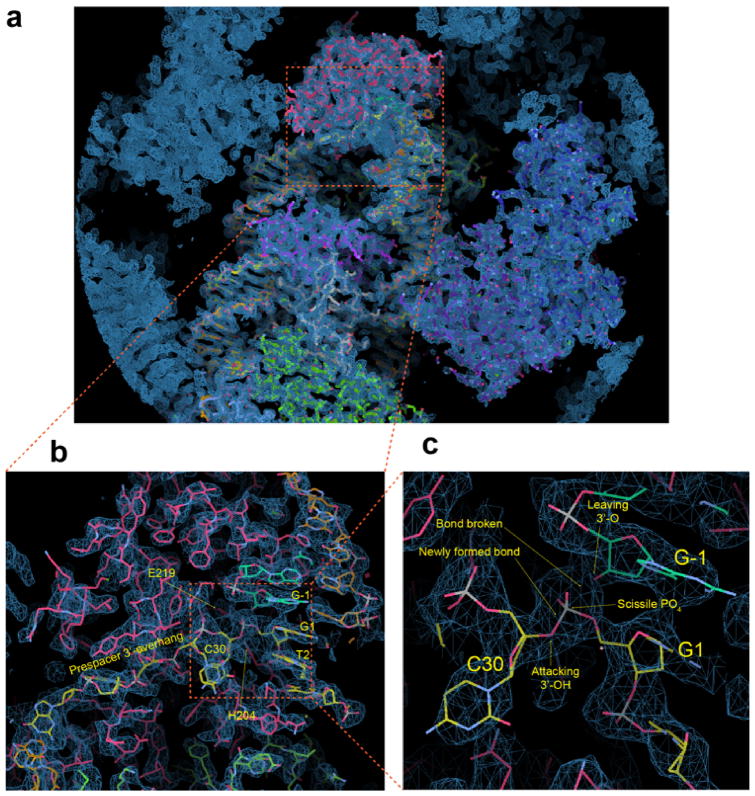
Extended Data Figure 6. Unbiased Se-Met experimental phases superimposed with the half-integration structure.
a, overall view, b, zooming into the half-integration site and c, further zoom-in at the integration site. The reactants including the 3′-OH, scissile phosphate, and the leaving 3′-O are labeled. All maps are contoured at 1.5 sigma. The structure is modeled in the post half-integration state, however, the density in c is consistent with either pre- or post-integration scenario.
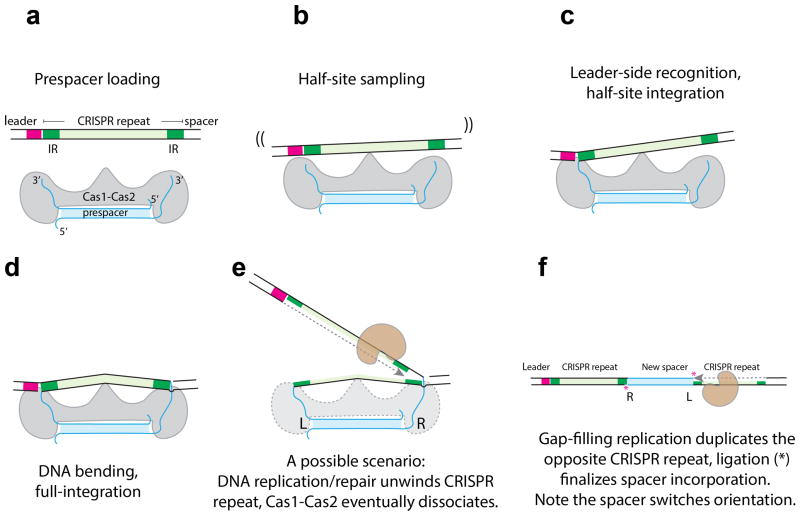
Extended Data Figure 7. A mechanistic model for Cas1-Cas2 catalyzed step-wise spacer integration.
a, Cas1-Cas2 loads a 30-bp prespacer. b, Cas2 serves as a fulcrum, non-specific contacts tilt the target DNA stochastically for half-site searching by Cas1. c, Cas1 preferentially binds to the leader-IR containing half-site, catalyzes half-site integration. d, Spacer-side IR is captured through DNA bending, full-integration takes place. e, While still under investigation, it is speculated that the post-integration complex is resolved by DNA replication, CRISPR repeat is duplicated on one-side. f, Opposite-side DNA replication duplicates the repeat on the opposite side; ligation finalizes spacer incorporation. The spacer flips its orientation during the process.
Extended Data Figure 8. Type II-A Cas1 (a) and Cas2 (b) sequence alignments.
Homologs from Enterococcus faecalis TX0027 (accession code:E6GPD7), Streptococcus thermophilus (G3ECR2), Streptococcus pyogenes serotype M1 (Q99ZW1), Agathobacter rectalis (C4ZA17), and Treponema denticola (Q73QW5) are used in the alignment. The absolutely conserved residues are boxed in red, highly conserved residues in unfilled boxes and red letters.
Extended Data Table 1. Sequence of the oligonucleotides used in this study.
DNA oligonucleotides used in the biochemical and structural biology experiments.
Deviations from wild-type sequences are highlighted in colors.
Extended Data Table 2. Data collection and refinement statistics.
X-ray crystallography data collection and structure refinement statistics.
| Prespacer (PDB: 5XVN) | Half-integration (PDB: 5XVO) | Full-integration (PDB: 5XVP) | Se-Met (low-res) | Se-Met (high-res) | |
|---|---|---|---|---|---|
| Data collection | |||||
| Space group | P41 | P21 | I222 | P21 | P21 |
| Cell dimensions | |||||
| a, b, c (Å) | 160.7 | 131.9 | 64.8 | 134.8 | 132.3 |
| 160.7 | 124.8 | 213.0 | 124.4 | 125.3 | |
| 187.8 | 157.9 | 513.3 | 160.4 | 159.5 | |
| a, b, g (°) | 90.0 | 90.0 | 90.0 | 90.0 | 90.0 |
| 90.0 | 106.5 | 90.0 | 106.6 | 106.4 | |
| 90.0 | 90.0 | 90.0 | 90.0 | 90.0 | |
| Inflection | Inflection | ||||
|
|
|||||
| Wavelength | 0.97918 | 0.97910 | 0.97910 | 0.97940 | 0.9794 |
| Resolution (Å)a Outer shell |
114-3.25 (3.37-3.25) | 151-3.10 (3.21-3.10) | 133-3.00 (3.11-3.00) | 154-3.70 (3.83-3.70) | 153-3.19 (3.25-3.19) |
| Rmerge | 0.055 (0.36) | 0.072 (0.35) | 0.071 (0.35) | 0.057 (0.37) | 0.067 (0.37) |
| I/s(I) | 13.9 (2.3) | 13.2 (2.8) | 8.6 (1.7) | 12.9 (2.2) | 7.2 (1.0) |
| CC1/2 | 1.0 (0.78) | 1.0 (0.87) | 1.0 (0.84) | 1.0 (0.74) | 1.0 (0.58) |
| Completeness (%) | 100.0 (99.9) | 97.3 (98.2) | 99.1 (99.6) | 99.4 (99.7) | 99.2 (97.8) |
| Redundancy | 7.1 (6.9) | 14.4 (14.6) | 5.1 (6.1) | 7.1 (7.0) | 7.6 (7.1) |
| Refinement | |||||
| Resolution (Å) | 49.4-3.25 | 50.0-3.10 | 50.0-3.00 | ||
| No. reflections | 71385 | 82547 | 62897 | ||
| Rwork/Rfree | 20.2/24.9 | 18.4/22.1 | 19.7/25.5 | ||
| No. atoms | |||||
| Protein | 22028 | 22277 | 11158 | ||
| DNA/Mg2+ | 2024/4 | 4084/4 | 3251/2 | ||
| Water | 2 | 14 | 2 | ||
| B factors | |||||
| Protein | 83.1 | 62.0 | 64.8 | ||
| DNA/ion | 84.2/41.7 | 60.8/54.7 | 67.2/42.1 | ||
| Water | 32.7 | 58.0 | 37.8 | ||
| r.m.s deviations | |||||
| Bond lengths (Å) | 0.011 | 0.009 | 0.010 | ||
| Bond angles (°) | 1.647 | 1.808 | 1.479 | ||
| Ramachandran plot | |||||
| Favored (%) | 95.7 | 97.3 | 93.8 | ||
| Allowed (%) | 4.3 | 2.7 | 6.2 | ||
| Asymmetric unit | 2 | 2 | 1 | ||
Values in parentheses are for highest-resolution shell.
Supplementary Material
Acknowledgments
This work is supported by NIH/NIGMS awards GM118174 and GM102543 to A.K. We especially appreciate D. Neau for assistance with data collection, and K. Rajashankar and I. Kriksunov for generous beamtime allocation. We thank P. Nguyen, R. Battaglia, and A. Dolan for technical assistance and discussions. This work is based upon research conducted at NECAT, supported by NIH/NIGMS awards P41-GM103403 and S10-RR029205; and at CHESS and MACCHESS, supported by NSF award DMR-1332208 and NIH/NIGMS award GM-103485. This research used resources of the Advanced Photon Source, a U.S. Department of Energy facility under Contract No. DE-AC02-06CH11357.
Footnotes
AUTHOR CONTRIBUTIONS
Y.X. and A.K. designed the research. Y.X. and S.N. are the main contributors to the biochemical and crystallography experiments. Y.X., K.H.N., and A.K. collected diffraction data, determined the structure, and performed structure-function analyses. A.K. and the rest of the authors wrote the manuscript.
The structure factors and coordinates for the prespacer-bound, half-integration, and full-integration Cas1-Cas2 complexes have been deposited in the Protein Data Bank under accession numbers 5XVN, 5XVO, and 5XVP, respectively.
The authors declare a competing financial interest in an ongoing patent application.
References
- 1.Barrangou R, et al. CRISPR provides acquired resistance against viruses in prokaryotes. Science. 2007;315:1709–1712. doi: 10.1126/science.1138140. [DOI] [PubMed] [Google Scholar]
- 2.Bolotin A, Quinquis B, Sorokin A, Ehrlich SD. Clustered regularly interspaced short palindrome repeats (CRISPRs) have spacers of extrachromosomal origin. Microbiology. 2005;151:2551–2561. doi: 10.1099/mic.0.28048-0. [DOI] [PubMed] [Google Scholar]
- 3.Mojica FJ, García-Martínez J, Soria E. Intervening sequences of regularly spaced prokaryotic repeats derive from foreign genetic elements. Journal of molecular evolution. 2005;60:174–182. doi: 10.1007/s00239-004-0046-3. [DOI] [PubMed] [Google Scholar]
- 4.Pourcel C, Salvignol G, Vergnaud G. CRISPR elements in Yersinia pestis acquire new repeats by preferential uptake of bacteriophage DNA, and provide additional tools for evolutionary studies. Microbiology. 2005;151:653–663. doi: 10.1099/mic.0.27437-0. [DOI] [PubMed] [Google Scholar]
- 5.Marraffini LA, Sontheimer EJ. CRISPR interference limits horizontal gene transfer in staphylococci by targeting DNA. Science. 2008;322:1843–1845. doi: 10.1126/science.1165771. [DOI] [PMC free article] [PubMed] [Google Scholar]
- 6.Jackson SA, et al. CRISPR-Cas: Adapting to change. Science. 2017;356:eaal5056. doi: 10.1126/science.aal5056. [DOI] [PubMed] [Google Scholar]
- 7.Yosef I, Goren MG, Qimron U. Proteins and DNA elements essential for the CRISPR adaptation process in Escherichia coli. Nucleic acids research. 2012;40:5569–5576. doi: 10.1093/nar/gks216. [DOI] [PMC free article] [PubMed] [Google Scholar]
- 8.Shmakov S, et al. Discovery and functional characterization of diverse class 2 CRISPR-Cas systems. Molecular cell. 2015;60:385–397. doi: 10.1016/j.molcel.2015.10.008. [DOI] [PMC free article] [PubMed] [Google Scholar]
- 9.Makarova KS, et al. An updated evolutionary classification of CRISPR-Cas systems. Nature Reviews Microbiology. 2015 doi: 10.1038/nrmicro3569. [DOI] [PMC free article] [PubMed] [Google Scholar]
- 10.Nuñez JK, et al. Cas1–Cas2 complex formation mediates spacer acquisition during CRISPR–Cas adaptive immunity. Nature structural & molecular biology. 2014;21:528–534. doi: 10.1038/nsmb.2820. [DOI] [PMC free article] [PubMed] [Google Scholar]
- 11.Wang J, et al. Structural and mechanistic basis of PAM-dependent spacer acquisition in CRISPR-Cas systems. Cell. 2015;163:840–853. doi: 10.1016/j.cell.2015.10.008. [DOI] [PubMed] [Google Scholar]
- 12.Nuñez JK, Harrington LB, Kranzusch PJ, Engelman AN, Doudna JA. Foreign DNA capture during CRISPR–Cas adaptive immunity. Nature. 2015;527:535–538. doi: 10.1038/nature15760. [DOI] [PMC free article] [PubMed] [Google Scholar]
- 13.Nuñez JK, Lee AS, Engelman A, Doudna JA. Integrase-mediated spacer acquisition during CRISPR-Cas adaptive immunity. Nature. 2015;519:193–198. doi: 10.1038/nature14237. [DOI] [PMC free article] [PubMed] [Google Scholar]
- 14.Rollie C, Schneider S, Brinkmann AS, Bolt EL, White MF. Intrinsic sequence specificity of the Cas1 integrase directs new spacer acquisition. Elife. 2015;4:e08716. doi: 10.7554/eLife.08716. [DOI] [PMC free article] [PubMed] [Google Scholar]
- 15.Díez-Villaseñor C, Guzmán NM, Almendros C, García-Martínez J, Mojica FJ. CRISPR-spacer integration reporter plasmids reveal distinct genuine acquisition specificities among CRISPR-Cas IE variants of Escherichia coli. RNA biology. 2013;10:792–802. doi: 10.4161/rna.24023. [DOI] [PMC free article] [PubMed] [Google Scholar]
- 16.McGinn J, Marraffini LA. CRISPR-Cas systems optimize their immune response by specifying the site of spacer integration. Molecular cell. 2016;64:616–623. doi: 10.1016/j.molcel.2016.08.038. [DOI] [PMC free article] [PubMed] [Google Scholar]
- 17.Wei Y, Chesne MT, Terns RM, Terns MP. Sequences spanning the leader-repeat junction mediate CRISPR adaptation to phage in Streptococcus thermophilus. Nucleic acids research. 2015;43:1749–1758. doi: 10.1093/nar/gku1407. [DOI] [PMC free article] [PubMed] [Google Scholar]
- 18.Wright AV, Doudna JA. Protecting genome integrity during CRISPR immune adaptation. Nature Structural & Molecular Biology. 2016 doi: 10.1038/nsmb.3289. [DOI] [PubMed] [Google Scholar]
- 19.Goren MG, et al. Repeat size determination by two molecular rulers in the type IE CRISPR array. Cell reports. 2016;16:2811–2818. doi: 10.1016/j.celrep.2016.08.043. [DOI] [PMC free article] [PubMed] [Google Scholar]
- 20.Wang R, Li M, Gong L, Hu S, Xiang H. DNA motifs determining the accuracy of repeat duplication during CRISPR adaptation in Haloarcula hispanica. Nucleic acids research. 2016;44:4266–4277. doi: 10.1093/nar/gkw260. [DOI] [PMC free article] [PubMed] [Google Scholar]
- 21.Nuñez JK, Bai L, Harrington LB, Hinder TL, Doudna JA. CRISPR immunological memory requires a host factor for specificity. Molecular cell. 2016;62:824–833. doi: 10.1016/j.molcel.2016.04.027. [DOI] [PubMed] [Google Scholar]
- 22.Yoganand K, Sivathanu R, Nimkar S, Anand B. Asymmetric positioning of Cas1–2 complex and Integration Host Factor induced DNA bending guide the unidirectional homing of protospacer in CRISPR-Cas type IE system. Nucleic acids research. 2017;45:367–381. doi: 10.1093/nar/gkw1151. [DOI] [PMC free article] [PubMed] [Google Scholar]
- 23.Heler R, et al. Cas9 specifies functional viral targets during CRISPR-Cas adaptation. Nature. 2015;519:199–202. doi: 10.1038/nature14245. [DOI] [PMC free article] [PubMed] [Google Scholar]
- 24.Nam KH, Kurinov I, Ke A. Crystal structure of clustered regularly interspaced short palindromic repeats (CRISPR)-associated Csn2 protein revealed Ca2+-dependent double-stranded DNA binding activity. Journal of Biological Chemistry. 2011;286:30759–30768. doi: 10.1074/jbc.M111.256263. [DOI] [PMC free article] [PubMed] [Google Scholar]
- 25.Schumacher MA, Choi KY, Zalkin H, Brennan RG. Crystal structure of LacI member, PurR, bound to DNA: minor groove binding by alpha helices. Science. 1994;266:763–770. doi: 10.1126/science.7973627. [DOI] [PubMed] [Google Scholar]
- 26.Garvie CW, Wolberger C. Recognition of specific DNA sequences. Mol Cell. 2001;8:937–946. doi: 10.1016/s1097-2765(01)00392-6. [DOI] [PubMed] [Google Scholar]
- 27.Yang W. Nucleases: diversity of structure, function and mechanism. Quarterly reviews of biophysics. 2011;44:1–93. doi: 10.1017/S0033583510000181. [DOI] [PMC free article] [PubMed] [Google Scholar]
- 28.Shipman SL, Nivala J, Macklis JD, Church GM. CRISPR-Cas encoding of a digital movie into the genomes of a population of living bacteria. Nature. 2017;547:345–349. doi: 10.1038/nature23017. [DOI] [PMC free article] [PubMed] [Google Scholar]
- 29.Mojica FJ, Diez-Villasenor C, Garcia-Martinez J, Almendros C. Short motif sequences determine the targets of the prokaryotic CRISPR defence system. Microbiology. 2009;155:733–740. doi: 10.1099/mic.0.023960-0. [DOI] [PubMed] [Google Scholar]
- 30.Marraffini LA, Sontheimer EJ. Self versus non-self discrimination during CRISPR RNA-directed immunity. Nature. 2010;463:568–571. doi: 10.1038/nature08703. [DOI] [PMC free article] [PubMed] [Google Scholar]
- 31.Otwinowski Z, Minor W. Processing of X-ray diffraction data collected in oscillation mode. Methods Enzymol. 1997;276:307–326. doi: 10.1016/S0076-6879(97)76066-X. [DOI] [PubMed] [Google Scholar]
- 32.Sheldrick GM. Experimental phasing with SHELXC/D/E: combining chain tracing with density modification. Acta Crystallogr D. 2010;66:479–485. doi: 10.1107/S0907444909038360. [DOI] [PMC free article] [PubMed] [Google Scholar]
- 33.Emsley P, Cowtan K. Coot: model-building tools for molecular graphics. Acta Crystallogr D Biol Crystallogr. 2004;60:2126–2132. doi: 10.1107/S0907444904019158. [DOI] [PubMed] [Google Scholar]
- 34.Adams PD, et al. PHENIX: a comprehensive Python-based system for macromolecular structure solution. Acta Crystallogr D. 2010;66:213–221. doi: 10.1107/S0907444909052925. [DOI] [PMC free article] [PubMed] [Google Scholar]
- 35.Murshudov GN, Vagin AA, Dodson EJ. Refinement of macromolecular structures by the maximum-likelihood method. Acta Crystallogr D Biol Crystallogr. 1997;53:240–255. doi: 10.1107/S0907444996012255. [DOI] [PubMed] [Google Scholar]
- 36.McCoy AJ, et al. Phaser crystallographic software. J Appl Crystallogr. 2007;40:658–674. doi: 10.1107/S0021889807021206. [DOI] [PMC free article] [PubMed] [Google Scholar]
- 37.Sievers F, et al. Fast, scalable generation of high-quality protein multiple sequence alignments using Clustal Omega. Mol Syst Biol. 2011;7 doi: 10.1038/msb.2011.75. [DOI] [PMC free article] [PubMed] [Google Scholar]
- 38.Robert X, Gouet P. Deciphering key features in protein structures with the new ENDscript server. Nucleic Acids Research. 2014;42:W320–W324. doi: 10.1093/nar/gku316. [DOI] [PMC free article] [PubMed] [Google Scholar]
- 39.Winn MD, et al. Overview of the CCP4 suite and current developments. Acta Crystallogr D. 2011;67:235–242. doi: 10.1107/S0907444910045749. [DOI] [PMC free article] [PubMed] [Google Scholar]
Associated Data
This section collects any data citations, data availability statements, or supplementary materials included in this article.
Supplementary Materials
Data Availability Statement
Structure factors and coordinates that support the findings of this study have been deposited in the Protein Data Bank under accession numbers of 5XVN (prespacer-bound), 5XVO (half-integration), and 5XVP (full-integration). Plasmids used in this study are available upon request.


