Abstract
Background/Aims
Methylation status plays a causal role in carcinogenesis in targeted tissues. However, the relationship between the DNA methylation status of multiple genes in blood leukocytes and colorectal cancer (CRC) susceptibility as well as interactions between dietary factors and CRC risks are unclear.
Methods
We performed a case-control study with 466 CRC patients and 507 cancer-free controls to investigate the association among the methylation status of individual genes, multiple CpG site methylation (MCSM), multiple CpG site heterogeneous methylation and CRC susceptibility. Peripheral blood DNA methylation levels were detected by performing methylation-sensitive high-resolution melting.
Results
Total heterogeneous methylation of CA10 and WT1 conferred a significantly higher risk of CRC (adjusted odds ratio [ORadjusted], 5.445; 95% confidence interval [CI], 3.075 to 9.643; ORadjusted, 1.831; 95% CI, 1.100 to 3.047; respectively). Subjects with high-level MCSM (MCSM-H) status demonstrated a higher risk of CRC (ORadjusted, 4.318; 95% CI, 1.529 to 12.197). Additionally, interactions between the high-level intake of fruit and CRH, WT1, and MCSM on CRC were statistically significant.
Conclusions
The gene methylation status of blood leukocytes may be associated with CRC risk. MCSM-H of blood leukocytes was associated with CRC, especially in younger people. Some dietary factors may affect hypermethylation status and influence susceptibility to CRC.
Keywords: Heterogeneous methylation, Colorectal neoplasms, Peripheral blood, Interaction effect
INTRODUCTION
It was estimated that colorectal cancer (CRC) ranked as the third most diagnosed cancer in males and the second most diagnosed cancer in females with an estimated 693,900 deaths occurring in 2012.1 CRC happens as a result of the accumulation of genetic and epigenetic alterations that induce transformation of the normal colonic epithelium into colon adenocarcinoma.2 CpG island hypermethylation in the promoter3 and first exon4 regions of tumour suppressor genes is a common epigenetic event in human cancers and results in transcriptional repression.5 It has been reported that gene-specific hypermethylation changes are associated with transcriptional modulation, which may affect tumour progression. There are several transcriptional modulation genes, such as Wilms’ tumour gene (WT1, 11p13) regulates transcription of growth factor,6,7 carboxy-terminal domain 4 gene (CITED4, 1p34.2) inhibits transactivation,8 corticotropin releasing hormone gene (CRH, 8q13) alternates binding properties of transcription factor,9 carbonic anhydrase gene (CA10, 17q24) shortens the transcription signal,10 and transmembrane protein 132D (TMEM132D, 17q11) variates expression of transcription factor.11
WT1 encodes a transcription factor that belongs to the early growth response family.12 Hypermethylation of the WT1 promoter region was obviously higher in tumour samples than in normal colonic mucosa,6,7 suggesting an important role in tumourigenesis of colorectal adenocarcinoma.6 Aberrant DNA methylation of CITED4 may play a role in breast tumourigenesis,8 suggesting that CITED4 is related to cancer-relevant cellular process.13 The function of CRH gene mainly adjusts to the stress response in the brain-gut axis in irritable bowel syndrome, intestinal inflammation14 and CRC.15 Hypermethylation of CA10 has also been explored as a novel biomarker for detecting breast cancer16 and bladder cancer.17 TMEM132D is a single-pass transmembrane protein.18 The coding products of TMEM132D were related to the mutual connection of nerve cells and signal transduction.19 Hypermethylation of TMEM132D was significantly associated with breast cancer.16
Epidemiological studies have disclosed that some diet factors were associated with disease prevention and CRC risk. For example, high intake of dietary fibre, fish can decrease CRC incidence, while high consumption of red meat, alcohol intake may increase CRC risk.20 Additionally, in vitro experiments have suggested that environmental exposure, such as arsenic, and specific dietary nutrition, including isoflavone, may disrupt epigenetic balance and cause methylation abnormalities, which are related to cancer susceptibility.21,22 However, there is a lack of information from the general population to clarify whether environmental factors alter CpG hypermethylation in blood, that is, susceptibility to CRC.
Heterogeneous DNA methylation is defined as the existence of multiple epialleles in a sample, each with a different profile of methylated and unmethylated CpG sites for a certain region.16 Recently, researchers have mainly focused on tumour tissues to explore the relationship between heterogeneous DNA methylation status and tumourigenesis16,23–26 and have suggested that heterogeneous DNA methylation may be an onset of epigenetic processes in tumour tissue.23 Furthermore, studies have demonstrated that environmental exposure27,28 and age29 may impact heterogeneous DNA methylation. Moreover, tumourigenesis is not an isolated phenomenon in its target tissue,30 and research has increasingly demonstrated that peripheral blood leukocyte DNA methylation might be measured as a substitution.31,32 Additionally, multiple epigenetic alterations in peripheral blood leukocytes were associated with CRC risk.33 However, no study has evaluated the association between heterogeneous DNA methylation, multiple CpG site heterogeneous methylation (MCSHM) and CRC in peripheral blood leukocytes.
Therefore, we proposed that DNA methylation status, multiple CpG site methylation (MCSM), MCSHM of blood leukocytes may be associated with risk of CRC. Based on this hypothesis, we carried out a case-control study to explore the association between DNA methylation status of individual genes, MCSM, MCSHM and the risk of CRC and assessed the effects of interactions between gene methylation and environmental factors on CRC susceptibility.
MATERIALS AND METHODS
1. Study subjects
Between June 2004 and June 2012, 466 sporadic CRC pathologically confirmed patients in the Cancer Hospital and the Second Affiliated Hospital of Harbin Medical University were selected as cases, and 507 non-digestive system disease patients were chosen as controls from the Second Affiliated Hospital of Harbin Medical University. Samples (5 mL) of peripheral blood were obtained from the 973 participants. Cases with a family history of CRC, metastatic colorectal carcinoma, preoperative radiation or chemotherapy were excluded. Severe organic disease and tumor patients were also excluded from the controls. All the study subjects provided informed consent and approved by the Human Research and Ethics Committee of Harbin Medical University. All experiments including interrelated details were consistent with the Helsinki Declaration in 2000.
All participants were interviewed face-to-face by well-trained interviewers using a structured questionnaire. Information about demographic characteristics, dietary status during the past 12 months (such as the intake of different kinds of meat, fried food and fruit), living habits (including cigarette smoking and duration of leisure physical activity) were collected.
2. Genomic DNA extraction and sodium bisulfite conversion
Genomic DNA was extracted using a Qiagen DNA Blood Mini Kit (Qiagen, Hilden, Germany) and was stored at −80°C. The absorption of ultraviolet light at wavelengths of 260 and 280 nm was measured by a Nanodrop 2000 Spectrophotometer (Thermo Scientific, Waltham, MA, USA) for determining the purity and concentration of DNA.
Genomic DNA was bisulfite-modified using the EpiTect Fast DNA Bisulfite kit (Qiagen). All operation steps were performed according to the manufacturer’s protocols. The eluted DNA (32 mL volume) in triplicate was used for methylation-sensitive high-resolution melting (MS-HRM) analysis. Backup bisulfite DNA was stored at −80°C. Bisulfite DNA at a concentration of 20 ng/mL was reserved at −20°C for the subsequent experiment, as it is crucial to avoid repeated freezing and thawing.
3. Methylation-sensitive high-resolution melting
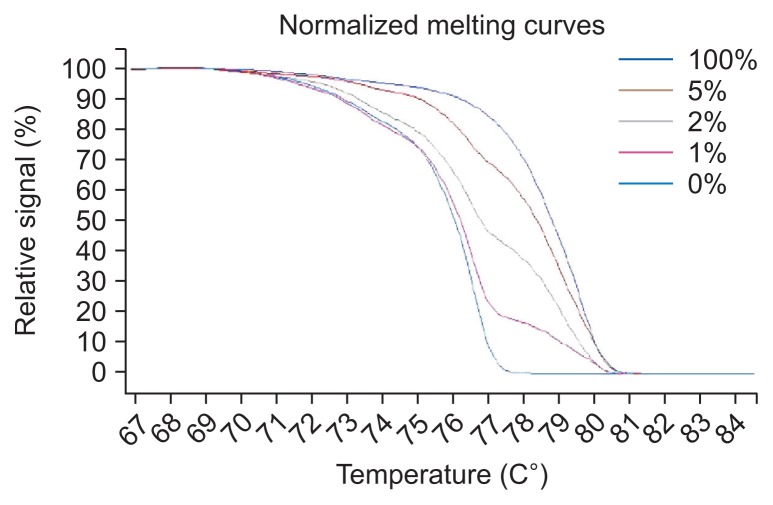
MS-HRM was performed on LightCycler 480 (Roche, Mannheim, Germany) equipment, and the data were analyzed using gene scanning and melting temperature (Tm) calling modules. Each reaction mixture contained 0.5 mL of bisulfite-treated DNA, 0.1 mL of each forward and reverse primer (10 mM), 2.5 mL of LightCycler 480 High Resolution Melting Master (Roche), 0.6 mL MgCl2 (25 mM) and 1.2 mL polymerase chain reaction (PCR)-grade water to a total volume of 5 mL. Universal unmethylated (0% methylated) and methylated (100% methylated) human whole genomic DNA samples (Zymo Research Corp., Irvine, CA, USA) were used as the control and calibrator samples, respectively. A series of standards, including 100%, 5%, 2%, 1%, and 0% methylated DNA, in a background of universal unmethylated DNA, were constructed by serially diluting the methylated control DNA into the unmethylated control according to mass concentration (Fig. 1). DNA-free distilled water was used as a negative control. Each amplified fragment was performed in duplicate for the unsure results. Five primer pairs were designed by Wojdacz et al.16 and Huang et al.8 The conditions and primer sequences are listed in Supplementary Table 1.
Fig. 1.
Standard curves for the CITED4 methylation-sensitive high-resolution melting assay.
4. Definition of methylation status, MCSM, and MCSHM
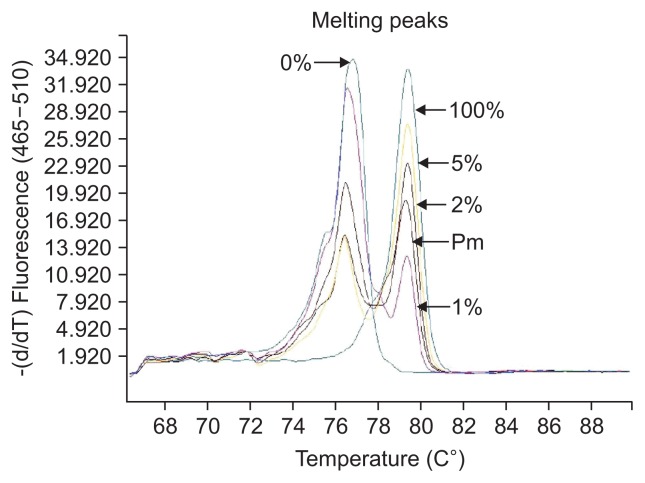
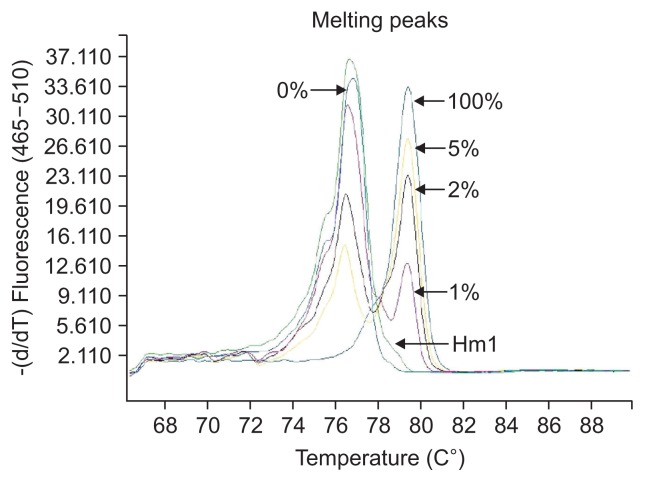
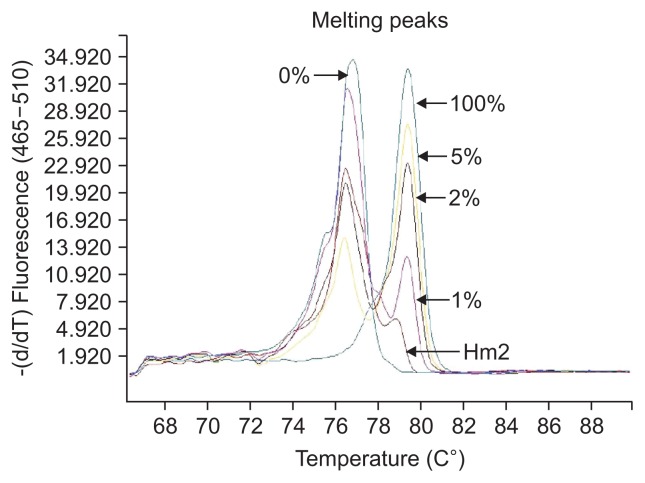
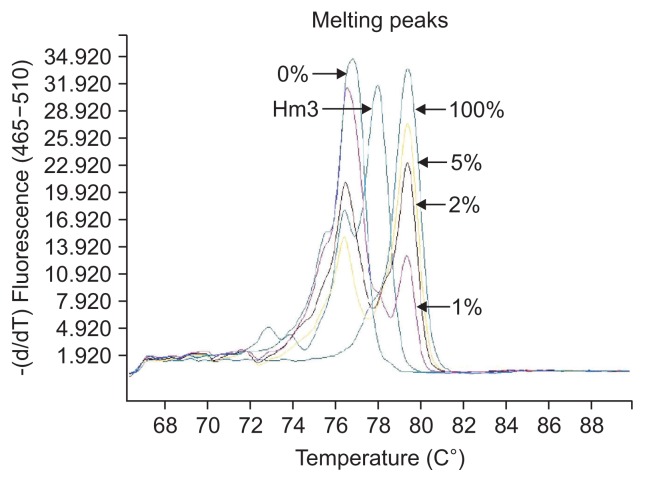
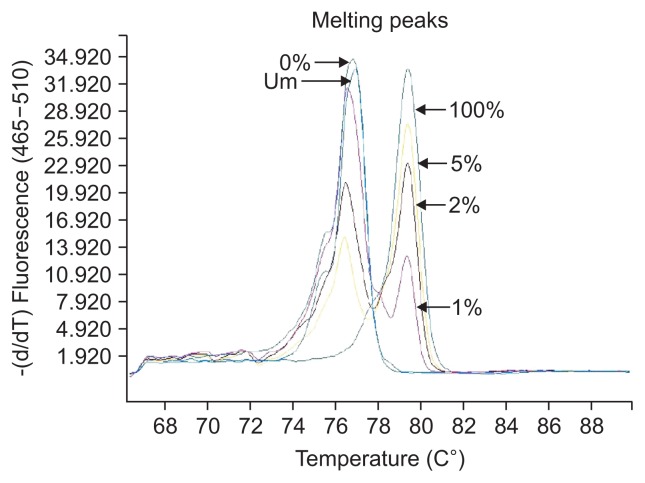
The definition of different methylation status was according to the various melting peaks. Each type was as follows (Figs 2–6): (1) Pm, positive methylation samples, namely homogeneous methylation, which could be semi-quantitative according to standard curves (Fig. 2); (2) Hm1, heterogeneous methylation 1 samples presented a wider peak than the unmethylation peak (Fig. 3); (3) Hm2, heterogeneous methylation two samples showed a methylation peak but before the real methylation melting profile (Fig. 4); (4) Hm3, heterogeneous methylation three samples presented a melting peak between unmethylation and the methylation profiles (Fig. 5); (5) Um, unmethylation sample profile was in line with the unmethylation peak (Fig. 6); (6) Thm, total heterogeneous methylation included Hm1, Hm2 and Hm3; (7) Tpm, total positive methylation was composed of Thm and Pm.
Fig. 2.
Positive methylation (Pm) of methylation-sensitive high-resolution melting profiles for the CA10 gene.
Fig. 3.
Heterogeneous methylation 1 (Hm1) of methylation-sensitive high-resolution melting profiles for the CA10 gene.
Fig. 4.
Heterogeneous methylation 2 (Hm2) of methylation-sensitive high-resolution melting profiles for the CA10 gene.
Fig. 5.
Heterogeneous methylation 3 (Hm3) of methylation-sensitive high-resolution melting profiles for the CA10 gene.
Fig. 6.
Unmethylation (Um) of methylation-sensitive high-resolution melting profiles for the CA10 gene.
For the MCSM definition, we ruled out CRH because the odds ratio (OR) for the total positive methylation (Tpm) of this gene was lower than 1 and had no statistical significance. It is worth mentioning that we proposed the use of TMEM132D to categorize MCSM-positive because the OR of the Tpm status of this gene was higher than 1 and was marginally statistically significant. Thus, four candidate gene biomarkers were analyzed in the MCSM panel. High-level MCSM (MCSM-H) was defined as three or more of the four candidate genes (WT1, CA10, CITED4 and TMEM132D) being methylated. Low-level MCSM (MCSM-L) was classified as no more than two of the four candidate genes being methylated. The incorporation of MCSM indicates that at least one gene was methylated, and genes with no methylated DNA biomarkers (non-MCSM) was considered the reference group.
Analogously, we excluded CRH because the OR of Thm was lower than 1. Although the OR of Thm for CITED4 was 1.087, its p-value had no statistical significance and was eliminated as well. Finally, we incorporated WT1, CA10 and TMEM132D as MCSHM. High-level MCSHM (MCSHM-H) was defined as two or more of the three candidate heterogeneous genes being methylated. Low-level MCSHM (MCSHM-L) was classified as no more than one of the three candidate heterogeneous genes being methylated. The incorporation of MCSHM means at least one heterogeneous gene was methylated, and genes with no heterogeneous DNA methylation biomarkers (non-MCSHM) was considered the reference group.
5. Pyrosequencing
To verify the accuracy of the HRM approach, we randomly selected two of the five different levels of methylation (>50%, 25%–50%, 10%–25%, 5%–10%, 0%) in colorectal tissue samples for pyrosequencing. The assay was operated on a PyroMark Q24 Advanced instrument (Qiagen), and the results of pyrosequencing were analyzed by PyroMark Q24 Advanced 3.0.0 software. The pyrosequencing primer sequences and analyzed sequences of WT1 are listed in Supplementary Table 2. The optimized cycling for PyroMark PCR and pyrosequencing were performed based on the manufacturer’s protocol.
6. Statistical analyses
The distribution of basic demographic characteristics, environmental factors, methylation status and clinical data between cases and controls were detected by chi-square test or t-test as appropriate. The associations between methylation status of candidate genes, MCSM, MCSHM and CRC susceptibility were analyzed by logistic regression. The difference between cases and controls, such as basic demographic characteristics and environmental factors were considered as confounding factors when multiple logistic regression was analyzed. The combined effects between environment factors and methylation of candidate genes on the risk of CRC were analyzed by the crossover method. Interactions between gene methylation and environmental factors were checked by multifactor dimensionality reduction (MDR) and multiple logistic regression methods. Spearman rank correlation coefficient and chi-square trend test (κ-value) were used for analysing the gene methylation results between HRM and pyrosequencing. All p-values were two-sided, and p<0.05 was considered statistically significant. Statistical analysis was conducted with SAS 9.1 (SAS Institute Inc., Cary, NC, USA), SPSS version 21.0 (IBM Corp., Armonk, NY, USA) and MDR software version 2.0 (Unix).
RESULTS
1. Characteristics of CRC patients and controls
This research study included 466 cases (285 males and 181 females) with a mean±standard deviation (SD) age of 60.1±11.5 and 507 controls (282 males and 225 females) with a mean±SD age of 56.7±10.9 (p=0.000) (Table 1). The proportion of patients who were overweight (body mass index [BMI] ≥23.0) among controls (63.0%) was higher than that among cases (52.4%, p=0.003).
Table 1.
Characteristics of Colorectal Cancer Patients and Controls
| Characteristic | Case (%) | Control (%) | p-value |
|---|---|---|---|
| Sex | 0.080 | ||
| Male | 285 (61.2) | 282 (55.6) | |
| Female | 181 (38.8) | 225 (44.4) | |
| Age, yr | 0.000 | ||
| Mean±SD | 60.1±11.5 | 56.7±10.9 | |
| <60 | 223 (47.9) | 308 (60.7) | |
| ≥60 | 243 (52.1) | 199 (39.3) | |
| Education level | 0.181 | ||
| Primary school or below | 125 (28.5) | 117 (23.9) | |
| Middle school | 132 (30.1) | 150 (30.6) | |
| Senior school | 94 (21.4) | 99 (20.2) | |
| College or above | 88 (20.0) | 124 (25.3) | |
| Occupation | 0.232 | ||
| White collar | 122 (26.2) | 116 (22.9) | |
| Blue collar | 344 (73.8) | 391 (77.1) | |
| Body mass index, kg/m2 | 0.003 | ||
| ≤18.5 | 38 (8.3) | 28 (5.6) | |
| 18.5–23.9 | 181 (39.3) | 157 (31.4) | |
| ≥24.0 | 241 (52.4) | 315 (63.0) | |
| Nation | |||
| Han people | 449 (97.2) | 426 (96.8) | 0.746 |
| Other | 13 (2.8) | 14 (3.2) | |
| Tumor location | |||
| Colon | 141 (35.1) | - | - |
| Rectum | 261 (64.9) | - | - |
| Pathogenic type | |||
| Protrude type | 239 (60.8) | - | - |
| Ulcerative type | 75 (19.1) | - | - |
| Other types | 79 (20.1) | - | - |
| Degree of differentiation | |||
| Low | 65 (16.1) | - | - |
| Medium | 312 (77.4) | - | - |
| High | 11 (2.7) | - | - |
| Unknown | 15 (3.7) | - | - |
| Histological type | |||
| Adenocarcinoma | 325 (80.6) | - | - |
| Other types | 78 (19.4) | - | - |
| Dukes stage | |||
| A | 42 (10.4) | - | - |
| B | 197 (48.9) | - | - |
| C | 132 (32.8) | - | - |
| D | 32 (7.9) | - | - |
2. Associations between environmental exposure and CRC risk
The intake of the various food groups and ORs for CRC are presented in Supplementary Table 3. After adjusting for BMI and age, individuals with higher intakes of pork, pork intestines, fried food, braised fish in brown sauce, sea food, and fruit can had a 1.424-, 3.390-, 1.610-, 2.005-, 1.757- and 1.688-fold increased risk of CRC when compared with controls. A significant reduction of CRC risk, associated with fruit and coarse grains were observed in case-control (adjusted OR [ORadjusted], 0.687; 95% confidence interval [CI], 0.526 to 0.897 and ORadjusted, 0.516; 95% CI, 0.391 to 0.682, respectively). After multifactor conditional logistic regression model, we found that the largest contribution factors to the model were fruit, garlic, pork intestines, fried food, coarse grains, braised fish in brown sauce and fruit can (Supplementary Table 4). All the factors included in the model coupled with BMI and age were considered as confounding factors.
3. Associations between the methylation status of five individual genes and CRC risk
Pm of WT1 (ORadjusted, 3.140; 95% CI, 2.204 to 4.872), CA10 (ORadjusted, 4.202; 95% CI, 2.348 to 7.519) and CITED4 (ORadjusted, 6.041; 95% CI, 2.785 to 13.102) were related to CRC risk. All five genes in our panel had heterogeneous methylation ranging from 5% to 59%. Thm of WT1 and CA10 were statistically positively associated with CRC (ORadjusted, 1.831; 95% CI, 1.100 to 3.047; ORadjusted, 5.445; 95% CI, 3.075 to 9.643, respectively), whereas CRH was statistically negatively associated with CRC (ORadjusted, 0.400; 95% CI, 0.178 to 0.899) (Table 2). Statistically significant associations between Tpm of CA10, CITED4, and WT1 and CRC risk were observed before and after adjusting for confounding factors.
Table 2.
Associations among the Methylation Status of Candidate Genes, MCSM, MCSHM, and CRC Susceptibility
| Methylation status | Case (%) | Control (%) | Crude OR (95% CI) | p-value | ORadjusted (95% CI)* | p-value | ORadjusted (95% CI)† | p-value |
|---|---|---|---|---|---|---|---|---|
| CA10 | ||||||||
| Um | 47 (10.1) | 146 (29.7) | 1.000 | 1.000 | 1.000 | |||
| Pm | 185 (39.9) | 180 (36.7) | 3.193 (2.167–4.704) | 0.000 | 3.136 (2.117–4.645) | 0.000 | 4.202 (2.348–7.519) | 0.000 |
| Hm1 | 111 (23.9) | 81 (16.5) | 4.257 (2.753–6.583) | 0.000 | 4.197 (2.694–6.540) | 0.000 | 4.913 (2.534–9.527) | 0.000 |
| Hm2 | 53 (11.4) | 61 (12.4) | 2.699 (1.648–4.421) | 0.000 | 2.632 (1.598–4.335) | 0.000 | 2.504 (1.209–5.186) | 0.014 |
| Hm3 | 68 (14.7) | 23 (4.7) | 9.184 (5.164–16.335) | 0.000 | 8.514 (4.743–15.282) | 0.000 | 15.668 (7.341–33.441) | 0.000 |
| Thm | 232 (50.0) | 165 (33.6) | 4.368 (2.973–6.416) | 0.000 | 4.209 (2.848–6.221) | 0.000 | 5.445 (3.075–9.643) | 0.000 |
| Tpm | 417 (89.9) | 345 (70.3) | 3.755 (2.624–5.373) | 0.000 | 3.647 (2.537–5.244) | 0.000 | 4.831 (2.819–8.278) | 0.000 |
| CRH | ||||||||
| Um | 26 (5.6) | 20 (4.1) | 1.000 | 1.000 | 1.000 | |||
| Pm | 165 (35.7) | 143 (29.0) | 0.888 (0.475–1.657) | 0.708 | 0.839 (0.444–1.585) | 0.589 | 0.808 (0.356–1.833) | 0.610 |
| Hm1 | 213 (46.1) | 192 (38.9) | 0.853 (0.461–1.578) | 0.613 | 0.915 (0.489–1.712) | 0.782 | 0.605 (0.264–1.384) | 0.234 |
| Hm2 | 41 (8.9) | 65 (13.2) | 0.485 (0.240–0.979) | 0.043 | 0.504 (0.247–1.029) | 0.060 | 0.188 (0.069–0.513) | 0.001 |
| Hm3 | 17 (3.7) | 73 (14.8) | 0.179 (0.082–0.393) | 0.000 | 0.182 (0.082–0.404) | 0.000 | 0.132 (0.044–0.394) | 0.000 |
| Thm | 271 (58.7) | 330 (66.9) | 0.632 (0.345–1.156) | 0.137 | 0.666 (0.360–1.230) | 0.194 | 0.400 (0.178–0.899) | 0.027 |
| Tpm | 436 (94.4) | 473 (95.9) | 0.709 (0.390–1.288) | 0.259 | 0.721 (0.393–1.324) | 0.291 | 0.542 (0.246–1.194) | 0.128 |
| TMEM132D | ||||||||
| Um | 120 (26.0) | 127 (25.8) | 1.000 | 1.000 | 1.000 | |||
| Pm | 74 (16.0) | 70 (14.2) | 1.119 (0.742–1.688) | 0.593 | 1.024 (0.670–1.563) | 0.914 | 1.428 (0.767–2.659) | 0.261 |
| Hm1 | 151 (32.7) | 148 (30.1) | 1.080 (0.771–1.513) | 0.655 | 1.072 (0.760–1.513) | 0.691 | 1.708 (1.037–2.815) | 0.036 |
| Hm2 | 41 (8.9) | 80 (16.3) | 0.542 (0.345–0.852) | 0.008 | 0.467 (0.293–0.743) | 0.001 | 0.566 (0.288–1.113) | 0.099 |
| Hm3 | 76 (16.5) | 67 (13.6) | 1.200 (0.795–1.813) | 0.385 | 1.087 (0.713–1.658) | 0.698 | 2.696 (1.498–4.852) | 0.001 |
| Thm | 268 (58.0) | 295 (60.0) | 0.961 (0.713–1.297) | 0.797 | 0.908 (0.669–1.234) | 0.539 | 1.542 (0.991–2.400) | 0.055 |
| Tpm | 342 (74.0) | 365 (74.2) | 0.992 (0.742–1.325) | 0.955 | 0.932 (0.693–1.253) | 0.640 | 1.520 (0.988–2.340) | 0.057 |
| CITED4 | ||||||||
| Um | 387 (84.7) | 398 (88.2) | 1.000 | 1.000 | 1.000 | |||
| Pm | 56 (12.3) | 19 (4.2) | 3.031 (1.7680–5.195) | 0.000 | 2.772 (1.604–4.790) | 0.000 | 6.041 (2.785–13.102) | 0.000 |
| Hm1 | 4 (0.9) | 30 (6.7) | 0.137 (0.048–0.393) | 0.000 | 0.134 (0.047–0.386) | 0.000 | 0.423 (0.125–1.438) | 0.168 |
| Hm2 | 8 (1.8) | 4 (0.9) | 2.057 (0.614–6.886) | 0.242 | 2.023 (0.593–6.895) | 0.260 | 2.698 (0.567–12.850) | 0.213 |
| Hm3 | 2 (0.4) | 0 | - | - | - | - | - | - |
| Thm | 14 (3.1) | 34 (7.5) | 0.423 (0.224–0.801) | 0.008 | 0.416 (0.218–0.793) | 0.008 | 1.087 (0.457–2.586) | 0.851 |
| Tpm | 70 (15.3) | 53 (11.8) | 1.358 (0.926–1.993) | 0.117 | 1.270 (0.859–1.877) | 0.231 | 2.962 (1.675–5.239) | 0.000 |
| WT1 | ||||||||
| Um | 145 (31.5) | 195 (40.2) | 1.000 | 1.000 | 1.000 | |||
| Pm | 235 (51.0) | 169 (34.8) | 1.870 (1.396–2.504) | 0.000 | 1.741 (1.291–2.347) | 0.000 | 3.140 (2.024–4.872) | 0.000 |
| Hm1 | 14 (3.0) | 45 (9.3) | 0.418 (0.221–0.791) | 0.007 | 0.391 (0.205–0.748) | 0.005 | 1.507 (0.649–3.496) | 0.340 |
| Hm2 | 62 (13.4) | 69 (14.2) | 1.208 (0.806–1.811) | 0.359 | 1.150 (0.761–1.738) | 0.508 | 1.980 (1.113–3.523) | 0.020 |
| Hm3 | 5 (1.1) | 7 (1.4) | 0.961 (0.299–3.088) | 0.946 | 0.883 (0.269–2.900) | 0.838 | 1.755 (0.416–7.404) | 0.444 |
| Thm | 81 (17.6) | 121 (24.9) | 0.900 (0.632–1.283) | 0.561 | 0.852 (0.593–1.223) | 0.385 | 1.831 (1.100–3.047) | 0.020 |
| Tpm | 316 (68.5) | 290 (59.8) | 1.465 (1.121–1.915) | 0.005 | 1.374 (1.044–1.807) | 0.023 | 2.590 (1.730–3.878) | 0.000 |
| MCSM | ||||||||
| Non-MCSM | 17 (3.8) | 29 (6.7) | 1.000 | 1.000 | 1.000 | |||
| MCSM-L | 182 (40.7) | 208 (48.1) | 1.493 (0.794–2.805) | 0.213 | 1.403 (0.741–2.658) | 0.299 | 1.430 (0.504–4.054) | 0.501 |
| MCSM-H | 248 (55.5) | 195 (45.1) | 2.170 (1.158–4.063) | 0.016 | 1.936 (1.024–3.657) | 0.042 | 4.318 (1.529–12.197) | 0.006 |
| MCSM | 430 (96.2) | 403 (93.3) | 1.820 (0.985–3.363) | 0.056 | 1.659 (0.890–3.092) | 0.111 | 2.528 (0.921–6.939) | 0.072 |
| MCSHM | ||||||||
| Non-MCSHM | 17 (15.0) | 29 (18.0) | 1.000 | 1.000 | 1.000 | |||
| MCSHM-L | 32 (28.3) | 45 (28.0) | 1.213 (0.573–2.570) | 0.614 | 1.180 (0.545–2.557) | 0.675 | 1.153 (0.335–3.969) | 0.821 |
| MCSHM-H | 64 (56.6) | 87 (54.0) | 1.255 (0.636–2.477) | 0.513 | 1.110 (0.551–2.234) | 0.771 | 1.396 (0.438–4.449) | 0.573 |
| MCSHM | 96 (85.0) | 132 (82.0) | 1.241 (0.645–2.386) | 0.518 | 1.133 (0.579–2.217) | 0.716 | 1.297 (0.427–3.942) | 0.647 |
MCSM, multiple CpG site methylation; MCSHM, multiple CpG site heterogeneous methylation; CRC, colorectal cancer; OR, odds ratio; CI, confidence interval; Um, unmethylation; Pm, positive methylation; Hm1, heterogeneous methylation 1; Hm2, heterogeneous methylation 2; Hm3, heterogeneous methylation 3; Thm, total heterogeneous methylation; Tpm, total positive methylation; MCSM-L, low-level MCSM; MCSM-H, high-level MCSM; MCSHM-L, low-level MCSHM; MCSHM-H, high-level MCSHM.
ORadjusted, ORs adjusted for body mass index (BMI) and age;
ORadjusted, ORs adjusted for BMI, age, fruit, coarse grains, fruit can, pork intestines, fried food, garlic, and braised fish in brown sauce.
Age stratification analysis indicated that hypermethylation of WT1 was associated with positive risk of CRC only in the younger group (ORadjusted, 1.516; 95% CI, 1.055 to 2.177) (Table 3). Hypermethylation of CA10 was significantly associated with a higher risk of CRC in both the younger and older group (ORadjusted, 4.021; 95% CI, 2.463 to 6.566; ORadjusted, 3.207; 95% CI, 1.859 to 5.530, respectively), with stronger associations in the younger group.
Table 3.
Association between Methylation, MCSM, MCSHM of Genes and Risk of CRC by Age
| Gene | <60 yr | ≥60 yr | ||||
|---|---|---|---|---|---|---|
|
|
|
|||||
| OR* | 95% CI | p-value | OR* | 95% CI | p-value | |
| Genes methylation† | ||||||
| CA10 | 4.021 | 2.463–6.566 | 0.000 | 3.207 | 1.859–5.530 | 0.000 |
| CRH | 0.830 | 0.363–1.898 | 0.658 | 0.600 | 0.239–1.508 | 0.277 |
| TMEM132D | 0.998 | 0.677–1.471 | 0.992 | 0.844 | 0.531–1.342 | 0.474 |
| CITED4 | 1.209 | 0.684–2.135 | 0.514 | 1.327 | 0.773–2.277 | 0.305 |
| WT1 | 1.516 | 1.055–2.177 | 0.024 | 1.201 | 0.788–1.832 | 0.395 |
| MCSM | ||||||
| MCSM-L | 1.826 | 0.777–4.287 | 0.167 | 0.927 | 0.327–2.632 | 0.887 |
| MCSM-H | 2.759 | 1.170–6.509 | 0.020 | 1.158 | 0.415–3.230 | 0.780 |
| MCSM | 2.216 | 0.962–5.103 | 0.062 | 1.060 | 0.385–2.919 | 0.909 |
| MCSHM | ||||||
| MCSHM-L | 1.495 | 0.551–4.053 | 0.430 | 0.814 | 0.228–2.905 | 0.751 |
| MCSHM-H | 1.347 | 0.526–3.449 | 0.535 | 0.837 | 0.280–2.505 | 0.751 |
| MCSHM | 1.404 | 0.576–3.421 | 0.455 | 0.831 | 0.285–2.429 | 0.736 |
MCSM, multiple CpG site methylation; MCSHM, multiple CpG site heterogeneous methylation; CRC, colorectal cancer; OR, odds ratio; CI, confidence interval; MCSM-L, low-level MCSM; MCSM-H, high-level MCSM; MCSHM-L, low-level MCSHM; MCSHM-H, high-level MCSHM.
ORadjusted, ORs adjusted for body mass index;
All the ORs were calculated by selecting unmethylation as a reference group and total positive methylation as a positive group.
4. Association between MCSM, MCSHM status and CRC risk
Methylation levels in 90.3% patients (879/973) were successfully assessed for all five genes (Table 2). Subjects with MCSM-H had a 4.318-fold increased risk of CRC compared with non-MCSM (95% CI, 1.529 to 12.197; p=0.006). However, we did not observe statistically significant differences in MCSM and MCSM-L groups when contrasted with the non-MCSM group (ORadjusted, 2.528; 95% CI, 0.921 to 6.939; ORadjusted, 1.430; 95% CI, 0.504 to 4.054; respectively). In younger subjects, MCSM-H indicated a significantly increased susceptibility to CRC (ORadjusted, 2.759; 95% CI, 1.170 to 6.509), whereas there was no relationship predicting CRC risk in older subjects (ORadjusted, 1.158; 95% CI, 0.415 to 3.230) (Table 3). Moreover, we did not find statistically significant associations predicting CRC risk in cancer-free controls or within either age stratification for MCSHM (Tables 2 and 3).
5. The interactions between environmental exposure and individual gene methylation, MCSM and MCSHM on the risk of CRC
Significant synergistic effects between CRH hypermethylation and intake of fruit (>2 times/wk) on risk of CRC were observed (odds ratio for interaction of environmental factor and gene methylation [ORi], 4.849; 95% CI, 1.229 to 19.136; p=0.024). Additionally, for WT1 hypermethylation, an antagonistic interaction with fruit intake (>2 times/wk) was found (ORi, 0.380; 95% CI, 0.216 to 0.669; p=0.001). Furthermore, MCSM showed a statistically significant synergistic interaction with fruit intake (>2 times/wk: ORi, 0.269; 95% CI, 0.075 to 0.964; p=0.044) (Supplementary Table 5). The model that evaluated the relationship between the five individual genes, MCSM, MCSHM and environmental factors in CRC are shown in Supplementary Tables 5–11.
We firstly applied MDR algorithms to explore the interaction between gene methylation and environmental factors for which an interaction might be possible. Then, MDR was used to analyze the interaction between seven dietary factors that were statistically significant in multiple logistic regression and the methylation status of five candidate genes. However, there was no best interaction model (data not shown).
6. Validation of the methylation results
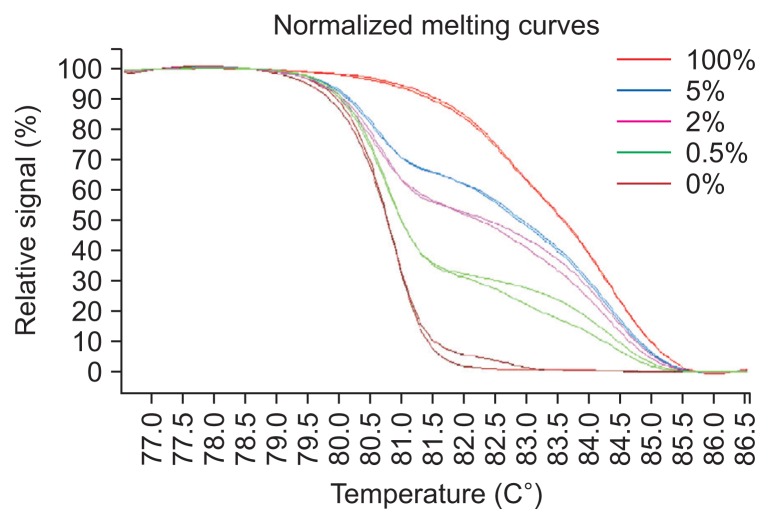
Pyrosequencing is the gold standard to detect methylation levels. To validate the accuracy of the HRM results, we extracted two cases for each of the five methylation levels (>50%, 25%–50%, 10%–25%, 5%–10%, and 0%) in tissue samples and found strong associations between the two techniques (Spearman correlation test, r=0.911, p<0.05). We set the cutoff value of pyrosequencing results at 80 and divided HRM results into 0%, 5% to 10% and >10% to test the consistency of the HRM and pyrosequencing results. We discovered high consistency (chi-square trend test, κ-value=0.833, p=0.000) between the two methods. The original HRM and pyrosequencing results are listed in Supplementary Table 12. Additionally, we analyzed standard curves of 100%, 5.0%, 2.0%, 0.5%, 0% in duplicate to verify the variability of HRM results and we observed a good reproducibility (Fig. 7).
Fig. 7.
Verification of the accuracy of the methylation-sensitive high-resolution melting approach for the WT1 gene.
DISCUSSION
Changes in the DNA methylation status, including locus-specific hypermethylation and global DNA hypomethylation, are common epigenetic alterations in carcinogenesis.16 Large studies of DNA methylation have investigated different methylation levels between tumours and adjacent tissues.23,26 There is considerable evidence that methylation changes in cancer patients appear systematically and can be measured in surrogate tissues.31,32 Alterations in blood-derived DNA methylation may explain the response of the haematopoietic systems to tumourigenesis and may be partially explained by systemic differences in the methylation signatures of leukocyte subpopulations in tumourigenesis.34 Besides, peripheral blood is much easier to obtain than tissue. However, less is known about whether leukocyte DNA methylation can be applied as a biomarker for CRC, especially for MCSM assessment. Our results indicated a positive relationship between hypermethylation of multiple loci in blood-derived DNA and the risk of CRC. Compared with the non-MCSM group, subjects with MCSM-H implied a 4.318-fold higher risk of CRC. This phenomenon is similar to that observed in our previous study in which MCSM-H indicated a 1.79-fold higher risk for CRC in patients than in cancer-free controls.33 The MCSM-H of peripheral blood leukocytes, which are composed of multiple methylated genes, might demonstrate systematic variation of hypermethylation in subjects and could be more suitable for assessment of the risk of CRC in the aspect of cancer screening for high-risk population, individual prevention and individualized treatment.
Heterogeneous methylation was previously confirmed to happen in different cancer tissues.16,24–26 However, this phenomenon has never been researched extensively in a massive sample and panel loci in peripheral blood leukocytes for CRC. MS-HRM measures the melting behaviour of DNA duplexes.35 Based on normalized melting curves and Tm values of the PCR product, methylation status can be defined.24,26,36 As far as we know, this instance is the first time a study has revealed loci to have four types of methylation during CRC tumourigenesis, with some loci going through heterogeneous methylation and others undergoing homozygous methylation in a large sample size. Our data showed that all of the candidate genes had different extent heterogeneous methylation. However, we found no association between MCSHM and CRC risk or in age stratification. The mechanism of heterogeneous methylation leading to gene silencing is still obscure. Nevertheless, a hypothesis that heterogeneous methylation may be a “passenger” that interferes with transcription processes has been proposed,16 and heterogeneous methylation may play an important role in tumour development25 through perturbing the transcriptome in CRC.37
Exploring the interactions between dietary factors and genes for complex diseases has an important implication in disease prevention for public health. In this research, we found significant antagonistic interaction between increased consumption of fruit and the methylation of WT1, MCSM, on the risk of CRC. Folic acid, rich in fruits, regulates DNA methylation of cytosine within the CpG sequences because of its role in the supplying synthesized S-adenosyl methionine.38 Deficiency in folic acid may result in aberrant hypermethylation of normally unmethylated CpG sites.39 Our results showed that braised fish in brown sauce and fried food had a significant combined effect on the methylation of most candidate genes as well as on MCSM and MCSHM. Braised fish in brown sauce and fried foods are high temperature cooking foods that can lead to the formation of polycyclic aromatic hydrocarbons (PAHs).40 Benzo(a)pyrene (BaP) is a type of PAHs, and hypermethylation may increase BaP-induced DNA damage through preferentially binding to methylated CpG dinucleotides of reactive metabolic intermediates.41 Whole grains contain choline that can help improve lipid status through preventing fat deposition in the liver and in balancing DNA methylation in the liver and colon.42 This phenomenon may explain the interaction between coarse grains and CRH and TMEM132D gene methylation predicting on CRC risk.
There were certain limitations of this research. First, we divided dietary components into only two levels to unify the standardization that may lead to some information loss. Second, due to limited technology, HRM can only measure qualitative heterogeneous methylation and cannot quantitatively assess methylation level. Therefore, a precise method for measuring the quantitative heterogeneous methylation level is needed in future research. However, we and other previous research have demonstrated that HRM has the ability to test low methylation levels43 and testified to its sensitivity and specificity when compared with pyrosequencing.33 Third, we were unable to confirm possible mechanisms affecting methylation differences between cases and controls, including environmental factors and a sub-population of peripheral blood leukocytes. Additionally, deeper investigations should concentrate on the evaluation of whether the observed differences occur as a result of, or prior to, tumourigenesis.
In conclusion, our study suggested that the DNA methylation status of blood leukocytes may be associated with susceptibility to CRC. The MCSM-H of blood leukocytes may be associated with CRC risk, especially in younger people. Environmental factors may interact with gene methylation, which may trigger CRC.
Supplementary Material
ACKNOWLEDGEMENTS
This work was funded by National Natural Science Foundation of China (grant numbers: 30972539, 30671801, and 81473055).
Footnotes
CONFLICTS OF INTEREST
No potential conflict of interest relevant to this article was reported.
REFERENCES
- 1.Torre LA, Bray F, Siegel RL, Ferlay J, Lortet-Tieulent J, Jemal A. Global cancer statistics, 2012. CA Cancer J Clin. 2015;65:87–108. doi: 10.3322/caac.21262. [DOI] [PubMed] [Google Scholar]
- 2.Grady WM, Carethers JM. Genomic and epigenetic instability in colorectal cancer pathogenesis. Gastroenterology. 2008;135:1079–1099. doi: 10.1053/j.gastro.2008.07.076. [DOI] [PMC free article] [PubMed] [Google Scholar]
- 3.Storosum JG, van Zwieten BJ, Wohlfarth T, de Haan L, Khan A, van den Brink W. Suicide risk in placebo vs active treatment in placebo-controlled trials for schizophrenia. Arch Gen Psychiatry. 2003;60:365–368. doi: 10.1001/archpsyc.60.4.365. [DOI] [PubMed] [Google Scholar]
- 4.Wong JJ, Hawkins NJ, Ward RL. Colorectal cancer: a model for epigenetic tumorigenesis. Gut. 2007;56:140–148. doi: 10.1136/gut.2005.088799. [DOI] [PMC free article] [PubMed] [Google Scholar]
- 5.Sakai E, Nakajima A, Kaneda A. Accumulation of aberrant DNA methylation during colorectal cancer development. World J Gastroenterol. 2014;20:978–987. doi: 10.3748/wjg.v20.i4.978. [DOI] [PMC free article] [PubMed] [Google Scholar]
- 6.Oji Y, Yamamoto H, Nomura M, et al. Overexpression of the Wilms’ tumor gene WT1 in colorectal adenocarcinoma. Cancer Sci. 2003;94:712–717. doi: 10.1111/j.1349-7006.2003.tb01507.x. [DOI] [PMC free article] [PubMed] [Google Scholar]
- 7.Hiltunen MO, Koistinaho J, Alhonen L, et al. Hypermethylation of the WT1 and calcitonin gene promoter regions at chromosome 11p in human colorectal cancer. Br J Cancer. 1997;76:1124–1130. doi: 10.1038/bjc.1997.522. [DOI] [PMC free article] [PubMed] [Google Scholar]
- 8.Huang KT, Takano EA, Mikeska T, Byrne DJ, Dobrovic A, Fox SB. Aberrant DNA methylation but not mutation of CITED4 is associated with alteration of HIF-regulated genes in breast cancer. Breast Cancer Res Treat. 2011;130:319–329. doi: 10.1007/s10549-011-1657-1. [DOI] [PubMed] [Google Scholar]
- 9.Pan X, Bowman M, Scott RJ, et al. Methylation of the corticotropin releasing hormone gene promoter in BeWo cells: relationship to gene activity. Int J Endocrinol. 2015;2015:861302. doi: 10.1155/2015/861302. [DOI] [PMC free article] [PubMed] [Google Scholar]
- 10.Aspatwar A, Tolvanen ME, Parkkila S. An update on carbonic anhydrase-related proteins VIII, X and XI. J Enzyme Inhib Med Chem. 2013;28:1129–1142. doi: 10.3109/14756366.2012.727813. [DOI] [PubMed] [Google Scholar]
- 11.Ruiz S, Diep D, Gore A, et al. Identification of a specific reprogramming-associated epigenetic signature in human induced pluripotent stem cells. Proc Natl Acad Sci U S A. 2012;109:16196–16201. doi: 10.1073/pnas.1202352109. [DOI] [PMC free article] [PubMed] [Google Scholar]
- 12.Bejrananda T, Phukaoloun M, Boonpipattanapong T, et al. WT1 expression as an independent marker of poor prognosis in colorectal cancers. Cancer Biomark. 2010–2011;8:35–42. doi: 10.3233/DMA-2011-0822. [DOI] [PubMed] [Google Scholar]
- 13.Tews B, Roerig P, Hartmann C, et al. Hypermethylation and transcriptional downregulation of the CITED4 gene at 1p34.2 in oligodendroglial tumours with allelic losses on 1p and 19q. Oncogene. 2007;26:5010–5016. doi: 10.1038/sj.onc.1210297. [DOI] [PubMed] [Google Scholar]
- 14.Fukudo S. Role of corticotropin-releasing hormone in irritable bowel syndrome and intestinal inflammation. J Gastroenterol. 2007;42(Suppl 17):48–51. doi: 10.1007/s00535-006-1942-7. [DOI] [PubMed] [Google Scholar]
- 15.Im E. Corticotropin-releasing hormone and its biological diversity toward angiogenesis. Intest Res. 2014;12:96–102. doi: 10.5217/ir.2014.12.2.96. [DOI] [PMC free article] [PubMed] [Google Scholar]
- 16.Wojdacz TK, Windeløv JA, Thestrup BB, Damsgaard TE, Overgaard J, Hansen L. Identification and characterization of locus-specific methylation patterns within novel loci undergoing hypermethylation during breast cancer pathogenesis. Breast Cancer Res. 2014;16:R17. doi: 10.1186/bcr3612. [DOI] [PMC free article] [PubMed] [Google Scholar]
- 17.Chung W, Bondaruk J, Jelinek J, et al. Detection of bladder cancer using novel DNA methylation biomarkers in urine sediments. Cancer Epidemiol Biomarkers Prev. 2011;20:1483–1491. doi: 10.1158/1055-9965.EPI-11-0067. [DOI] [PMC free article] [PubMed] [Google Scholar]
- 18.Erhardt A, Akula N, Schumacher J, et al. Replication and meta-analysis of TMEM132D gene variants in panic disorder. Transl Psychiatry. 2012;2:e156. doi: 10.1038/tp.2012.85. [DOI] [PMC free article] [PubMed] [Google Scholar]
- 19.Nomoto H, Yonezawa T, Itoh K, et al. Molecular cloning of a novel transmembrane protein MOLT expressed by mature oligodendrocytes. J Biochem. 2003;134:231–238. doi: 10.1093/jb/mvg135. [DOI] [PubMed] [Google Scholar]
- 20.Gonzalez CA, Riboli E. Diet and cancer prevention: contributions from the European Prospective Investigation into Cancer and Nutrition (EPIC) study. Eur J Cancer. 2010;46:2555–2562. doi: 10.1016/j.ejca.2010.07.025. [DOI] [PubMed] [Google Scholar]
- 21.Armaghany T, Wilson JD, Chu Q, Mills G. Genetic alterations in colorectal cancer. Gastrointest Cancer Res. 2012;5:19–27. [PMC free article] [PubMed] [Google Scholar]
- 22.Sarasqueta AF, Forte G, Corver WE, et al. Integral analysis of p53 and its value as prognostic factor in sporadic colon cancer. BMC Cancer. 2013;13:277. doi: 10.1186/1471-2407-13-277. [DOI] [PMC free article] [PubMed] [Google Scholar]
- 23.Azhikina T, Kozlova A, Skvortsov T, Sverdlov E. Heterogeneity and degree of TIMP4, GATA4, SOX18, and EGFL7 gene promoter methylation in non-small cell lung cancer and surrounding tissues. Cancer Genet. 2011;204:492–500. doi: 10.1016/j.cancergen.2011.07.010. [DOI] [PubMed] [Google Scholar]
- 24.Candiloro IL, Mikeska T, Hokland P, Dobrovic A. Rapid analysis of heterogeneously methylated DNA using digital methylation-sensitive high resolution melting: application to the CDKN2B (p15) gene. Epigenetics Chromatin. 2008;1:7. doi: 10.1186/1756-8935-1-7. [DOI] [PMC free article] [PubMed] [Google Scholar]
- 25.Kristensen LS, Wojdacz TK, Thestrup BB, Wiuf C, Hager H, Hansen LL. Quality assessment of DNA derived from up to 30 years old formalin fixed paraffin embedded (FFPE) tissue for PCR-based methylation analysis using SMART-MSP and MS-HRM. BMC Cancer. 2009;9:453. doi: 10.1186/1471-2407-9-453. [DOI] [PMC free article] [PubMed] [Google Scholar]
- 26.Lim AM, Candiloro IL, Wong N, et al. Quantitative methodology is critical for assessing DNA methylation and impacts on correlation with patient outcome. Clin Epigenetics. 2014;6:22. doi: 10.1186/1868-7083-6-22. [DOI] [PMC free article] [PubMed] [Google Scholar]
- 27.Pisanic TR, 2nd, Athamanolap P, Wang TH. Defining, distinguishing and detecting the contribution of heterogeneous methylation to cancer heterogeneity. Semin Cell Dev Biol. 2017;64:5–17. doi: 10.1016/j.semcdb.2016.08.030. [DOI] [PMC free article] [PubMed] [Google Scholar]
- 28.Ambatipudi S, Cuenin C, Hernandez-Vargas H, et al. Tobacco smoking-associated genome-wide DNA methylation changes in the EPIC study. Epigenomics. 2016;8:599–618. doi: 10.2217/epi-2016-0001. [DOI] [PubMed] [Google Scholar]
- 29.Zheng SC, Widschwendter M, Teschendorff AE. Epigenetic drift, epigenetic clocks and cancer risk. Epigenomics. 2016;8:705–719. doi: 10.2217/epi-2015-0017. [DOI] [PubMed] [Google Scholar]
- 30.Marsit C, Christensen B. Blood-derived DNA methylation markers of cancer risk. Adv Exp Med Biol. 2013;754:233–252. doi: 10.1007/978-1-4419-9967-2_12. [DOI] [PubMed] [Google Scholar]
- 31.Dauksa A, Gulbinas A, Endzinas Z, Oldenburg J, El-Maarri O. DNA methylation at selected CpG sites in peripheral blood leukocytes is predictive of gastric cancer. Anticancer Res. 2014;34:5381–5388. [PubMed] [Google Scholar]
- 32.Woo HD, Kim J. Global DNA hypomethylation in peripheral blood leukocytes as a biomarker for cancer risk: a meta-analysis. PLoS One. 2012;7:e34615. doi: 10.1371/journal.pone.0034615. [DOI] [PMC free article] [PubMed] [Google Scholar]
- 33.Luo X, Huang R, Sun H, et al. Methylation of a panel of genes in peripheral blood leukocytes is associated with colorectal cancer. Sci Rep. 2016;6:29922. doi: 10.1038/srep29922. [DOI] [PMC free article] [PubMed] [Google Scholar]
- 34.Koestler DC, Marsit CJ, Christensen BC, et al. Peripheral blood immune cell methylation profiles are associated with nonhematopoietic cancers. Cancer Epidemiol Biomarkers Prev. 2012;21:1293–1302. doi: 10.1158/1055-9965.EPI-12-0361. [DOI] [PMC free article] [PubMed] [Google Scholar]
- 35.Mikeska T, Candiloro IL, Dobrovic A. The implications of heterogeneous DNA methylation for the accurate quantification of methylation. Epigenomics. 2010;2:561–573. doi: 10.2217/epi.10.32. [DOI] [PubMed] [Google Scholar]
- 36.Wojdacz TK, Møller TH, Thestrup BB, Kristensen LS, Hansen LL. Limitations and advantages of MS-HRM and bisulfite sequencing for single locus methylation studies. Expert Rev Mol Diagn. 2010;10:575–580. doi: 10.1586/erm.10.46. [DOI] [PubMed] [Google Scholar]
- 37.Wang Q, Jia P, Cheng F, Zhao Z. Heterogeneous DNA methylation contributes to tumorigenesis through inducing the loss of coexpression connectivity in colorectal cancer. Genes Chromosomes Cancer. 2015;54:110–121. doi: 10.1002/gcc.22224. [DOI] [PMC free article] [PubMed] [Google Scholar]
- 38.Kim YI. Nutritional epigenetics: impact of folate deficiency on DNA methylation and colon cancer susceptibility. J Nutr. 2005;135:2703–2709. doi: 10.1093/jn/135.11.2703. [DOI] [PubMed] [Google Scholar]
- 39.Zhu K, Davidson NE, Hunter S, et al. Methyl-group dietary intake and risk of breast cancer among African-American women: a case-control study by methylation status of the estrogen receptor alpha genes. Cancer Causes Control. 2003;14:827–836. doi: 10.1023/B:CACO.0000003823.97506.be. [DOI] [PubMed] [Google Scholar]
- 40.Larsson BK. Formation of polycyclic aromatic hydrocarbons during the smoking and grilling of food. Prog Clin Biol Res. 1986;206:169–180. [PubMed] [Google Scholar]
- 41.Tretyakova N, Guza R, Matter B. Endogenous cytosine methylation and the formation of carcinogen carcinogen-DNA adducts. Nucleic Acids Symp Ser (Oxf) 2008;(52):49–50. doi: 10.1093/nass/nrn025. [DOI] [PubMed] [Google Scholar]
- 42.Fardet A. New hypotheses for the health-protective mechanisms of whole-grain cereals: what is beyond fibre? Nutr Res Rev. 2010;23:65–134. doi: 10.1017/S0954422410000041. [DOI] [PubMed] [Google Scholar]
- 43.Wojdacz TK, Dobrovic A. Methylation-sensitive high resolution melting (MS-HRM): a new approach for sensitive and high-throughput assessment of methylation. Nucleic Acids Res. 2007;35:e41. doi: 10.1093/nar/gkm013. [DOI] [PMC free article] [PubMed] [Google Scholar]
Associated Data
This section collects any data citations, data availability statements, or supplementary materials included in this article.


