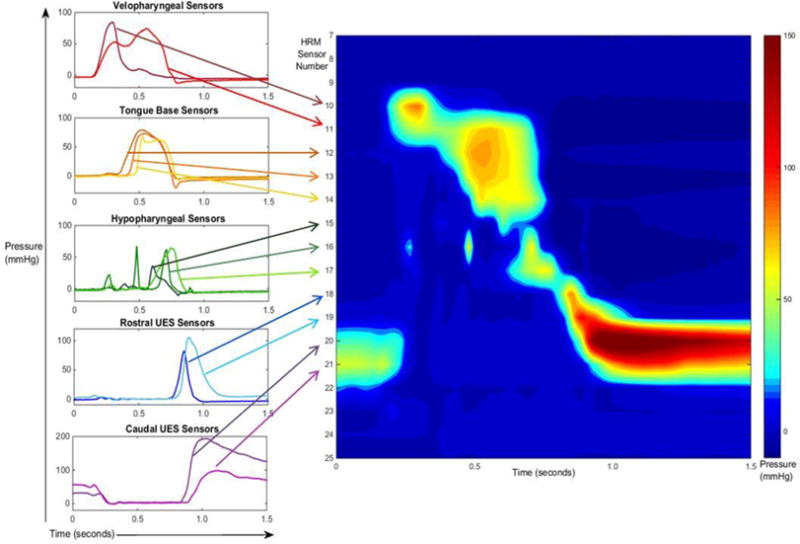
Fig. 1.

High-resolution manometry (HRM) pressure wave and spatiotemporal plot alignment of sensor regions of a 10 mL swallow. The left side of the figure outlines the pressure wave shapes that helped us determine the regions of interest, and shows where the corresponding sensors line up on the HRM spatiotemporal plot (on the right). The pressure wave and spatiotemporal plots are time aligned along the x-axis.
