

SUMMARY
Class B G protein-coupled receptors are major targets for treatment of chronic diseases, including osteoporosis, diabetes and obesity. Here we report the structure of a full-length class B receptor, the calcitonin receptor, in complex with peptide ligand and heterotrimeric Gαβγs protein determined by Volta phase plate single-particle cryo-electron microscopy. The peptide agonist engages the receptor through binding to an extended hydrophobic pocket facilitated by the large outward movement of the extracellular ends of transmembrane helices 6 and 7. This conformation is accompanied by a 60° kink in helix 6 and large outward movement of the intracellular end of this helix, opening the bundle to accommodate interactions with the α5-helix of Gαs. Also observed is an extended intracellular helix 8 that contributes to both receptor stability and functional G protein coupling via interaction with the Gβ subunit. This structure provides a new framework for understanding G protein-coupled receptor function.
G protein-coupled receptors (GPCRs) are the most abundant cell surface receptor proteins, ubiquitously important for virtually all physiological processes. As the most successful targets for treatment of disease, understanding GPCR structure and how this relates to their function is critically important for optimal exploitation of their therapeutic potential1. GPCRs allosterically transmit extracellular signals to the inside of cells through complex formation with transducers, such as G proteins or arrestins2. To date, crystal structures of ~40 inactive class A GPCRs (of >800 in the human genome) have been solved, most engineered to improve stability in detergents and/or crystal packing3. Far fewer GPCR agonist-bound structures have been determined, and only one in complex with a full heterotrimeric Gαβγ protein4. Transmembrane (TM) domain structures of class B GPCRs have been especially refractory to crystallisation and are currently limited to two inactive state structures5–7, with no reported full-length class B GPCR structures.
Class B GPCRs bind physiologically and clinically important peptide hormones and are attractive targets for treatment of major chronic diseases8. These receptors have a large extracellular N-terminal domain (ECD) that is important for peptide binding. Multiple structures of the ECD fragments bound to short peptides exist9, but do not inform on how bound peptides bind the receptor core for activation. The calcitonin receptor (CTR), a class B GPCR, is a therapeutic target for the treatment of a range of bone diseases, with salmon calcitonin (CT) and human CT approved for clinical use10.
Single particle cryo-electron microscopy (cryo-EM) provides an avenue to obtain high-resolution structure information on proteins without the need for crystallisation. Notwithstanding the recent advances in electron detectors and cryo-EM data analysis, successful application of this technology for proteins/complexes smaller than 200kDa remains challenging due to the inherent low contrast that limits accurate alignment of projections to derive high resolution11,12. The recently introduced approach of using a Volta phase plate for data acquisition with increased contrast sidesteps many trade-offs that hamper structure determination of small proteins by cryo-EM13–15. In the current study, we have used Volta phase plates to image particles of an ~150 kDa complex comprising an unmodified CTR bound to a peptide agonist in complex with a heterotrimeric Gs protein. This enabled us to obtain the first near atomic-resolution structure of an activated GPCR using cryo-EM.
Structure determination
To enable efficient expression and purification, the CTR was modified to replace the native signal peptide with hemagglutinin (HA), followed by a FLAG epitope for affinity purification and an HRV 3C cleavage site, while the C-terminus was modified by the addition of an HRV 3C cleavage site and histidine affinity tag (Extended Data Figure 1). These modifications had no effect on receptor pharmacology (Extended Data Figure 2).
To form an active, G protein-coupled complex, the CTR was co-expressed with Gαs, His-Gβ1, and Gγ2 in HighFive™ insect cells and stimulated with an excess of the high affinity agonist, salmon CT (sCT) that has a very slow off-rate16,17. The complex was solubilised in MNG/cholesteryl hemisuccinate and purified using an anti-FLAG antibody affinity column and size exclusion chromatography (SEC) (Extended Data Figure 3). Further complex stabilization was achieved with the addition of camelid antibody, Nb35, which binds at the Gαs-Gβ interface and was used in the determination of the β2AR:Gs heterotrimer structure4. Addition of purified Nb35 to insect cell membranes expressing CTR, Gαs and βγ prior to purification produced a monodispersed complex by SEC that remained stable at 4°C for at least 5 days, however, as noted for the β2AR:Gs, the Gs heterotrimer could no longer bind to GTPγS (Extended Data Figures 2e and 3e).
We recorded images of frozen-hydrated sCT/CTR/Gs complex using Volta phase plate cryo-EM, obtaining particle projections with high contrast (Extended Figure 4). 2D classification revealed averages with secondary structure features and sufficient distribution in orientation of particles to enable reconstructions. 3D classification with Relion18 facilitated the selection of ~106,000 particle projections, which were used to obtain a cryoEM density map with a nominal global resolution of 4.1Å, and 3.8-Å resolution at the TM-Gs region (Figure 1, Extended Figure 4).
Figure 1. The sCT:CTR:Gs Cryo-EM structure.

a, Orthogonal views of the cryo-EM map. The sharpened map with variably colored densities (CTR TM:blue, sCT:yellow, heterotrimeric Gs:copper, light blue, purple, Nb35:red) is overlaid with the non-sharpened map in transparency showing density for the ECD. b, Structure of the complex determined after refinement in the cryo-EM map. c, Snapshots of map versus model from TM segments, RasGα α-helix 5 and Gβ.
The cryo-EM map allows for near-atomic interpretation of the regions of the complex corresponding to the Gs protein and nanobody and TM helix bundle. An additional density, tightly inserted within an opening of the helical bundle and attributable to sCT is also resolved (Figure 1a). The ECD is less well resolved due to partial flexibility, while large variability in the Gαs α-helical domain (AHD) prevented reconstruction of this density (Extended Figure 5). The AHD domain is discernable in low resolution 3D maps, where it is observed to adopt variable conformations in respect to the Ras-like domain, consistent with previous studies on the β2AR-Gs heterotrimer complex19 and light-activated rhodopsin complexed with Gi20. This is interesting in the context of the CTR where two agonists, human CT and sCT, promote ternary complexes with distinct G protein conformations that exhibit different nucleotide affinities and have distinct efficacies17. The conformational heterogeneity of the sCT/CTR complexed Gαs suggests that this may contribute to these observations.
We also observed multiple conformations of the receptor N-terminal ECD relative to the TM core (Extended Figure 5), indicating that, for the peptide agonist bound CTR, this domain remains flexible. This flexibility is likely to be important as modifications to sCT that extend secondary structure are detrimental to affinity and potency21. In the cryo-EM structure, the density corresponding to the ECD is lower in resolution than the rest of the complex (Extended Data Figure 4). Although this did not permit accurate modeling, there was a strong agreement with the isolated ECD/sCT structure (PDB: 5II0)22 that could be fit to the density, contiguous with TM1 (Extended Data Figure 6). There is also additional density in the ECD around residue 130, corresponding to predicted glycosylation in this region. As previously described23, mutation of either Asn125 or Asn130 to Asp was detrimental to sCT affinity and function suggesting this glycosylation is required for normal agonist activity (Extended Data Figure 6).
Structure of the activated CTR TM bundle
The TM bundle and the G protein complex (minus the Gαs AHD) were resolved at a nominal resolution of 3.8 Å, with the quality of the cryo-EM density map highest within the G protein and at the Gαs/receptor interface. The local resolution varied within the CTR TM bundle (Extended Data Figure 4) with weaker density in the extracellular loops (ECL), intracellular loops (ICL), and the top of TM6. The limited resolution of the map in these regions suggests local flexibility that is likely required for receptor function. The CTR contains a very long extended H8, similar to that observed in the inactive state glucagon receptor (GCGR) structure7, highlighting this may be a general feature for class B GPCRs. While the remaining CTR C-terminus beyond H8 was present in the protein, it is not visible in the cryo-EM map suggesting this region remains mobile when the receptor is bound to G protein.
sCT density indicates that the depth of the CTR orthosteric binding site (Figures 1 and 2a) is shallower than that predicted for some class B GPCRs7,24,25, with the N-terminus residing approximately 1 helical turn above a network of conserved class B polar residues. Limited density was observed for sCT side-chains making peptide modeling ambiguous. Although specific interactions could not be identified, sCT is likely to form extensive contacts with the tops of all TMs (with the exception of TM4), as well as ECL2. The N-terminus of the CT family of peptides is distinct from that of other orthosteric class B GPCR peptide ligands, with a cyclised N-terminus formed by a disulphide bond between residues 1 and 7. The apparent outward movements of TMs 6 and 7 (relative to inactive structures-discussed below) appear crucial to accommodate the peptide N-terminus (Figure 2a).
Figure 2. The CTR TM bundle orthosteric peptide binding site.

a, Cryo-EM density (yellow fill) for sCT in the CTR 7TM bundle (blue); The sCT N terminus sits one helical turn above a conserved polar network. Molecular models of the sCT backbone (yellow ribbon) align well with the density, however side chain density is not visible. b, Modelling suggests that the sCT hydrophobic face resides in a hydrophobic receptor environment formed by residues in TM1, TM2, TM3 and TM7.
Although there are multiple possible modelling solutions for sCT, we have reported the most parsimonious, taking into account the cryo-EM map and experimental data. This model predicts sCT maintains helicity up to residue 6 forming an amphipathic helix with Val8, Leu12, Leu16 and Leu19 facing towards a hydrophobic receptor environment (Figure 2b). This is in agreement with evidence that an amphipathic helix contributes to peptide activity26 and consistent with that predicted from a solution NMR structure of sCT27. Gln14 is predicted to form hydrogen bond interactions with the ECL2 backbone, yet is in an orientation with solvent accessibility (Extended Data Figure 7a). This is an essential requirement as Gln14 can be directly labeled or replaced with a Lys to conjugate bulky substituents (radiolabels or fluorophores), while still maintaining peptide activity. In addition, two residues crucial for agonist activity, Ser5 and Thr6, are predicted to interact with TM5, potentially forming polar interactions with His3025.40b (Extended Data Figure 7b). This model is supported by mutation of His302 to Ala that reduced sCT potency in cAMP production and ERK1/2 phosphorylation, consistent with reduced sCT affinity (Extended Data Figure 7c). The first three residues in sCT make minimal receptor contacts in this model, consistent with experimental data showing these residues can be removed without altering peptide activity28.
Comparison of activate CTR to class B inactive TM structures
Comparison of the CTR complex with inactive class B GPCR structures (GCGR6,7 and corticotropin releasing factor receptor 15 (CRF-1R)) or inactive CTR homology models provides insights into TM conformational transitions upon Class B GPCR activation (Figure 3a, Extended Data Figure 8). The most striking observations relate to TM6 where there is a large outward movement at the cytoplasmic face in the activated CTR (~15Å) relative to the inactive structures when measured from the Cα at X6.35b (superscript indicates class B GPCR numbering29). An outward movement within TM6, as well as disordering and unwinding of this helix was observed at the extracellular face (9-11Å when measured from the Cα of Phe5.56b). This is correlated with an extremely sharp (~60°) kink at the center of TM6 formed around Pro6.47b-X-X-Gly6.50b. Importantly, residues within this motif influence agonist affinity, activation and function in both CTR and the related calcitonin receptor-like receptor30,31. The very high conservation of the Pro6.47b-X-X-Gly6.50b motif in Class B GPCRs (Supplemental Information Figure 1) implies that these residues may be globally important for activation through formation of a kink in TM6 that is much more pronounced than in any TM helix in GPCR structures solved to date.
Figure 3. Comparisons of inactive class B and the activated CTR structures.

a, Side (left), extracellular (middle) and cytoplasmic (right) views of the sCT/CTR/Gs (blue) relative to inactive CRF-1R (PDB: 4Z9G, yellow) and GCGR (PDB: 5EE7, purple) structures. Differences in TMs at the extracellular and cytoplasmic faces are highlighted. b, The positions of class B conserved polar residues located within the activated CTR bundle (left), the inactive GCGR (middle) and the CP-376395 bound CRF-1R (right). The central polar network likely forms interactions in all structures, while the TM2-3-6-7 and TM2-6-7-H8 networks that stabilise class B inactive structures (as in the GCGR) are disrupted in the activated CTR. In the CRF-1R, CP-376395 binding also disrupts these interactions.
In comparison to both inactive structures, there is an inward movement at the top of TM1 in the CTR-Gs structure and a small outward movement at the top of TM5. TM7 movement differs when comparing individual inactive structures to the CTR-Gs complex (Figure 3a). While the TM7 kink angle is similar in the inactive CRF-1R and the CTR, TM7 is shifted towards TM6 in the CTR. In contrast, there is a large 9Å outward movement in the top of TM7 in the CTR structure relative to the GCGR. While the differences observed in location of the top of TM helices may represent physiologically relevant differences, we interpret them with caution because the inactive structures do not include the receptor ECDs. There is increasing evidence for a dynamic role of class B ECD-TM core interactions in receptor quiescence and activation32–35 and the large outward movement of helices 6 and 7 required for peptide binding support a model of class B GPCR quiescence where the tops of TMs 6 and 7 are potentially constrained by ECL3 interactions with the far N-terminal ECD, a theory supported by experimental data on the glucagon receptor32,33,34. Nonetheless, in all structures, the top of TM6/ECL3 has a large degree of structural flexibility, supported by its weak corresponding density in the CTR-Gs complex cryo-EM map (Extended Data Figure 4) and the high crystallographic temperature factors exhibited by inactive structures in these regions5,7.
Interactions in conserved residues
Class B GPCRs contain highly conserved TM domain polar residues that have crucial roles in receptor integrity, high affinity agonist interaction and/or receptor activation and downstream signalling6,7,25,29,36–38. A central polar network (Asn1942.60b, Asn2333.43b, Gln3556.52b and Gln3837.49b in the CTR) is present in all inactive structures5–7 and in our inactive CTR homology model. This network is preserved in the active CTR TM bundle, although the exact interactions and their relative strengths likely vary in the different structures (Figure 3 and Extended Data Figure 8), in a receptor and peptide specific manner25,29. Not predicted from previous studies, Tyr1912.57b is also involved in this network. This residue is unique to the CTR, being a hydrophobic Phe in all other class B receptors (Supplemental Information Figure 1) suggesting receptor-specific differences in how the binding energy is translated through the protein to promote G protein activation.
At the cytoplasmic face, an important interaction between His2.50b and Glu3.50b, considered to play an equivalent functional role in class B GPCRs to the DRY motif in class A GPCRs, is present in the inactive class B crystal structures5–7,29,36 and is maintained in the active CTR TM bundle (Figure 3b and Extended Data Figure 8). These residues form an extensive polar interaction network with Thr6.42b and Tyr7.57b locking the base of the receptor in an inactive conformation in our inactive CTR homology model, consistent with that of the two published GCGR inactive structures6,7. In the CRF-1R, these residues are further apart due to disruption by the thermostabilising mutation Ala7.57b and binding of the small molecule antagonist5 (Figure 3b). This network is broken in the CTR/Gs structure, with Tyr7.57b forming new hydrogen bond interactions with the TM6 backbone (Figure 3b, Extended Data Figure 8). This releases constraints on TM6 and likely assists in the large conformational transition of TM6 away from the core of the bundle. Consistent with this, mutation of these residues either results in constitutive activation36 or reduced receptor expression29,36.
At the cytoplasmic face, Arg2.46b, Arg/Lys6.37b, Asn7.61b and Glu8.41b (TM2-6-7-H8 network) form tight interactions in the GCGR inactive structure and our CTR homology model with two key salt bridges formed by Glu8.41b with Arg2.46b and Arg/Lys6.37b (Figure 3b). These interactions are not present in the inactive CRF-1R due to the absence of H8, but have been predicted in other class B GPCRs36,38 and are likely conserved across the entire family. While the interaction between Glu8.41b and Arg2.46b is likely maintained in the active CTR-Gs structure, the salt bridge between Lys6.37b and Glu8.41b is broken with these residues residing 26Å apart (Figure 3b). The reordering of these side chains in the active structure releases ground state constraints on TM6.
The CTR-Gs interface
Extensive interactions formed between the CTR and Gαs stabilise the active receptor conformation. The receptor:Gαs interface is formed by residues located in TMs 2, 3, 5, 6, ICL2, ICL3 and H8 of the receptor with the RasGαs α5- and α4-helices, and the αN-β1 junction of the G protein. The most extensive contacts consist of polar and hydrophobic Van der Waals interactions between the receptor and RasGα5-helix (Figure 4a, Extended Data Figure 9a). Class B GPCRs all predominantly couple to Gαs and several of the CTR residues that form interactions with the RasGαs domain are highly conserved and have been implicated in G protein coupling previously36,37.
Figure 4. CTR-G protein interactions.

a, α5-helix of Gαs (orange) docks into a CTR intracellular face cavity (blue) by the opening of TM6, forming polar and non-polar interactions. H41 at the Gαs αN-β1 boundary interacts with the CTR ICL2 backbone. b, CTR H8 bulky aromatics heavily embed within the detergent micelle. Residues on the opposing face are in the vicinity of Gβ, where they likely form polar interactions. c, CTR pharmacological characterisation in COS7 cells following gradual deletion of the C-terminus. Left; deletion after Trp406 (Δ407) results in heavily reduced cell surface expression. Further truncation after Gln399 (Δ400) further reduced cell surface expression highlighting bulky, detergent buried residues within H8 are crucial for CTR cell surface localisation. Middle; Δ407 and Δ400 had reduced maximal responses for cAMP production relative to WT. Right; Calculation of cAMP efficacy via application of the Black-Leff operational model43 to cAMP accumulation data, followed by correction for alterations in cell surface expression, reveal Δ407 has reduced cAMP efficacy (Logτc) that is not further reduced by additional truncation back to Gln399. This indicates residues Thr400-Trp406 are crucial for cAMP efficacy that may be associated with their interaction with Gβ. Pharmacological data are the mean ± S.E.M of 5 independent experiments performed in duplicate. * Statistically different from WT using one-way analysis of variance followed by Dunnett’s test (P<0.05).
The buried interface between the receptor:RasGαs is 2031Å2, while an interface of 663Å2 is also provided by a H8:Gβ. Interestingly, H8 is heavily buried within the detergent micelle, facilitated by bulky aromatic residues and additional polar charged residues that can interact with lipid/detergent head groups (Figure 4b, Extended Data Figure 9b). Sequential deletions of the CTR C-terminus support a role for H8 lipid interactions in receptor stability at the cell surface (Figure 4c). While truncation after Trp413 (Δ414) had no effect on receptor function, truncation after Trp406 (Δ407) resulted in reduced cell surface receptor expression. Further truncation (Δ400) resulted in a greater reduction in cell surface expression, highlighting lipid interactions with receptor residues Thr400-Trp413 is essential for receptor stability. In addition, Δ407, but not Δ414 significantly reduced sCT-mediated cAMP efficacy, with no further reduction by Δ400, suggesting CTR-Gβ interactions between residues 407 and 413 also contribute to efficiency of Gs mediated cAMP production (Figure 4c). There is only limited density in this region of the map, however contacts would be predicted between the CTR Gln408 and Gβ backbone. While side chain density is limited, the positioning of Cα would orient Arg404 and Gln415 of the CTR towards Asp312 and Gln44 in Gβ respectively, nonetheless, these CTR residues have no effect on Gs mediated cAMP efficacy. Gβ has additional roles in signalling, therefore it is possible that interactions in this region may contribute to other aspects of CTR function. A 12 amino acid region within H8 that includes at least one important Trp is required for efficient cell surface localisation of the related calcitonin-like receptor39. Due to the presence of an extended α-helix in the inactive structure of the GCGR and the CTR, it is likely that this functional role of H8 in cell surface stabilisation and interactions with Gβ is shared across the class B GPCR family.
The human CTR has a common, naturally occurring splice variant with a 16 amino acid insertion between Arg174 and Ser175 that has attenuation of both G protein-dependent signaling and receptor internalisation40. ICL1 is well resolved in the sCT/CTR/Gs structure, located above the WD1 and WD7 domains of Gβ, and within close proximity to the N-terminal α-helical domain (Nα) of the α-subunit (Extended Data Figure 9c). As such, the I1+ (CTb) isoform is likely to sterically interfere with receptor:G protein interactions, leading to the attenuation in signalling.
Comparison of class A and class B GPCR:Gαs complex
An overlay of the G protein heterotrimer in the sCT/CTR/Gs complex to that of the class A β2AR4 reveals only minor differences in the conformation of the G protein between the two structures (Figure 5a). While the Gαs AHD was trapped in an open conformation in the β2AR-Gs crystal structure, it is not resolved at high resolution in the sCT/CTR/Gs complex due to its inherent flexibility in the absence of nucleotide (Extended Data Figure 5).
Figure 5. Comparison of a class A and class B GPCR Gs ternary complex.

a, Side view of the CTR:Gs complex (blue:CTR, orange:Gαs, aquamarine:Gβ, purple:Gγ, red:Nb35) aligned to the G protein complex (Gαβγ) of the β2AR:Gs complex (grey:G protein, green:β2AR). The G protein closely aligns in the two structures. There are major differences between the receptor TM domains at the extracellular surface. CTR has a more kinked TM6 and a longer H8; β2AR TM5 cytoplasmic face is extended. b, CTR (blue) and β2AR (green) TMs viewed from the cytoplasmic face. The intracellular TM tips (with the exception of TM4) overlay, highlighting conserved movements within the intracellular face of class A and B GPCRs for Gs coupling.
Comparing the two receptors reveals similar locations of the intracellular helical tips of TMs 1-3 and 5-7 (Figure 5b). These TM helices in class B inactive structures also overlay with class A inactive receptors revealing conserved global cytoplasmic changes upon activation. Two notable differences include a helical extension of TM5 in the β2AR/Gs complex that was not evident for the CTR, and the long H8 that was not observed in the β2AR.
At the extracellular face there are major differences in the conformation of the two receptors, reflective of their distinct activating ligands, with the class B structure that is required to accommodate a peptide, being more open (Extended Data Figure 10). There are striking differences in TMs 6 and 7, which contain kinks in both receptors, but are more pronounced in the CTR. A large shift inwards and towards TM7 in extracellular side of TM1 is also evident in the class B structure relative to the β2AR, with this TM also forming an extended helical structure (3 additional turns), a feature reported previously for the inactive state structure of the GCGR7. A notable feature is the distinct location of TM4 in the CTR relative to the β2AR (Figure 5, Extended Data Figure 10). This is particularly interesting as TM4 is the predominant interface for class B GPCR dimerisation, with disruption of this interface leading to attenuated G protein signalling for all receptors that have been assessed to date, including the CTR41,42.
CONCLUSIONS
The cryo-EM structure of the sCT/CTR/Gs complex provides a first near atomic resolution view of a full-length class B GPCR and of an activated class B GPCR-G protein ternary complex. Notably, the CTR is completely unmodified (with the exception of affinity tags) and is one of only a few structures of a wildtype GPCR, highlighting the potential of cryo-EM in solving structures of GPCR complexes. The structure also provides the first visualisation of the binding site of the N-terminus of a peptide agonist within the TM bundle of a class B GPCR as well as some insight into the biological flexibility of the ternary complex. This study provides a framework to further investigate the mechanism of agonist interactions and activation of other class B GPCRs that may open up new avenues for rational design of novel therapeutics for this class of receptors.
METHODS
Constructs
Wildtype human calcitonin receptor (CTR) was modified to include a N-terminal FLAG tag epitope and a C-terminal 8× histidine tag, both tags are removable by 3C protease cleavage site (Extended Data Figure 1). These constructs were generated in both mammalian and insect cell expression vectors.
Insect cell expression
CTR, human Gαs short, His6-human Gβ1 and Gγ2 were expressed in HighFive insect cells (Thermo Fisher Scientific) using baculovirus. Cell cultures were grown in ESF 921 serum free media (Expression System) to a density of 4 million cells per ml and then infected with 3 separate baculovirus at a ratio of 1:2:2 for hCTR, Gαs and Gβ1γ2. Cultures were grown at 27°C and harvested by centrifugation 45 h post infection.
Complex Purification
Cells were suspended in 20mM HEPES pH 7.4, 50mM NaCl, 2mM MgCl2 supplemented with cOmplete Protease Inhibitor™ Cocktail tablets (Roche). Complex formation was initiated by addition of 1μM salmon calcitonin, Nb35-His (10μg/mL) and Apyrase (25mU/mL, NEB); the suspension was incubated for 1 h at room temperature. Membranes were harvested by centrifugation at 30,000 × g for 30 min, and solubilised by 0.5% (w/v) lauryl maltose neopentyl glycol (LMNG, Anatrace) supplemented with 0.03% (w/v) cholesteryl hemisuccinate (CHS, Anatrace) for 2 h at 4°C. Insoluble material was removed by centrifugation at 30, 000 × g for 30 min and the solubilised complex was immobilised by batch binding to M1 anti-Flag affinity resin in the presence of 3 mM CaCl2. The resin was packed into a glass column and washed with 20 column volumes of 20mM HEPES pH 7.4, 100mM NaCl, 2mM MgCl2, 3mM CaCl2, 100nM sCT, 0.01 % (w/v) MNG and 0.006% (w/v) CHS before bound material was eluted in buffer containing 5mM EGTA and 0.1mg/mL FLAG peptide. The complex was then concentrated using an Amicon Ultra Centrifugal Filter (MWCO 100 kDa) and subjected to size exclusion chromatography on a Superdex 200 Increase 10/300 column (GE Healthcare) pre-equilibrated with 20mM HEPES pH 7.4, 100mM NaCl, 2mM MgCl2, 100nM sCT, 0.01 % (w/v) MNG and 0.006% (w/v) CHS to separate complex from contaminants. Eluted fractions consisting of receptor and G protein complex were pooled and concentrated. Final yield of purified complex was approximately 0.5mg/L insect cell culture.
The stability of CTR Gs heterotrimer complex at 4°C was monitored by analytical SEC. SEC purified complex was incubated on ice and 50μg was applied onto Superose 6 Increase 10/300 GL column at 24 h interval for a total period of 5 days. Protein was detected by measuring absorbance at 280nm with a fluorescence detector (RF-10AXL, Shimadzu).
SDS-PAGE and Western Blot Analysis
Samples collected from each purification step were analysed by SDS-PAGE and Western blot. For SDS-PAGE, precast gradient TGX gels (Bio-Rad) were used. Gels were either stained by Instant Blue (Expedeon) or immediately transferred to PVDF membrane (Bio-Rad) at 100V for 1 h. The proteins on the PVDF membrane were probed with two primary antibodies, rabbit anti-Gs C-18 antibody (cat no. sc-383, Santa Cruz) against Gαs subunit and mouse penta-His antibody (cat no. 34660, QIAGEN) against His-tags. The membrane was washed and incubated with secondary antibodies, 680RD goat anti-mouse and 800CW goat anti-rabbit (LI-COR). Bands were imaged using an infrared imaging system (LI-COR Odyssey Imaging System).
EM data acquisition
Specimen preparation and data acquisition
Concentrated sample from Superdex 200 Increase 10/300 GL column was loaded onto a Superose 6 Increase 10/300 GL column (GE Healthcare). Eluted fractions were used to prepare specimens for EM imaging using conventional negative staining protocol44. Negative-stained samples were imaged at room temperature with a Tecnai T12 (FEI) electron microscope operated at 120 kV. Images were recorded at magnification of 57,000× and a defocus value of −1 μm on a Gatan US4000 CCM camera. All images were binned to 2×2 pixels to obtain a pixel size of 4.16 Å.
For cryo-EM, purified CTR Gs heterotrimer complex was diluted to 0.3mg/mL with 20mM HEPES pH 7.4, 100mM NaCl, 2mM MgCl2, 100nM sCT. Vitrified specimen was prepared by applying 5 μL of protein complexes onto a glow discharged 300 mesh copper Quantifoil R1.2/1.3 grid (Quantifoil Micro Tools), plunge-frozen in liquid ethane cooled by liquid nitrogen inside a Vitrobot Mark IV (FEI) with blotting time of 3 s and draining time of 0.5 s. Cryo-EM imaging was performed on a Titan Krios microscope operated at 300 kV (FEI) equipped with a Gatan Quantum energy filter, a Gatan K2 Summit direct electron camera (Gatan) and a Volta phase plate (FEI). 2780 movies were taken in EFTEM nanoprobe mode, with 50μm C2 aperture, at a calibrated magnification of 47170 corresponding to a magnified pixel size of 1.06 Å. Each movie comprises 50 sub frames with a total dose of 50 e−/Å2, exposure time between 11 and 13.75 s and a dose rate between 4 and 5 e−/pix/s on the detector. Data acquisition was done using SerialEM software45 and custom macros for automated single particle data acquisition with Volta phase plate at −500 nm defocus14.
Image processing and 3D reconstructions
Image processing and three-dimensional reconstructions were performed as previously described46. Dose fractionated image stacks were subjected to beam-induced motion correction, globally and locally, by MotionCor247. A sum of all frames, filtered according to exposure dose, in each image stack was used for further processing. CTF parameters for each micrograph were determined by CTFFIND448.
Particle selection, two-dimensional classification and three-dimensional classification were performed on a binned dataset with a pixel size of 2.12 Å using RELION2. Semi-automated selected 1,213,995 particle projections were subjected to reference-free two-dimensional classification to discard false positive particles or particles categorized in poorly defined classes, resulting in 426,001 projections for further processing. An ab initio map generated by VIPER49 was used as initial reference model for maximum-likelihood-based three-dimensional classification. One stable class with detailed features accounting for 106,838 particles was then subjected to focused refinement with a soft mask including receptor and Gs protein and excluding the α-helical domain, produced the final map with global nominal resolution of 4.1 Å, and nominal resolution of 3.8-Å in the 7TM and G protein region.
Reported resolutions are based on the “gold-standard” Fourier shell correlation (FSC) using the 0.143 criterion. All density maps were corrected for the modulation transfer function (MTF) of the K2 summit direct detector and then sharpened by applying temperature-factor that was estimated using post-processing in RELION18. Local resolution was determined using ResMap with half-reconstructions as input maps.
Model building
The initial template of hCTR was derived from a homology based predicted model calculated by I-TASSER50. Models of sCT and Gs heterotrimer were adopted from the NMR structure (PDB ID: 2GLH) and β2AR-Gs crystal structure (PDB ID: 3SN6), respectively. All models were visualized and docked into the density in Chimera51, followed by manual adjustment and real-space refinement using COOT52. Sequence assignment was guided by bulky residues such as Phe, Tyr, Trp and Arg. The final model was subjected to global refinement and minimization in real space using the module ‘phenix.real_space_refine’ in PHENIX53. Due to lower local resolution for the peptide, its model was omitted from the deposited structure. Model overfitting was evaluated through its refinement against one cryo-EM half map. FSC curves were calculated between the resulting model and the half map used for refinement as well as between the resulting model and the other half map for cross-validation (Extended Data Figure 4). The final refinement statistics are provided in Supplemental Information, Table S1.
Inactive homology model of hCTR
The glucagon receptor (GCGR) 4L6R X-ray structure7 was used as the template for the CTR homology model. A GCGR/CTR sequence alignment of the seven TMs and helix 8 was performed using the GPCRdb server54. This alignment was modified by closing the gap at the extracellular end of TM5 and adding residues to CTR and GCGR from their respective gene sequences to complete the alignments at the cytoplasmic end of TM5 and TM6, respectively. We used ICM (Molsoft) to remove all atoms in the 4L6R template not present in this modified GCGR sequence, and generated a CTR homology model based on the modified sequence alignment. An ICM global optimization procedure was performed using monte carlo conformational space sampling of side chains with hydrogen bond optimization.
Insect cell membrane preparations for radioligand and [35S]GTPγS binding
The CTR complex (CTR, Gαs and Gβ1γ2) or CTR alone were expressed in insect HighFive cells (Expression Systems) with the same virus ratios used for the CTR complex preparation for cryo-EM. Cells were harvested ~42 h after the viral infection. For crude membrane preparations cells were resuspended in membrane buffer (20 mM Hepes 7.4, 50 mM NaCl, 2 mM MgCl2, with protease inhibitors and benzonase), dounced 20 times followed by centrifugation (10 min, 350 g, 4°C). The pellet was again resuspended in membrane buffer, dounced and clarified by centrifugation at a low g-force. Membranes were pelleted by centrifugation (1 h, 40,000 g, 4°C), resuspended in the membrane buffer and sonicated. The protein concentration was determined using Bradford reagent (Bio-Rad).
Radioligand competition binding experiments on CTR expressed in insect cells
Radioligand binding was performed in 20 mM HEPES pH 7.4; 100 mM NaCl; 10 mM MgCl2; 0.1% BSA. First, membranes (1-2 μg/sample) were incubated with different concentrations of sCT and Nb35 (7 μg/sample, where applicable) for 1 h at 22°C. Then [125I]-[8-32]sCT was added to a final concentration of approximately 50 pM [125I]-[8-32]sCT (precise concentrations in each experiment were determined by γ-counting) followed by 1 h incubation at 30°C. Membranes were harvested on UniFilter GF/C (Whatman) plates using Filtermate 196 harvester (Packard), extensively washed with ice-cold NaCl, dried and dissolved in 40 μl of MicroScint-O scintillation cocktail (Packard) and counted using MicroBeta LumiJET counter (PerkinElmer). Nonspecific binding was measured in the presence of 1 μM of [8-32]sCT. Curves were fitted to one- or two-site competition binding equations in Prism 6.0 (GraphPad). Data from each experiment were normalised to the response of membranes prepared from cells expressing all the components of the CTR complex (CTR, Gαs and Gβ1γ2) in the absence of sCT (100%).
[35S]GTPγS binding on CTR expressed in insect cells
Measurement of [35S]GTPγS incorporation was performed in 20 mM HEPES pH 7.4; 100 mM NaCl; 10 mM MgCl2; 1 mM EDTA; 0.1% BSA; 30 ug/ml saponin. First, membranes (50 μg/sample) were pre-incubated with 5 μM GDP and increasing concentrations of sCT for 30 min at 22°C. For experiments investigating the effects of Nb35, indicated amounts of Nb35 were also added at this step. Reactions were started by the addition of [35S]GTPγS and ATP to final concentrations of 300 pM and 50 μM, respectively. After 1 h incubation at 30°C, the reaction was terminated by harvesting the membranes on Whatman UniFilter GF/C plates using Filtermate 196 harverster (Packard). Membranes were extensively washed with ice-cold 50 mM Tris pH 7.6, 10 mM MgCl2, 100 mM NaCl, dried, dissolved in 40 μL of MicroScint-O scintillation cocktail (Packard) and counted using a MicroBeta LumiJET counter (PerkinElmer). Data from each experiment were normalised to the response of membranes prepared from cells expressing all the components of the CTR complex (CTR, Gαs and Gβ1γ2) in the presence of 1 μM sCT (100%).
Generation of mutant receptors and C-terminal deletion constructs in mammalian cell vectors
Mutagenesis and C-terminal deletions were generated in a cMyc epitope tagged receptor that displays the same pharmacological properties as the wildtype receptor and the construct utilised for purification studies. The desired mutations were introduced into the CTR in the pEF5/FRT/V5-DEST destination vector (Invitrogen) using oligonucleotides for site-directed mutagenesis purchased from GeneWorks (Hindmarsh, SA, Australia) and the QuikChange™ site-directed mutagenesis kit (Stratagene). C-terminal deletions were generated using primers designed to amplify the CTR from the N-terminus to the various points within the C-terminus via standard PCR methods. PCR products were purified using a Qiagen gel purification kit following the manufacturers protocol. The primers for PCR contained sequences that incorporated sites into the PCR products for recombination into the destination vector pEF5/FRT/V5-DEST via Gateway technology. Sequences of receptor clones were confirmed by automated sequencing at the Australian Genome Research Facility.
Mammalian cell expression
COS7 or 3T3 FlpIn cells (Invitrogen) were cultured in Dulbecco’s Modified Eagle’s Medium (DMEM) (Invitrogen) supplemented with 10 % v/v fetal bovine serum (FBS) (Thermo Electron Corporation) at 37˚C and 95% O2 /5% CO2 in a humidified incubator. Cells were routinely tested for mycoplasma contamination. Cells were transiently transfected, using polyethylenimine (PEI). DNA and PEI diluted in 150mM NaCl were combined in a 1:6 ratio and incubated for 15 min, added to cell suspension and the cells plated.
Mammalian whole cell binding experiments
Transfected Cos7 cells were seeded at a density of 3 × 10⁴ cells/well into 96-well culture plates and incubated for 48 h at 37°C in 5% CO2, and radioligand binding carried out as previously described55. For each cell line in all experiments, total binding was defined by 0.05 nM 125I-sCT(8-32) alone, and nonspecific binding was defined by co-incubation with 1 μM sCT(8-32). For analysis, data are normalised to the specific binding for each individual experiment.
Mammalian cAMP assays
Transfected COS7 or 3T3-FlpIn cells were seeded at a density of 3 × 10⁴ cells/well into 96-well culture plates and incubated for 48 h at 37°C in 5% CO2, and cAMP detection carried out as previously described56. All values were converted to concentration of cAMP using a cAMP standard curve performed in parallel, and data were subsequently normalized to the response of 100 μM forskolin in each cell line.
Mammalian ERK1/2 phosphorylation assays
Transfected 3T3-FlpIn cells were seeded at a density of 3 × 10⁴ cells/well into 96-well culture plates and incubated for 48 h at 37°C in 5% CO2, and pERK1/2 assays were carried out using Alphascreen™ technology as previously described55,56. FBS was used as a positive control. Data were subsequently normalised to the response of 100 10 % FBS in each cell line.
Statistics
Where required, statistics for mutational studies were performed using one-way analysis of variance followed by Dunnett’s test using WT receptors as the control (P<0.05). Sample sizes were based on those routinely used for mutational studies and determination of alterations in cell signalling.
Data availability statement
All relevant data are available from the authors and/or are included with the manuscript or Supplementary Information. Atomic coordinates and the cryoEM density map have been deposited in the Protein Data Bank (PDB) under accession number 5UZ7 and EMDB entry ID EMD-8623.
Extended Data
Extended Data Figure 1. Schematic of the CTR used in the study.

In our construct HA-FLAG-3C-CTR-3C-8xHis, the native signal peptide of the CTR (residues 2-24) was replaced with an HA signal peptide (red), FLAG epitope (green) and a 3C cleavage site (yellow). The C-terminus was modified with a 3C cleavage site (yellow) and a His epitope (blue). Also highlighted on the schematic are consensus glycosylation sites (purple) and class B GPCR conserved disulphide bonds. Residues highlighted in bold are the most conserved residue in each helix and represent residues X.50 for each helix according to the class B GPCR numbering. The location of the 16 amino acid insertion within ICL1 for a common splice variant of the CTR (CTRb) is shown. In addition, the locations of the truncation sites within the CTR C-terminus/H8 assessed in this study are also highlighted.
Extended Data Figure 2. Pharmacology of the CTR construct used in this study.

a-d Pharmacological assessment in mammalian Cos7 cells (a, b) and HiveFive insect cells (c,d) of the untagged CTR and the construct shown in Extended Data Figure 1 (HA-FLAG-3C-CTR-3C-8xHis). The presence of purification tags does not alter receptor pharmacology. a, Radioligand competition binding for sCT in competition with the radiolabelled ligand 125I-sCT(8-32) in whole cells transiently expressing the WT or HA-FLAG-3C-CTR-3C-8xHis CTR. Data are normalized to maximum 125I-sCT(8-32) with nonspecific measured in the presence of 1μM unlabelled sCT(8-32). b, Concentration response curves assessing Gs activation via measurement of cAMP accumulation at the WT and HA-FLAG-3C-CTR-3C-8xHis CTR in the presence of sCT. c Radioligand competition binding for sCT in competition with the radiolabelled ligand 125I-sCT(8-32) performed with HA-FLAG-3C-CTR-3C-8xHis in the presence of Gs protein heterotrimer reveal similar affinity in insect cells vs mammalian cells. The presence of Nb35 does not alter ligand affinity. d, Concentration response curves to assess G protein activation by HA-FLAG-3C-CTR-3C-8xHis via GTPγS binding in the absence and presence of Gs protein heterotrimer reveals the tagged CTR can robustly activate Gs in insect cells. e, GTPγS binding to the HA-FLAG-3C-CTR-3C-8xHis in the presence of 1μM sCT is inhibited by increasing concentrations of Nb35. All data are mean + SEM of four independent experiments, conducted in duplicate or triplicate.
Extended Data Figure 3. Expression and purification of the sCT:CTR:Gs complex.

a, Flow chart of the purification steps for the hCTR-Gs complex. b, SDS-PAGE/Western Blot of samples obtained at various stages of hCTR-Gs purification. hCTR, Gs heterotrimer were co-expressed in insect cell membrane. Addition of the agonist salmon calcitonin initiates complex formation and was solubilised by detergent. Solubilised hCTR and hCTR-Gs complex was immobilised on FLAG antibody resin. FLAG eluted fractions were further purified by SEC. An anti-His antibody was used to detect FLAG-CTR-His, Gβ-His and Nb35-His (red) and an anti-Gs antibody was used to detect Gαs (green). c, Representative elution profile of FLAG purified complex on Superdex 200 Increase 10/30 SEC (top). SEC fractions containing hCTR-Gs complex (within dashed lines) were pooled, concentrated and analyzed by SEC on Superose 6 Increase 10/30 column (bottom). d, SDS-PAGE/Coomasie blue stain of the purified complex concentrated from the Superose 6 Increase 10/30 column. e, The stability of the purified hCTR-Gs was monitored by SEC following incubation at 4°C for 5 days.
Extended Data Figure 4. Cryo-EM of the sCT:CTR:Gs complex.

a, Representative Volta phase plate cryo-EM micrograph of the sCT:CTR:Gs complex (scale bar: 15 nm). b, Reference-free two-dimensional averages of the complex in MNG/CHS micelle. c, “Gold standard” Fourier shell correlation (FSC) curves, showing the overall nominal resolution at 4.1 Å and 3.8 Å on the stable region including TM domain and Gs protein complex without AHD. d, Final three-dimensional density map colored according to local resolution. e, FSC curves of the final refined model versus the final cryo-EM map (full dataset, black), of the outcome of model refinement with a half map versus the same map (red), and of the outcome of model refinement with a half map versus the other half map (green). At FSC=0.5, the resolution is 4.1 Å. f, EM density of TM1, TM5, TM6, TM7 and Helix 8.
Extended Data Figure 5. Flexibility of ECD and AHD in the sCT:CTR:Gs complex.

Representative maps from three-dimensional classification showing the dynamics of ECD and AHD. The overlaid maps are shown from top and side views. In the right panel the blue, green, purple and red density maps show the 4 3D classifications. These are overlayed on the left to demonstrate the observed flexibility on the Gαs AHD and the CTR ECD.
Extended Data Figure 6. The N-terminal ECD of the CTR.

a, Rigid body fitting of the structure of CTR ECD bound to sCT (PDB: 5II0)22 into the corresponding regions of the cryo-EM map revealed additional density (close to residue 130) that may be attributed to glycosylation. b-d, Asp mutation of four consensus glycosylation residues (N28D, N73D, N125D and N130D) reveals little role of glycosylation on cell surface expression (b), determined via a cell surface ELISA to the N-terminal epitope tag. c, Competition radioligand binding studies for sCT in competition with the radiolabelled ligand 125I-sCT(8-32) revealed reduced affinity for N130D, and to a lesser extent N125D compared to the WT CTR. d, Concentration response curves for cAMP accumulation for mutant receptors relative to WT show that N130D and to a lesser extent N125D also reduce the potency of sCT in functional experiments. All data are + SEM of five independent experiments, conducted in duplicate or triplicate.
Extended Data Figure 7. Molecular modelling of sCT peptide reveals potential interactions between peptide and receptor.

Cryo-EM density is shown in yellow fill, the sCT peptide model in yellow cartoon and the CTR in blue cartoon. a, Gln14 in sCT is predicted to form interactions with the backbone of ECL2 and b, Ser5, Thr6 are predicted to form hydrogen bonds with His302 in TM5 of the CTR, while Leu4 points down into the bundle towards TM6. c, Mutation of H302 to Ala (H302A) results in reduced potency for sCT in cAMP production (left) and phosphorylation of ERK1/2 (right) when expressed in 3T3-FlpIn cells. This supports a role H302 in sCT affinity. Data are the means + S.E.M of four independent experiments performed in duplicate
Extended Data Figure 8. Comparisons of an inactive CTR homology model and the activated CTR structure.
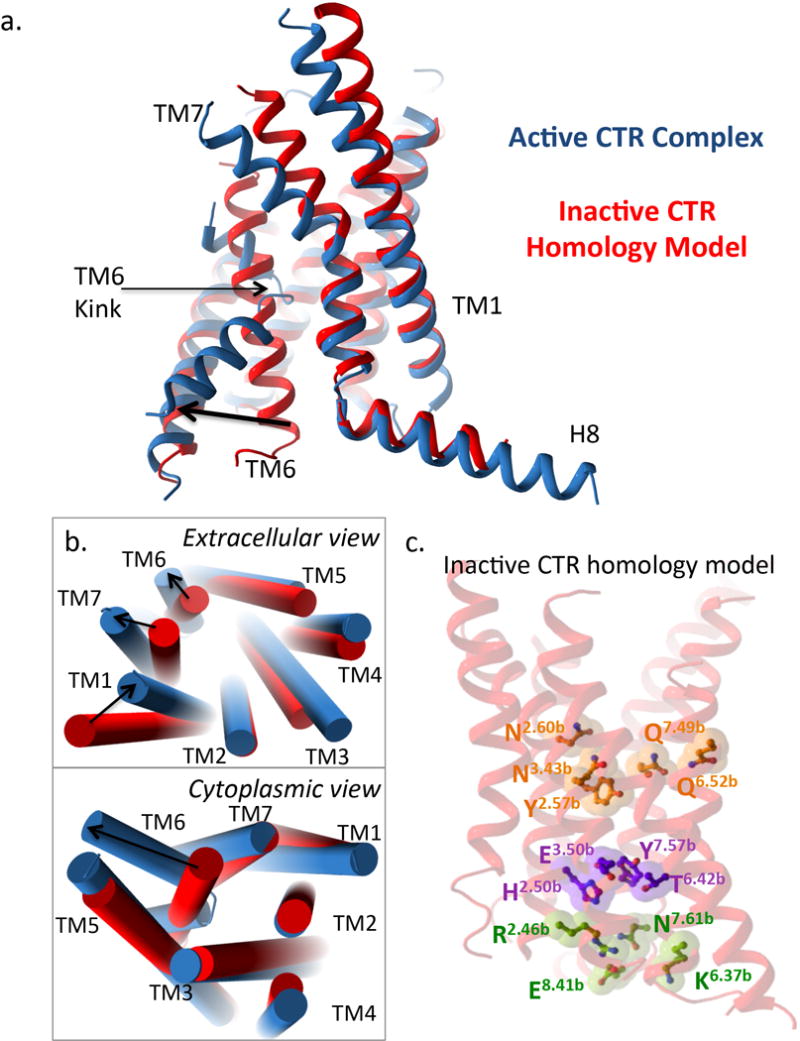
a, side view of the sCT/CTR/Gs receptor TM activated structure (blue) relative to the inactive CTR homology model (red). b, Tube representation for TM’s showing extracellular (top) and cytoplasmic (bottom) views of the sCT/CTR/Gs receptor TM activated structure (blue) relative to the inactive CTR homology model (red). In (a) and (b) large differences are observed at the extracellular ends of TM6 and TM7, with additional differences within TM1 and TM5. In addition, a very large outward movement is observed within TM6 of the active structure relative to the inactive homology model at the intracellular face. c, The positions of class B conserved polar residues located within the inactive CTR homology model.
Extended Data Figure 9. CTR-Gs protein interactions.

a, The α5-helix of Gαs (orange) docks into a cavity formed on the intracellular side of the receptor (blue) by the opening of TM6. G protein side chains within this cavity are supported by the cryo-EM map. b, H8 of the CTR forms an amphipathic helix with multiple bulky aromatics heavily embedded within the detergent micelle that are evident in the map. Residues within the more polar face of H8 are in the vicinity of Gβ, where they likely form polar interactions, although specific side chain density in this region is not evident. c, ICL1 is located in close proximity to the G protein. A common CTR splice variant contains a 16 amino acid insertion within this loop (between Arg174 and Ser175), an insertion that would sterically hinder G protein interactions with the receptor.
Extended Data Figure 10. Comparison of the activated β2AR and CTR viewed from the extracellular face.

Tube representation of the TMs of the CTR (blue) and β2AR (green) viewed from the cytoplasmic face (based on overlay of the Gs protein from each structure). Despite similarities in the position of TM tips at the intracellular face, there are very significant differences in location of the extracellular TM tips highlighting significant differences in the ligand binding mode and initiation of receptor activation between class A and B GPCRs.
Supplementary Material
Acknowledgments
This work was funded by the National Health and Medical Research Council of Australia (NHMRC) (grant #s 1055134, 1061044 and 1120919) and NIH grants DK090165, NS092695. PMS and AC are NHMRC Principal and Senior Principal Research Fellows respectively. DW is a NHMRC Career Development Fellow. Computational studies were partially supported by Melbourne Bioinformatics at the University of Melbourne, grant number VR0024. Negative stain imaging and cryoEM screening was performed at the Monash Ramaciotti Centre for Cryo-Electron Microscopy. The GPCRdb (gpcrdb.org) was used for generation of initial alignments of human class B GPCR sequences. The authors thank the late Dr. Moise Azria for 100mg of sCT, used in initial work.
Footnotes
The authors declare no competing financial interests for this manuscript.
Author Contributions
Y.L.L developed the expression and purification strategy (with D.M.T, S.G.B.F, B.K.K, D.W, G.S, P.M.S), performed virus production, insect cell expression, purification, complex stability, negative stain EM, data acquisition/analysis, prepared samples for cryo-EM and assisted with manuscript preparation.
M.K performed phase-plate imaging, data collection, EM data processing and analysis and assisted with manuscript preparation.
M.R assisted with negative-stain analysis and conception of cryo-imaging by Volta phase plate, performed cryo-sample preparation, preliminary screening imaging and analysis and assisted with manuscript preparation.
Y.Z calculated the cryo-EM map, performed model building and refinement, contributed to manuscript preparation.
A.G performed GTPγS and radioligand binding, model building and refinement and contributed to manuscript preparation.
J.T assisted in negative stain EM screening.
D.M.T contributed to purification strategy, model refinement and manuscript preparation.
S.G.B.F provided project strategy and protein purification advice, assisted data interpretation and manuscript preparation.
G.C performed cloning for baculovirus expression.
T.C performed homology modelling, assisted with model refinement and manuscript preparation.
R.D developed Volta phase plate cryo-EM data acquisition strategy and wrote automation scripts.
W.B organized and managed the Volta phase plate development project.
L.J.M provided insights into class B GPCRs, assisted with data interpretation and reviewed the manuscript.
A.C assisted with data interpretation and manuscript preparation.
B.K.K provided advice on CTR:Gs complex formation and purification.
D.W was responsible for overall project strategy and management (along with P.M.S) and performed pharmacological characterisation, interpreted data and wrote the manuscript.
G.S. provided feedback to guide cryo-EM, oversaw EM data processing, structure determination and refinement, data interpretation and manuscript writing.
P.M.S was responsible for overall project strategy and management, data interpretation and writing the manuscript.
Supplemental information is linked to this manuscript.
References
- 1.Congreve M, Marshall F. The impact of GPCR structures on pharmacology and structure-based drug design. Br J Pharmacol. 2010;159:986–996. doi: 10.1111/j.1476-5381.2009.00476.x. [DOI] [PMC free article] [PubMed] [Google Scholar]
- 2.Kenakin T, Miller LJ. Seven transmembrane receptors as shapeshifting proteins: the impact of allosteric modulation and functional selectivity on new drug discovery. Pharmacol Rev. 2010;62:265–304. doi: 10.1124/pr.108.000992. [DOI] [PMC free article] [PubMed] [Google Scholar]
- 3.Zhang D, Zhao Q, Wu B. Structural studies of G protein-coupled receptors. Mol Cells. 2015;38:836–842. doi: 10.14348/molcells.2015.0263. [DOI] [PMC free article] [PubMed] [Google Scholar]
- 4.Rasmussen SG, et al. Crystal structure of the beta2 adrenergic receptor-Gs protein complex. Nature. 2011;477:549–555. doi: 10.1038/nature10361. [DOI] [PMC free article] [PubMed] [Google Scholar]
- 5.Hollenstein K, et al. Structure of class B GPCR corticotropin-releasing factor receptor 1. Nature. 2013;499:438–443. doi: 10.1038/nature12357. [DOI] [PubMed] [Google Scholar]
- 6.Jazayeri A, et al. Extra-helical binding site of a glucagon receptor antagonist. Nature. 2016;533:274–277. doi: 10.1038/nature17414. [DOI] [PubMed] [Google Scholar]
- 7.Siu FY, et al. Structure of the human glucagon class B G-protein-coupled receptor. Nature. 2013;499:444–449. doi: 10.1038/nature12393. [DOI] [PMC free article] [PubMed] [Google Scholar]
- 8.Culhane KJ, Liu Y, Cai Y, Yan EC. Transmembrane signal transduction by peptide hormones via family B G protein-coupled receptors. Front Pharmacol. 2015;6:264. doi: 10.3389/fphar.2015.00264. [DOI] [PMC free article] [PubMed] [Google Scholar]
- 9.Pal K, Melcher K, Xu HE. Structure and mechanism for recognition of peptide hormones by Class B G-protein-coupled receptors. Acta Pharmacol Sin. 2012;33:300–311. doi: 10.1038/aps.2011.170. [DOI] [PMC free article] [PubMed] [Google Scholar]
- 10.Poyner DR, et al. International Union of Pharmacology. XXXII. The mammalian calcitonin gene-related peptides, adrenomedullin, amylin, and calcitonin receptors. Pharmacol Rev. 2002;54:233–246. doi: 10.1124/pr.54.2.233. [DOI] [PubMed] [Google Scholar]
- 11.Bai XC, McMullan G, Scheres SH. How cryo-EM is revolutionizing structural biology. Trends Biochem Sci. 2015;40:49–57. doi: 10.1016/j.tibs.2014.10.005. [DOI] [PubMed] [Google Scholar]
- 12.De Zorzi R, Mi W, Liao M, Walz T. Single-particle electron microscopy in the study of membrane protein structure. Microscopy. 2016;65:81–96. doi: 10.1093/jmicro/dfv058. [DOI] [PMC free article] [PubMed] [Google Scholar]
- 13.Danev R, Tegunov D, Baumeister W. Using the Volta phase plate with defocus for cryo-EM single particle analysis. eLife. 2017;6 doi: 10.7554/eLife.23006. [DOI] [PMC free article] [PubMed] [Google Scholar]
- 14.Khoshouei M, Radjainia M, Baumeister W, Danev R. Cryo-EM structure of haemoglobin at 3.2 A determined with the Volta phase plate. 2016 doi: 10.1038/ncomms16099. bioRxiv 087841. [DOI] [PMC free article] [PubMed] [Google Scholar]
- 15.Khoshouei M, et al. Volta phase plate cryo-EM of the small protein complex Prx3. Nat Commun. 2016;7:10534. doi: 10.1038/ncomms10534. [DOI] [PMC free article] [PubMed] [Google Scholar]
- 16.Hilton JM, Dowton M, Houssami S, Sexton PM. Identification of key components in the irreversibility of salmon calcitonin binding to calcitonin receptors. J Endocrinol. 2000;166:213–226. doi: 10.1677/joe.0.1660213. [DOI] [PubMed] [Google Scholar]
- 17.Furness SG, et al. Ligand-dependent modulation of G protein conformation alters drug efficacy. Cell. 2016;167:739–749. doi: 10.1016/j.cell.2016.09.021. [DOI] [PubMed] [Google Scholar]
- 18.Scheres SH. RELION: implementation of a Bayesian approach to cryo-EM structure determination. J Struct Biol. 2012;180:519–530. doi: 10.1016/j.jsb.2012.09.006. [DOI] [PMC free article] [PubMed] [Google Scholar]
- 19.Westfield GH, et al. Structural flexibility of the G alpha s alpha-helical domain in the beta2-adrenoceptor Gs complex. Proc Natl Acad Sci USA. 2011;108:16086–16091. doi: 10.1073/pnas.1113645108. [DOI] [PMC free article] [PubMed] [Google Scholar]
- 20.Van Eps N, et al. Interaction of a G protein with an activated receptor opens the interdomain interface in the alpha subunit. Proc Natl Acad Sci USA. 2011;108:9420–9424. doi: 10.1073/pnas.1105810108. [DOI] [PMC free article] [PubMed] [Google Scholar]
- 21.Andreotti G, et al. Structural Determinants of Salmon Calcitonin Bioactivity. The role of the Leu-based amphipathic α-helix. J Biol Chem. 2006;281:21493–24203. doi: 10.1074/jbc.M603528200. [DOI] [PubMed] [Google Scholar]
- 22.Johansson E, et al. Type II turn of receptor-bound salmon calcitonin revealed by x-ray crystallography. J Biol Chem. 2016;291:13689–13698. doi: 10.1074/jbc.M116.726034. [DOI] [PMC free article] [PubMed] [Google Scholar]
- 23.Ho HH, et al. Glycosylation is important for binding to human calcitonin receptors. Biochemistry. 1999;38:1866–1872. doi: 10.1021/bi981195e. [DOI] [PubMed] [Google Scholar]
- 24.Dods RL, Donnelly D. The peptide agonist-binding site of the glucagon-like peptide-1 (GLP-1) receptor based on site-directed mutagenesis and knowledge-based modelling. Biosci Rep. 2015;36:e00285. doi: 10.1042/BSR20150253. [DOI] [PMC free article] [PubMed] [Google Scholar]
- 25.Wootten D, et al. The extracellular surface of the GLP-1 receptor is a molecular trigger for biased agonism. Cell. 2016;165:1632–1643. doi: 10.1016/j.cell.2016.05.023. [DOI] [PMC free article] [PubMed] [Google Scholar]
- 26.Houssami S, et al. Divergent structural requirements exist for calcitonin receptor binding specificity and adenylate cyclase activation. Mol Pharmacol. 1995;47:798–809. [PubMed] [Google Scholar]
- 27.Meadows RP, Nikonowicz EP, Jones CR, Bastian JW, Gorenstein DG. Two-dimensional NMR and structure determination of salmon calcitonin in methanol. Biochemistry. 1991;30:1247–1254. doi: 10.1021/bi00219a012. [DOI] [PubMed] [Google Scholar]
- 28.Feyen JH, et al. N-terminal truncation of salmon calcitonin leads to calcitonin antagonists. Structure activity relationship of N-terminally truncated salmon calcitonin fragments in vitro and in vivo. Biochem Biophys Res Commun. 1992;187:8–13. doi: 10.1016/s0006-291x(05)81450-0. [DOI] [PubMed] [Google Scholar]
- 29.Wootten D, Simms J, Miller LJ, Christopoulos A, Sexton PM. Polar transmembrane interactions drive formation of ligand-specific and signal pathway-biased family B G protein-coupled receptor conformations. Proc Natl Acad Sci USA. 2013;110:5211–5216. doi: 10.1073/pnas.1221585110. [DOI] [PMC free article] [PubMed] [Google Scholar]
- 30.Bailey RJ, Hay DL. Agonist-dependent consequences of proline to alanine substitution in the transmembrane helices of the calcitonin receptor. Br J Pharmacol. 2007;151:678–687. doi: 10.1038/sj.bjp.0707246. [DOI] [PMC free article] [PubMed] [Google Scholar]
- 31.Conner AC, et al. A key role for transmembrane prolines in calcitonin receptor-like receptor agonist binding and signalling: implications for family B G-protein-coupled receptors. Mol Pharmacol. 2005;67:20–31. [PubMed] [Google Scholar]
- 32.Koth CM, et al. Molecular basis for negative regulation of the glucagon receptor. Proc Natl Acad Sci USA. 2012;109:14393–14398. doi: 10.1073/pnas.1206734109. [DOI] [PMC free article] [PubMed] [Google Scholar]
- 33.Mukund S, et al. Inhibitory mechanism of an allosteric antibody targeting the glucagon receptor. J Biol Chem. 2013;288:36168–36178. doi: 10.1074/jbc.M113.496984. [DOI] [PMC free article] [PubMed] [Google Scholar]
- 34.Yin Y, et al. An intrinsic agonist mechanism for activation of glucagon-like peptide-1 receptor by its extracellular domain. Cell Discov. 2016;2:16042. doi: 10.1038/celldisc.2016.42. [DOI] [PMC free article] [PubMed] [Google Scholar]
- 35.Zhao LH, et al. Differential requirement of the extracellular domain in activation of class B G protein-coupled receptors. J Biol Chem. 2016;291:15119–15130. doi: 10.1074/jbc.M116.726620. [DOI] [PMC free article] [PubMed] [Google Scholar]
- 36.Vohra S, et al. Similarity between class A and class B G-protein-coupled receptors exemplified through calcitonin gene-related peptide receptor modelling and mutagenesis studies. J R Soc Interface. 2013;10:20120846. doi: 10.1098/rsif.2012.0846. [DOI] [PMC free article] [PubMed] [Google Scholar]
- 37.Wootten D, et al. A hydrogen-bonded polar network in the core of the glucagon-like peptide-1 receptor is a fulcrum for biased agonism: Lessons from class B crystal structures. Mol Pharmacol. 2016;89:335–347. doi: 10.1124/mol.115.101246. [DOI] [PMC free article] [PubMed] [Google Scholar]
- 38.Wootten D, et al. Key interactions by conserved polar amino acids located at the transmembrane helical boundaries in Class B GPCRs modulate activation, effector specificity and biased signalling in the glucagon-like peptide-1 receptor. Biochem Pharmacol. 2016;118:68–87. doi: 10.1016/j.bcp.2016.08.015. [DOI] [PMC free article] [PubMed] [Google Scholar]
- 39.Conner M, et al. Functional and biophysical analysis of the C-terminus of the CGRP-receptor; a family B GPCR. Biochemistry. 2008;47:8434–8444. doi: 10.1021/bi8004126. [DOI] [PubMed] [Google Scholar]
- 40.Furness SG, Wootten D, Christopoulos A, Sexton PM. Consequences of splice variation on Secretin family G protein-coupled receptor function. B J Pharmacol. 2012;166:98–109. doi: 10.1111/j.1476-5381.2011.01571.x. [DOI] [PMC free article] [PubMed] [Google Scholar]
- 41.Harikumar KG, Ball AM, Sexton PM, Miller LJ. Importance of lipid-exposed residues in transmembrane segment four for family B calcitonin receptor homo-dimerization. Regul Pept. 2010;164:113–119. doi: 10.1016/j.regpep.2010.06.001. [DOI] [PMC free article] [PubMed] [Google Scholar]
- 42.Harikumar KG, et al. Glucagon-like peptide-1 receptor dimerization differentially regulates agonist signaling but does not affect small molecule allostery. Proc Natl Acad Sci USA. 2012;109:18607–18612. doi: 10.1073/pnas.1205227109. [DOI] [PMC free article] [PubMed] [Google Scholar]
- 43.Black JW, Leff P. Operational models of pharmacological agonism. Proc R Soc Lond B Biol Sci. 1983;220:141–162. doi: 10.1098/rspb.1983.0093. [DOI] [PubMed] [Google Scholar]
- 44.Peisley A, Skiniotis G. 2D projection analysis of GPCR complexes by negative stain electron microscopy. Methods Mol Biol. 2015;1335:29–38. doi: 10.1007/978-1-4939-2914-6_3. [DOI] [PubMed] [Google Scholar]
- 45.Mastronarde DN. Automated electron microscope tomography using robust prediction of specimen movements. J Struct Biol. 2005;152:36–51. doi: 10.1016/j.jsb.2005.07.007. [DOI] [PubMed] [Google Scholar]
- 46.Shalev-Benami M, et al. 2.8-A Cryo-EM Structure of the large ribosomal subunit from the eukaryotic parasite Leishmania. Cell Rep. 2016;16:288–294. doi: 10.1016/j.celrep.2016.06.014. [DOI] [PMC free article] [PubMed] [Google Scholar]
- 47.Zheng S, Palovcak E, Armache JP, Cheng Y, Agard D. Anisotropic correction of beam-induced motion for improved single-particle electron cryo-microscopy. 2016 doi: 10.1038/nmeth.4193. Biorxiv 093708. [DOI] [PMC free article] [PubMed] [Google Scholar]
- 48.Rohou A, Grigorieff N. CTFFIND4: Fast and accurate defocus estimation from electron micrographs. J Struct Biol. 2015;192:216–221. doi: 10.1016/j.jsb.2015.08.008. [DOI] [PMC free article] [PubMed] [Google Scholar]
- 49.Penczek PA, Grassucci RA, Frank J. The ribosome at improved resolution: new techniques for merging and orientation refinement in 3D cryo-electron microscopy of biological particles. Ultramicroscopy. 1994;53:251–270. doi: 10.1016/0304-3991(94)90038-8. [DOI] [PubMed] [Google Scholar]
- 50.Yang J, Zhang Y. Protein structure and function prediction using I-TASSER. Curr Protoc Bioinformatics. 2015;52:5 8 1–15. doi: 10.1002/0471250953.bi0508s52. [DOI] [PMC free article] [PubMed] [Google Scholar]
- 51.Pettersen EF, et al. UCSF Chimera–a visualization system for exploratory research and analysis. J Comput Chem. 2004;25:1605–1612. doi: 10.1002/jcc.20084. [DOI] [PubMed] [Google Scholar]
- 52.Emsley P, Cowtan K. Coot: model-building tools for molecular graphics. Acta Crystallogr Sect D-Biol Crystallogr. 2004;60:2126–2132. doi: 10.1107/S0907444904019158. [DOI] [PubMed] [Google Scholar]
- 53.Adams PD, et al. PHENIX: a comprehensive Python-based system for macromolecular structure solution. Acta Crystallogr Sect D-Biol Crystallogr. 2010;66:213–221. doi: 10.1107/S0907444909052925. [DOI] [PMC free article] [PubMed] [Google Scholar]
- 54.Munk C, et al. GPCRdb: the G protein-coupled receptor database – an introduction. B J Pharmacol. 2016;173:2195–2207. doi: 10.1111/bph.13509. [DOI] [PMC free article] [PubMed] [Google Scholar]
- 55.Koole C, et al. Polymorphism and ligand dependent changes in human glucagon-like peptide-1 receptor (GLP-1R) function: allosteric rescue of loss of function mutation. Mol Pharmacol. 2011;80:486–497. doi: 10.1124/mol.111.072884. [DOI] [PMC free article] [PubMed] [Google Scholar]
- 56.Koole C, et al. Allosteric ligands of the glucagon-like peptide 1 receptor (GLP-1R) differentially modulate endogenous and exogenous peptide responses in a pathway-selective manner: implications for drug screening. Mol Pharmacol. 2010;78:456–465. doi: 10.1124/mol.110.065664. [DOI] [PMC free article] [PubMed] [Google Scholar]
Associated Data
This section collects any data citations, data availability statements, or supplementary materials included in this article.
Supplementary Materials
Data Availability Statement
All relevant data are available from the authors and/or are included with the manuscript or Supplementary Information. Atomic coordinates and the cryoEM density map have been deposited in the Protein Data Bank (PDB) under accession number 5UZ7 and EMDB entry ID EMD-8623.