

Abstract
The identification of pathogen-specific volatile metabolic “fingerprints” could lead to the rapid identification of disease-causing organisms either directly from ex vivo patient bio-specimens or from in vitro cultures. In the present study, we have evaluated the volatile metabolites produced by 100 clinical isolates belonging to ten distinct pathogen groups that, in aggregate, account for 90 % of bloodstream infections, 90 % of urinary tract infections, and 80 % of infections encountered in the intensive care unit setting. Headspace volatile metabolites produced in vitro were concentrated using headspace solid-phase microextraction and analyzed via two-dimensional gas chromatography time-of-flight mass spectrometry (HS-SPME-GC×GC-TOFMS). A total of 811 volatile metabolites were detected across all samples, of which 203 were: 1) detected in 9 or 10 (of 10) isolates belonging to one or more pathogen groups, and 2) significantly more abundant in cultures relative to sterile media. Network analysis revealed a distinct metabolic fingerprint associated with each pathogen group, and analysis via Random Forest (RF) using leave-one-out cross-validation (LOOCV) resulted in a 95 % accuracy for the differentiation between groups. The present findings support the results of prior studies that have reported on the differential production of volatile metabolites across pathogenic bacteria and fungi, and provide additional insight through the inclusion of pathogen groups that have seldom been studied previously, including Acinetobacter spp., coagulase-negative Staphylococcus, and Proteus mirabilis, as well as the utilization of HS-SPME-GC×GC-TOFMS for improved sensitivity and resolution relative to traditional gas chromatography-based techniques.
Keywords: Bacterial infections, Fungal infections, Metabolic fingerprinting, Network analysis, Two-dimensional gas chromatography-time-of-flight mass spectrometry (GC×GC-TOFMS), Volatile organic compounds (VOCs)
Introduction
Bacteria and fungi produce a wide array of metabolic products and byproducts, a subset of which are small molecules capable of existing in the gas phase at ambient temperature (the “volatile metabolome”)[1, 2]. A subset of these volatile metabolites possess specific functions, including cell-to-cell signaling, although many arise simply as byproducts of catabolic processes[1]. Due to genetic differences across species, including differences in the genes responsible for the production of these metabolites, it has been hypothesized that different microorganisms produce distinct “volatile metabolic fingerprints.” Analysis of these volatile metabolic fingerprints has garnered attention in a range of disciplines, including flavor chemistry (e.g., the aroma profiles of yeasts used for beer making[3]), public safety (e.g., the detection of biothreat agents from culture[4]), and healthcare (e.g., diagnosis of respiratory infections using exhaled breath[5, 6]). Indeed, microbially-derived volatile metabolites, as well as those associated with the host-pathogen interaction, have been proposed as potential diagnostic biomarkers in a variety of clinical settings, including infections of the bloodstream, respiratory tract, and urinary tract[2, 7].
At present, no standardized experimental conditions have been defined for the characterization of volatile metabolites produced by bacteria or fungi. The approximately 160 prior studies in this area have differed from one another in key areas, including: 1) growth parameters (e.g., culture media, incubation time, and oxygen availability), 2) methods for the concentration of volatile metabolites (e.g., solid-phase microextraction, and sorbent traps), and 3) instrumentation employed for metabolite analysis (e.g., “electronic noses,” colorimetric sensors, and gas chromatography-mass spectrometry (GC-MS)). Because of the variability between studies, it is challenging to infer differences between the volatile metabolic profiles of different pathogens unless they have been directly compared in a single experiment. Furthermore, more than half of all prior studies have considered five or fewer species, and approximately half have reported on the volatile metabolites produced by only a single reference strain or clinical isolate for each organism studied. In order to comprehensively assess the volatile metabolic fingerprints of important bacterial and fungal pathogen groups, one must consider both a wide range of groups as well as a diverse collection of isolates in each group.
With the inclusion of 100 isolates across ten pathogen groups, and the use comprehensive two-dimensional gas chromatography time-of-flight mass spectrometry (GC×GC-TOFMS), the present study represents one of the most extensive analyses to-date of the volatile metabolic profiles of pathogenic bacteria and fungi. The pathogen groups included in this study are estimated to account for approximately 90 % of bloodstream infections[8, 9], 90 % of urinary tract infections[10], and 80 % of all infections encountered in the intensive care unit setting[11]. The analytical approach employed in the present study has demonstrated utility in the identification of novel microbially-derived metabolites in vitro[12–15], and has additionally provided insight into underlying microbial processes[16, 17]. As a subset of the volatile metabolites previously detected under in vitro conditions have been translated to ex vivo patient specimens such as breath[5, 18, 19], analysis of in vitro cultures using GC×GC-TOFMS could represent a powerful approach for the identification of novel volatile biomarkers with potential diagnostic utility.
Materials and Methods
Isolates Collection
The study was approved by the Committee for the Protection of Human Subjects at Dartmouth College (Study#: 28773). Ten pathogen groups (n = 10 isolates per group) were included in this study: Acinetobacter spp., Candida spp., coagulase-negative Staphylococcus, Enterobacter spp., Enterococcus spp., Escherichia coli, Klebsiella spp., Pseudomonas aeruginosa, Proteus mirabilis, and Staphylococcus aureus. Species-level identifications were also available for isolates belonging to Candida spp. (Candida albicans (8) and Candida parapsilosis (2)), Enterobacter spp. (Enterobacter cloacae (7) and Enterobacter aerogenes (3)), Enterococcus spp. (Enterococcus faecalis (6) and Enterococcus faecium (4)), and Klebsiella spp. (Klebsiella pneumoniae (8) and Klebsiella oxytoca (2)), while none were provided for isolates belonging to either Acinetobacter spp. or coagulase-negative Staphylococcus. This isolates collection also encompassed three commonly-encountered antimicrobial resistance patterns, namely methicillin-resistant S. aureus (MRSA, five S. aureus isolates), vancomycin-resistant Enterococcus (VRE, three E. faecalis and one E. faecium), and extended-spectrum beta-lactamase producing (ESBL-producing) Klebsiella spp. (two K. pneumoniae and one K. oxytoca). All isolates were obtained from the clinical microbiology laboratory at Dartmouth-Hitchcock Medical Center (Lebanon, NH, United States). Isolates had previously been cultured from either blood or urine. Genus-level identification was confirmed via 16S rDNA sequencing for bacterial pathogens[20, 21], and 5.8S rDNA for Candida spp.[22]. Primers and PCR reaction conditions are presented in Supplementary Table S1. Mannitol salt agar was used to confirm the identities of Staphylococcus strains, and differentiate between S. aureus and coagulase-negative Staphylococcus.
Culture Conditions and Sample Preparation
Culture conditions and sample preparation were as described previously[23]. Isolates were pre-cultured overnight (5 mL, 37 °C, 200 rpm shaking) in Difco™ Mueller Hinton Broth (MHB) (Becton Dickinson, Franklin Lakes, NJ, United States), and inoculated 1:1000 into 20 mL of fresh MHB, which was incubated under identical conditions (37 °C, 200 rpm shaking) in a 250 mL Erlenmeyer flask for 12 h. After 12 h, cultures were transferred to 50 mL conical flasks, submerged in ice to quench metabolism, and centrifuged (12,100 × g, 4 °C, 5 min). Bacterial and fungal growth was approximated via optical density at 600 nm (OD600). 4 mL of culture supernatant was transferred to a 20 mL air-tight glass headspace vial and sealed with a Silicone/PTFE screw cap (both from Sigma-Aldrich, St. Louis, MO, United States). Samples were immediately stored at −20 °C, and analyzed within three months of preparation. One replicate was prepared per isolate.
Concentration and Analysis of Volatile Compounds
Volatile metabolites were concentrated using headspace solid-phase microextraction (HS-SPME) and separated and analyzed via comprehensive two-dimensional gas chromatography time-of-flight mass spectrometry (GC×GC-TOFMS). The GC×GC-TOFMS instrument was a LECO® Pegasus 4D (LECO Corp., St. Joseph, MI, United States) equipped with a rail autosampler (MPS, Gerstel Inc., Linthicum Heights, MD, United States). SPME fibers were produced by Supelco® (Bellefonte, PA, United States), and gas chromatography (GC) columns by Restek® (Bellefonte, PA, United States). A comprehensive list of instrumental parameters is presented in Table 1.
Table 1.
Instrumental parameters for HS-SPME-GC×GC-TOFMS analysis
| Headspace solid phase microextraction (HS-SPME) | |
|---|---|
| Fiber length, film thickness, and fiber composition | 2 cm, 50/30 μm, triphasic (divinylbenzene/carboxen/polydimethylsiloxane) |
| Headspace exposure conditions | 60 min, 37 °C, 200 rpm agitation |
| Two-dimensional gas chromatography (GC×GC) | |
| Inlet parameters | 270 °C, splitless injection, 180 s desorption time |
| Carrier gas and flow rate | Helium, 2 mL/min (constant flow) |
| Column composition and dimensions | Column 1: Rxi®-624Sil MS, 60 m × 0.25 mm × 1.4 μm* Column 2: Stabilwax, 1 m × 0.25 mm × 0.5 μm* |
| GC temperature program | 35 °C hold for 30 s,+ 3.5 °C/min ramp to 230 °C |
| Temperature offsets | + 5 °C (secondary oven), + 25 °C (modulator) |
| Modulator parameters | 2 s modulation period, alternating 0.5 s hot/0.5 s cold pulses |
| Transfer line temperature | 250 °C |
| Time-of-flight mass spectrometry (TOFMS) | |
| Acquisition delay | 170 s |
| Mass range | 30 – 500 amu |
| Acquisition rate | 200 spectra/s |
| Detector voltage offset | + 50 V |
| Ion source temperature | 200 °C |
Dimensions correspond to length × internal diameter × film thickness
Data Processing and Chromatographic Alignment
Chromatographic data were aligned using the Statistical Compare feature of the ChromaTOF® software, v4.50 (LECO Corp.). The baseline was drawn through the middle of the noise, and peaks with a minimum signal-to-noise (S/N) threshold of 50:1 were identified. Subpeaks within a chromatogram were combined if their second dimension retention time shift was ≤ 0.1 s between subsequent modulation periods, and their mass spectral match score was ≥ 600/1000. For the alignment of peaks across chromatograms, maximum allowable first and second dimension retention time deviations were set at 6 s and 0.15 s, respectively, and the minimum mass spectral similarity match set at ≥ 600/1000. For peaks detected at a S/N threshold of 50:1 in at least one chromatogram, all remaining chromatograms were searched at a reduced 5:1 threshold for the detection of low abundance analytes. Suspected chromatographic artifacts and contaminants, as defined previously[24], were removed from the data prior to any statistical analyses, as were known atmospheric gases (e.g., carbon dioxide and argon), and peaks eluting prior to 358 s[13].
Compound Reporting and Calculation of Retention Indices
Chromatographic peaks were assigned putative identifications based on mass spectral matching and retention time data. Specifically, putative compound identifications were assigned to peaks with a forward match score of ≥ 800/1000 relative to the National Institute of Standards and Technology (NIST) 2011 mass spectral library, and whose experimentally-determined retention index was consistent with that of a midpolar Rxi-624Sil MS stationary phase, as described previously[13]. Retention indices were calculated using external alkane standards (C6 – C16). The SPME fiber was exposed to a vial containing a pure retention index mixture (Sigma-Aldrich) for 10 min at 50 °C and desorbed at a 40:1 split. The gas chromatographic and mass spectrometric method were as defined previously. Reported RIs are between the literature values for polar and nonpolar column sets, due to the midpolarity of the Rxi-624Sil MS stationary phase. Retention indices less than 600 (corresponding to C6) or greater than 1600 (corresponding to C16) were not extrapolated.
Statistical Analyses
All statistical analyses were performed using R v3.2.2 (R Foundation for Statistical Computing, Vienna, Austria). Chromatographic data was first normalized using Probabilistic Quotient Normalization (PQN)[25] and log10-transformed. The Mann-Whitney U test with Benjamini-Hochberg correction[26, 27] was used to identify metabolites that were significantly different between pathogen groups and sterile media, with a corrected p-value of 0.05 established as the threshold for statistical significance. Network modeling was used to visualize relationships between metabolites[28]. Random Forest (RF) was used to identify volatile metabolites that were discriminatory between groups and predict pathogen identifications for leave-one-out cross-validation (LOOCV) test samples[29]. For each RF comparison, a total of 100 iterations were performed, with 500 decision trees generated per iteration. For assessing variable importance, all samples were included in the RF analysis, and volatile metabolites were ranked according to their mean decrease in accuracy (MDA), a measure of variable importance. For predicting pathogen identifications, one sample was withheld from the data, and RF was performed using the remaining 99 samples. Class probabilities were calculated for the withheld sample, with simple majority voting used to assign the withheld sample to a given pathogen group. This process was repeated using a different withheld sample each time, until all 100 samples had been withheld once. Principal components analysis (PCA) was used to reduce dimensionality and visualize variance in the data. Hierarchical clustering analysis (HCA) was employed to assess relatedness between samples based on their volatile metabolic profiles using Euclidean distance as the distance metric. For both PCA and HCA, variables were mean-centered and unit-scaled. Centering and scaling was applied to each variable independently. The qgraph package was used to generate network plots, ggplot2 to generate matrices, rgl to generate PC scores plots, and gplots to generate heat maps.
Results
Volatile molecular fingerprints of bacterial and fungal pathogen groups
We hypothesized that pathogenic microorganisms differ from one another in their production of volatile metabolites. After 12 hours of growth in Mueller-Hinton broth (MHB) under aerobic conditions, the volatile metabolites produced by ten pathogen groups (ten clinical isolates per group) were concentrated using headspace solid-phase microextraction and analyzed via comprehensive two-dimensional gas chromatography time-of-flight mass spectrometry (HS-SPME-GC×GC-TOFMS). The pathogen groups evaluated in this study consisted of one fungal group (Candida spp.), three Gram-positive groups (Enterococcus spp., coagulase-negative Staphylococcus, and S. aureus), and six Gram-negative groups. Two distinct phylogenetic lineages were represented within the Gram-negatives, namely the Pseudomonadales (Acinetobacter spp., and Pseudomonas aeruginosa) and the Enterobacteriales (Enterobacter spp., Escherichia coli, Klebsiella spp., and P. mirabilis)[30]. After chromatographic alignment and the removal of contaminants (see Materials and Methods), a total of 811 volatile metabolites were detected. Of these, 203 were: 1) detected in 9 or 10 (of 10) isolates for one or more pathogen groups, and 2) significantly more abundant in cultures relative to sterile media controls (p < 0.05). This subset of 203 metabolites is used for all subsequent analyses and discussion, unless otherwise specified. There was notable variability in the number of metabolites that met these two inclusion criteria across different pathogen groups, ranging from 133 for P. mirabilis, to only one for Enterococcus spp. (Figure 1). Twice as many volatile metabolites fulfilled the inclusion criteria, on average, for Gram-negative pathogen groups (range: 47 to 133) than both Gram-positive pathogen groups (range: one to 24), and fungi (three detected for Candida). Candida, Enterococcus, and coagulase-negative Staphylococcus grew slower in MHB relative to the seven other pathogen groups assessed (Supplementary Figure S1). Indeed, the median culture density for these three groups after 12 h of growth, as approximated by the optical density at 600 nm (OD600), ranged from 0.45 to 1.62, while the median OD600 for the remaining seven pathogens ranged from 2.06 to 2.61. We hypothesize that this slower growth likely contributed to the limited number of metabolites detected for these three pathogen groups relative to the other groups assessed in this study, although we also acknowledge that pathogen-to-pathogen differences in production of volatile metabolites could have also contributed.
Figure 1.
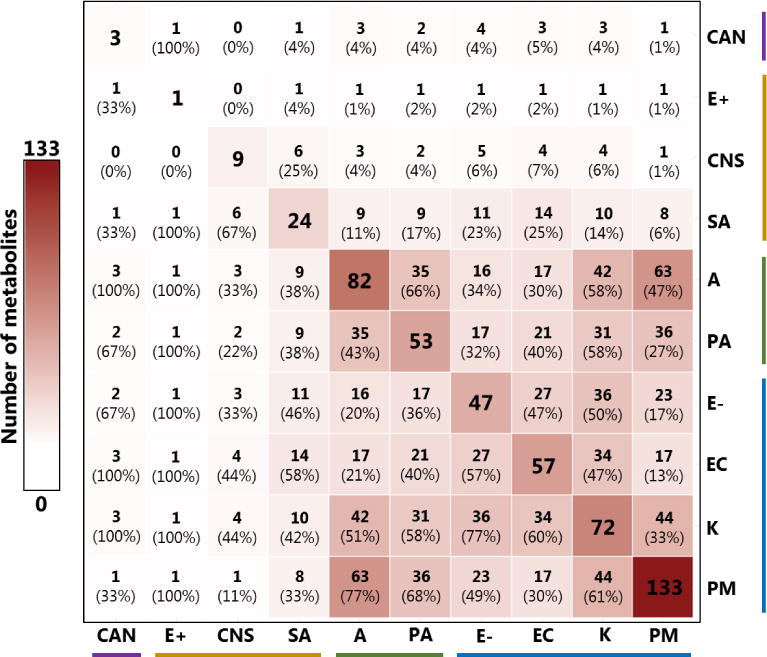
Overlap of volatile metabolites across pathogen groups, considering metabolites that were: 1) detected in 9 or 10 (of 10) isolates from a given group, and 2) significantly more abundant in cultures relative to sterile media controls (p < 0.05). Values on the diagonal indicate the number of metabolites detected for each group. Values in parentheses indicate the percentage of volatile metabolites produced by the pathogen group in that cell’s column that were also produced by the pathogen group in that cell’s row. Cell color is proportional to the total number of metabolites detected. CAN: Candida spp.; E+: Enterococcus spp.; CNS: Coagulase-negative Staphylococcus; SA: S. aureus; A: Acinetobacter spp.; PA: P. aeruginosa; E−: Enterobacter spp.; EC: E. coli; K: Klebsiella spp.; PM: P. mirabilis. Colored horizontal and vertical bars denote fungi (purple), Gram-positives (orange), Pseudomonadales (green), and Enterobacteriales (blue).
Other than the notable difference in the number of compounds detected for Gram-negative bacteria relative to both Gram-positive bacteria and fungi, we observe that the proportions of volatile metabolites shared between pathogen groups do not clearly recapitulate genetic relatedness. For example, among the Gram-negative pathogen groups included in this study, P. aeruginosa and Acinetobacter are more genetically similar to one another, belonging to the order Pseudomonadales, than either is to the four other Gram-negative pathogens (Enterobacter, E. coli, Klebsiella, and P. mirabilis), which all belong to the group Enterobacteriales[30]. Despite this, Acinetobacter shares more metabolites with both P. mirabilis and Klebsiella (n = 63 and 42, respectively) than it does with P. aeruginosa (n = 35) (Figure 1). We note, however, that when the number of shared metabolites is normalized to the total number of metabolites produced by each pathogen group, a relatively greater proportion of P. aeruginosa’s metabolites are shared with Acinetobacter compared with either P. mirabilis or Klebsiella (66 % vs. 68 % or 58 %, respectively). However, this trend is not uniformly true across all pathogen groups.
We next performed a network analysis to assess the relationships between the 203 selected volatile metabolites, using Pearson’s correlation coefficient as the measure of relatedness between metabolites. This analysis constrains features (depicted as nodes) within a two-dimensional space as a function of their correlations to all other features, with connecting lines representing either significantly positive (red) or negative (blue) correlations[28]. The network plot depicting these metabolites (Figure 2) includes two distinct clusters of approximately 50 highly correlated features each (left and upper-left), one relatively diffuse cluster of approximately 60 positively-and negatively-correlated features (bottom-right), and one cluster of seven highly positively correlated features (upper-right).
Figure 2.
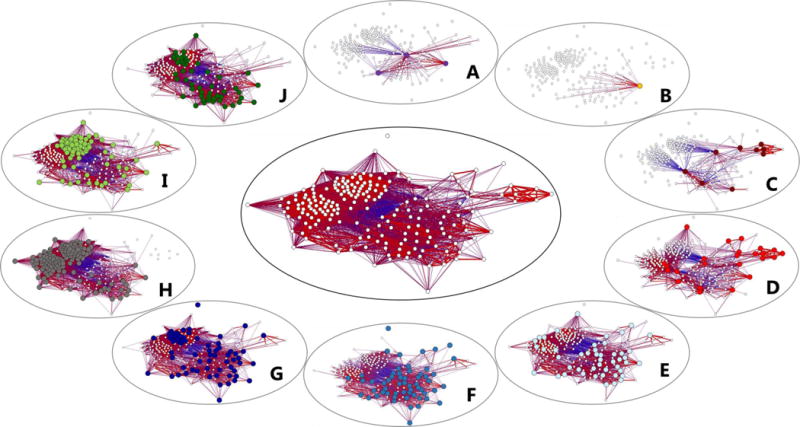
Network plot depicting 203 volatile metabolites produced by the ten pathogen groups evaluated in this study (center). Smaller, peripheral plots highlight the subset of metabolites produced by each individual pathogen group, with colored nodes corresponding to those metabolites produced by that group. A: Candida spp. (purple); B: Enterococcus spp. (orange); C: Coagulase-negative Staphylococcus (dark red); D: S. aureus (light red); E: Enterobacter spp. (light blue); F: E. coli (medium blue); G: Klebsiella spp. (dark blue); H: P. mirabilis (grey); I: Acinetobacter spp. (light green); J: P. aeruginosa (dark green). Edges indicate either positive (red) or negative (blue) correlations between metabolites, calculated using Pearson’s correlation coefficient. Only significant correlations (p < 0.05 after Benjamini-Hochberg correction) are displayed.
When these metabolites are displayed as a function of the pathogen groups that produce them, the cluster of highly-correlated metabolites on the left side is found to correspond to those produced predominantly by P. mirabilis (Figure 2H), the upper-left cluster to those produced predominantly by Acinetobacter, Klebsiella, P. mirabilis, and Pseudomonas (Figure 2G–J), the lower-right cluster to those produced by all six Gram-negative pathogens (Figure 2E–J), and the upper-right cluster to those produced by the Staphylococci groups coagulase-negative Staphylococcus and S. aureus (Figure 2C–2D, respectively). The production of volatile metabolites by these pathogen groups in the context of the network analysis can also be visualized via the calculation of centroids (Supplementary Figure S2). As we would have predicted based on Figure 2, the centroids for P. mirabilis and Acinetobacter are located towards the left and upper-left, respectively, those for Klebsiella, Enterobacter, E. coli, and P. aeruginosa cluster together in the center/lower-right, and those for S. aureus and coagulase-negative Staphylococcus in the upper-right. One must be cautious with interpreting the location of the centroids for Candida and Enterococcus, given the relatively few metabolites used to calculate these values (only three and one, respectively).
Volatile molecular fingerprints predict pathogen-level identification
Having demonstrated that these pathogen groups differed broadly in their production of volatile metabolites, we hypothesized that a subset of these 203 metabolites could also be useful for classifying samples into different pathogen groups. We obtained a 95 % classification accuracy for the discrimination between these ten pathogen groups using the machine-learning algorithm Random Forest (RF) with leave-one-out cross-validation (LOOCV)[29]. Classification accuracies were highest for coagulase-negative Staphylococcus, S. aureus, E. coli, Klebsiella, P. aeruginosa, and P. mirabilis (100 % accuracy), followed by Candida, Enterobacter, and Acinetobacter (90 %), and finally Enterococcus (80 %). Error matrices were generated to visualize occurrences of sample misclassification, as well as sample class probabilities generated from RF, for LOOCV samples (Supplementary Figure S3). Instances of misclassification were most commonly encountered between Candida and Enterococcus, possibly resulting from slower growth relative to the other pathogen groups assessed, as described previously. In further support of this hypothesis, the one isolate of Acinetobacter that reliably misclassified as Enterococcus also grew poorly in MHB relative to the other isolates from this species. Of note, we report high classification accuracies for the discrimination between closely-related groups, including coagulase-negative Staphylococcus and S. aureus (100 %), the four Enterobacteriales (98 %) (Enterobacter, E. coli, Klebsiella, and P. mirabilis), and the two Pseudomonadales (100 %) (P. aeruginosa and Acinetobacter), indicating that while these pathogens are genetically similar to one another, their volatile metabolic profiles are distinct.
We additionally sought to determine whether our stringent compound inclusion criteria may have impacted our ability to differentiate between pathogen groups. To assess this, we repeated RF using all 811 volatile metabolites detected in this study, rather than the selected 203 that we had used previously. The inclusion of all 811 metabolites resulted in a classification accuracy of 96 % (Supplementary Figure S4), a modest improvement from the 95 % reported using the 203 selected metabolites. Of note, improvement was reported only in the differentiation between Candida and Enterococcus (from 85 % to 90 %), while all other classification accuracies remained unchanged.
Finally, we sought to identify the subset of volatile metabolites that were most highly discriminatory between pathogens, and visualize how these metabolites varied across our collection of isolates. From RF, we calculated variable importance (as defined by the mean decrease in accuracy (MDA)) for the 203 selected metabolites in a single ten-class comparison (i.e., all ten pathogen groups treated as individual classes in a single statistical model), as well as ten two-class comparisons consisting of one pathogen group versus the nine others aggregated into a single class. For each model, we extracted the three most discriminatory metabolites (those with the largest MDA) and aggregated these 33 metabolites into a single feature set, for which we generated a principal components (PC) scores plot to visualize differences across pathogens (Figure 3A). In the case where a metabolite that had previously been selected in one comparison was within the top three most discriminatory metabolites for another comparison, the fourth most discriminatory compound was selected, such that all 11 models were weighted equally.
Figure 3.
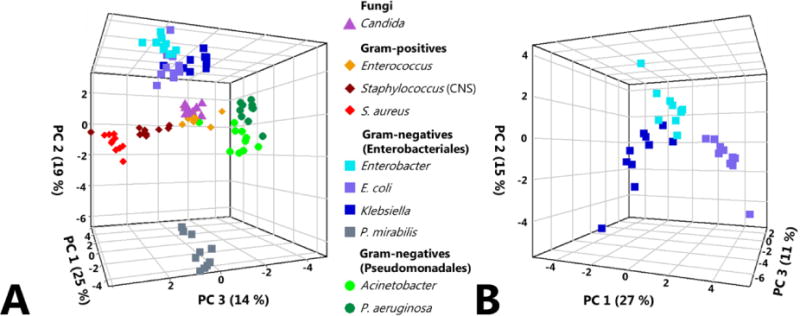
Principal components (PC) scores plots for ten fungal and bacterial pathogen groups, generated using 33 discriminatory volatile compounds identified via Random Forest (RF). 2a, left: PC scores plot depicting all ten pathogen groups. Fungi: triangles; Gram-positive cocci: diamonds; Gram-negative rods (Enterobacteriales): squares; Gram-negative rods (Pseudomonadales): circles. PC1: 25 %, PC2: 19 %, PC3: 14 %. 2b, right: PC scores plot depicting only the three closely-related Enterobacteriales: Enterobacter, E. coli, and Klebsiella, using the same discriminatory volatile compounds for the comprehensive pathogen-level comparison presented in 2a. PC1: 27 %, PC2: 15 %, PC3: 11 %.
The first three principal components generated from this set of 33 metabolites reveal clustering of samples by pathogen group, with relatively few exceptions. S. aureus and coagulase-negative Staphylococcus cluster adjacent to one another, as do the two Pseudomonadales (Acinetobacter and P. aeruginosa), and the three closely-related Enterobacteriales (Enterobacter, E. coli, and Klebsiella). P. mirabilis, with its unusual metabolite profile (as depicted in Figure 2H) formed a distinct cluster along PC2, away from other Enterobacteriales, as well as the other Gram-negative, Gram-positive, and fungal pathogens. Of note, Candida, Enterococcus, and one of the Acinetobacter isolates form a relatively indistinct cluster towards the center of the PC scores plot. This observation is consistent with our findings from the previous analysis, which demonstrated that Candida and Enterococcus tended to misclassify as one another, albeit with relatively low frequency (Supplementary Figure S3). However, it is clear that the first three principal components presented in this plot, which together account for 58 % of the total variance in the data, fail to capture a sizeable portion of the variance between Candida and Enterococcus samples, as isolates from these two groups classified with approximately 85 % accuracy. Indeed, other principal components not included in this scores plot, such as PC5 (9 %) and PC7 (3 %) account for much of the variance between these two groups (not shown). For Enterobacter, E. coli, and Klebsiella, the three Enterobacteriales that clustered together on the PC scores plot, a second scores plot was generated using the same suite of 33 discriminatory compounds used for the ten group comparison, but including only these three pathogen groups (Figure 3B). In this second plot, we observe that Enterobacter, E. coli, and Klebsiella all occupy spatially-distinct regions, demonstrating that even amongst these closely-related pathogens, the production of volatile metabolites is differential. Indeed, these pathogens could be distinguished from one another with 100 % accuracy using the prior RF model.
We generated a heat map as another way of visualizing the relationship between samples using these 33 discriminatory metabolites, with Euclidean distance as the measure of relatedness between samples (Figure 4). A subset of the information presented in this heat map was evident via PC scores plot. For example, strains tended to cluster as a function of pathogen group, and more closely related pathogens, such as Klebsiella, E. coli, and Enterobacter, tended to be more similar to one another than they were to other groups. Interestingly, this suggests that while the overall production of volatile metabolites is only modestly associated with genetic relatedness, a subset of discriminatory volatile metabolites may be useful for assessing genetic similarities between pathogen groups. Of interest, the ability of these metabolites to distinguish between Candida and Enterococcus is arguably more apparent when visualized via heat map relative to PC scores plot, with nine of ten Candida isolates forming a single cluster, and seven of ten Enterococcus isolates belonging to one of two distinct clusters. The ability to visualize the relative abundance of the 33 discriminatory compounds across the 100 samples via heat map demonstrates that while a subset of the discriminatory compounds are reliably produced by only a single pathogen group (e.g., 2,4-dithiapentane for P. mirabilis), the majority are produced across groups (e.g., 2-butanone for Acinetobacter and P. aeruginosa, and 2,4-dimethylheptane for Acinetobacter, Klebsiella, and P. mirabilis). Therefore, although the metabolites included in this analysis represent the most discriminatory features associated with a single pathogen group (excluding the three obtained from the ten-group comparison), a subset of the included metabolites have some discriminatory ability for more than one pathogen group included in this study.
Figure 4.
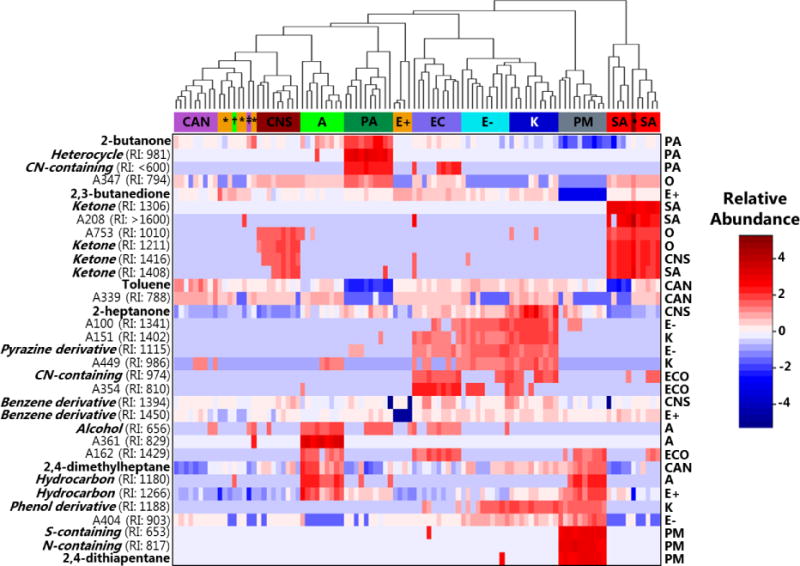
Heat map depicting the relative abundance of the 33 discriminatory volatile metabolites identified using RF (rows) across the ten pathogen groups assessed in this study (columns). Dendrogram (top) depicts the relatedness between strains, utilizing Euclidean distance as the distance metric. Cell colors correspond to relative compound abundance after mean-centering and unit-scaling, ranging from blue (low relative abundance) to red (high relative abundance). CAN or ‡: Candida; E+ or *: Enterococcus spp.; CNS or •: Coagulase-negative Staphylococcus; SA: S. aureus; A or †: Acinetobacter spp.; E−: Enterobacter spp.; EC: E. coli; K: Klebsiella spp.; PA: P. aeruginosa; PM: P. mirabilis. Putative compound identifications or class assignments are provided when possible (left). Experimentally-determined retention indices (RIs) are provided for analytes (“A” followed by a number), and metabolites for which only compound class assignments could be determined. The statistical model from which a given metabolite was selected is provided (right), with O representing metabolites selected from the overall (ten-group) comparison.
Of the 33 metabolites selected via RF, putative compound identifications could be assigned to six, and compound class assignments to an additional 16. The chromatographic characteristics of these metabolites, as well as their relative abundances across different pathogen groups, are presented in Supplementary Table S2. For the six compounds assigned putative compound identifications, 2,3-butanedione was most highly abundant in cultures of Enterococcus spp., 2,4-dimethylheptane in Acinetobacter, 2,4-dithiapentane in P. mirabilis, 2-butanone in P. aeruginosa, 2-heptanone in Klebsiella, and toluene in Candida. In considering all 22 compounds assigned either a putative identification or compound class assignment, we note that cultures of S. aureus and coagulase-negative Staphylococcus were enriched in ketones (2-butanone, 2-heptanone, and four unidentified ketones), while cultures of Acinetobacter were characterized by an abundance of hydrocarbons (2,4-dimethylheptane and two unidentified hydrocarbons). Of note, because this analysis considers only a subset of discriminatory pathogen-derived volatile metabolites, the proportions of different molecular classes reported here are not necessarily representative of the comprehensive volatile metabolic profile associated with each pathogen group. However, the observation that metabolites from a single molecular class are discriminatory between groups is possibly reflective of pathogen-level differences in the utilization of the pathways that result in the generation of these molecules (e.g., fatty acid metabolism for the production of 2-ketones)[1].
Discussion
The present study has considered the volatile metabolic profiles of 100 bacterial and fungal isolates belonging to ten distinct pathogen groups, and represents one of the most extensive analyses of the volatile metabolites produced by pathogens in vitro to-date. It additionally represents the single most extensive analyses of bacterial and fungal volatile metabolites performed using GC×GC-TOFMS, a powerful analytical technique well-suited for the characterization of complex mixtures including breath[31], as well as culture headspace metabolites[12–15, 23, 24, 32–34]. In total, we estimate that over 160 prior studies have described qualitative and/or quantitative differences in the composition of headspace volatile metabolites between different pathogen groups under either in vitro or ex vivo conditions. In general, these studies have focused on the volatile metabolic profiling of relatively few organisms, often those most pertinent to a specific disease or disease process, and frequently with only a limited number of clinical isolates or reference strains included per organism. Julak and colleagues provided arguably the broadest analysis with respect to the number of different pathogen groups assessed, with 37[35], while Coloe reported on the largest number of isolates from a single group, with 61 E. coli clinical isolates[36]. Other studies have sought to compromise between the number of pathogen groups and number of isolates per group, including those by Roine and colleagues, who analyzed a total of 80 isolates across four pathogen groups[37], Lim and colleagues, who analyzed 62 isolates across 18 pathogen groups[38], and Bruins and colleagues, who analyzed 52 isolates across 11 pathogen groups[39]. The present study demonstrates the importance of including both a broad range of pathogen groups, due to the differential metabolite profiles observed across groups, as well as the inclusion of a range of isolates, due to the observation that some rare isolates may produce a volatile molecular profile quite distinct from that of the “typical” isolate.
Our results suggest that both the number and variety of volatile metabolites shared between the pathogen groups included in this study were only modestly associated with the genetic relatedness between the pathogen groups themselves. The selected discriminatory features demonstrated a slightly better association with genetic relatedness relative to all pathogen-derived metabolites, although the relationship was still quite modest, with the fungus Candida clustering adjacent to the Gram-positive Enterococcus, and P. mirabilis exhibiting a very distinctive volatile molecular profile relative to the other Enterobacteriales included in this study. Had our volatile metabolomic fingerprints closely reflected genetic relatedness, we would have anticipated that the majority of the variance in our data would be attributed to differences between fungal, Gram-positive, and Gram-negative pathogen groups, with “within-group” differences (e.g., Enterobacteriales versus Pseudomonadales) accounting for a smaller proportion of the overall variance in the data[40].
Of interest, prior studies conducted using either Mueller-Hinton broth or Mueller-Hinton agar as a growth medium have reported similar findings. For example, Boots and colleagues noted that the majority of the variance in their volatilomic data resulted from differences in the metabolic profiles of P. aeruginosa and E. coli versus S. aureus and K. pneumoniae, despite the substantial genetic similarity between K. pneumoniae and E. coli[30, 41]. Liang and colleagues observed distinct differences between Gram-positive pathogens, Gram-negative pathogens, and fungi, although the Gram-negatives that they assessed (E. coli, K. pneumoniae, P. aeruginosa, and Acinetobacter baumannii) clustered together despite belonging to two distinct genetic clades[42]. Therefore, our results are plausibly related to the choice of growth conditions employed in the present study, as it has previously been demonstrated that growth media influences the composition of headspace volatile metabolites detected, even within a single organism[23, 42–44]. Alternative culture conditions might have resulted in metabolite profiles that were more reflective of genetic differences between pathogen groups relative to what was observed in the present study. For example, Lim and colleagues, who utilized BacT/ALERT® aerobic blood culture media for bacterial growth, observed that their bacterial strains tended to cluster in a way that broadly reflected genetic relatedness, with a distinct cluster corresponding to P. aeruginosa and A. baumannii, another corresponding to a group of Gram-positive pathogens (Streptococcus spp. and Enterococcus spp.), and a third that encompassed most of the Enterobacteriales (including E. coli, Klebsiella spp., Serratia marcescens, and Salmonella enterica)[38]. Of interest, they also noted that P. mirabilis produced a volatile metabolic signature distinct from those of other related Enterobacteriales. At present, there is not sufficient uniformity across studies with respect to experimental design to definitively state that one growth medium is superior to another for assessing volatilomic differences across a wide range of pathogens, although such a study could represent an important future direction for this work.
One of our most interesting observations from the present study is that Gram-negative pathogen groups, on average, produced more than twice as many volatile metabolites as Gram-positive and fungal pathogen groups when grown in MHB. Previous studies have reported conflicting results with regards to differences in the composition of volatile metabolites between Gram-negative and Gram-positive organisms. A subset of studies have described only modest differences in the number of volatile metabolites produced, with Boots and colleagues reporting on 4 metabolites for S. aureus compared with 6, 7, and 7 for P. aeruginosa, E. coli, and K. pneumoniae, respectively[41], and Filipiak and colleagues reporting on 37 compounds for P. aeruginosa compared with 32 for S. aureus[45]. Jünger and colleagues, however, described much more dramatic differences in the production of volatile metabolites between Gram-positive and Gram-negative pathogens. Similar to our own findings, that study reported on approximately three-times as many volatile metabolites produced by Gram-negative versus Gram-positive pathogens, with a substantial overabundance of volatile metabolites produced by P. mirabilis relative to other species[46]. In contrast, others such as Liang and colleagues[42], have reported on a stronger volatilomic signature from S. aureus relative to both Gram-negative pathogen groups and fungi. Again, the lack of uniformity across studies regarding experimental design makes it challenging to draw definitive conclusions about the relative “sizes” of the volatile metabolomes of different pathogen groups. Indeed, prior work from our group has demonstrated that even within a single organism, the size of the volatile metabolome can differ by more than two-fold across different common laboratory growth media[23]. A tempting approach to optimize the number and variety of volatile molecules detected is to utilize different media that have been optimized for the growth of specific organisms, for example: 7H9 or 7H11 media for Mycobacteria[47–50], chocolate agar for fastidious organisms[51], or Sabouraud dextrose media for yeast[52–58]. However, while such an approach may optimize growth and the production of volatile metabolites for a given pathogen, one must be cautious when describing volatile metabolic differences between organisms grown on different media. Even with techniques to “subtract” the volatile molecular signature of the media itself, previous studies suggests that a microorganism’s volatile molecular signature is fundamentally media-dependent, and that alteration of growth media could result in a substantially different volatile molecular profile[23, 43, 59].
In addition to qualitatively describing differences in the composition of volatile metabolites between pathogen groups, a key component of this study is the use of a supervised machine learning algorithm to predict the pathogen group to which a given sample belongs. Volatile molecular fingerprints could represent novel biomarkers for a range of infectious pathologies, including pneumonia, sepsis, and urinary tract infections[2, 7]. However, in order for these biomarkers to translate to the clinical setting, they must be able to reliably and accurately differentiate between pathogens. With the exception of studies that have described the development of novel sensors (e.g., “electronic noses” or colorimetric sensors), however, test parameters such as accuracy, sensitivity, or specificity, have rarely been reported[60–63].
The importance of discriminating between pathogen groups, specifically closely-related pathogen groups, is most evident in the comparison of S. aureus versus coagulase-negative Staphylococcus, which we could discriminate from one another with 100 % accuracy when considering both the 203 selected volatile metabolites, as well as all 811 metabolites. In the setting of suspected sepsis, the detection of S. aureus in a sample usually indicates an underlying disease process, while the detection of coagulase-negative Staphylococcus is often indicative of sample contamination[64], and the ability to discriminate between these two groups is thus critically important. Furthermore, the ability to discriminate between Klebsiella, P. mirabilis, and E. coli, for example, which we were able to achieve with 100 % classification accuracy, is pertinent in the setting of urinary tract infections, as antibiotic susceptibilities can vary across pathogen groups, especially within institutions experiencing outbreaks of multidrug-resistant pathogens[65]. Future studies could assess the translatability of our present findings to more clinically-relevant media or real bio-specimens, including urine, blood culture, and sputum, to determine the impact of a heterogeneous sample matrix on the ability to discriminate between pathogen groups.
In considering study strengths, we note that the present work represents one of the most extensive analyses of the volatile metabolites produced by bacteria and fungi, to-date, and additionally represents the single most extensive such analysis using GC×GC-TOFMS. Through this approach, we were able to identify specific volatile metabolic “fingerprints” associated with each pathogen group, consisting, in aggregate, of over 200 unique metabolites, many more than have been previously reported using other analytical techniques. In addition, we were able to demonstrate that this collection of volatile metabolites yielded a strong classification accuracy (95 %) for discriminating between 10 pathogen groups (with 10 isolates per group), demonstrating the potential utility of volatile biomarkers as diagnostic biomarkers. In considering study limitations, we note that the genomic diversity within each pathogen group that is captured by our collection of isolates is not fully known, and that additional whole genome sequencing would be required to ensure that we have included isolates representing the greatest extent of genetic diversity for each group. We acknowledge that differences in the number of volatile metabolites to meet our two inclusion criteria for each pathogen group may be due, in part, to this within-group heterogeneity, with more diverse pathogen groups yielding fewer volatile metabolites produced by ≥ 9 of 10 isolates. However, relaxing this inclusion criterion to potentially capture molecules detected in fewer isolates (e.g., ≥ 5 of 10 isolates, or ≥ 7 of 10 isolates) does not dramatically alter the total number of reported compounds associated with Candida, Enterococcus, or coagulase-negative Staphylococcus, as the number of compounds to fulfill our second inclusion criterion is reduced due to larger p-values after BH correction.
Admittedly, our choice of culture conditions were not optimized for the specific pathogen groups included in the present study, as we instead opted for the use of a growth medium that is already widely employed in the clinical microbiology laboratory setting, and which is known to support the growth of a wide range of human pathogens. It is possible, however, that alternative culture conditions could have yielded volatile metabolic fingerprints that were even more differential between groups. Furthermore, differences in cell densities observed at the time of harvest may have also contributed to differences in the volatile metabolic profiles observed between pathogen groups. However, it is unlikely that such differences could account for the differences observed between the Gram-negative pathogen groups, as well as S. aureus, as these groups attained similar cell densities at 12 h post-inoculation. Finally, although LOOCV was employed, the inclusion of an independent validation set could have served to demonstrate additional robustness of the statistical tools used. Future studies could consider translation of our current findings to clinical specimens, or perhaps address more fundamental questions pertaining to the origins of these volatile metabolites.
Conclusions
Volatile metabolic profiling represents a powerful approach for identification and characterization of different bacterial and fungal pathogen groups. The molecules detected have the potential to aid in the diagnosis of different infectious diseases or provide novel insight into underlying cellular metabolic processes. Translation of volatile metabolic fingerprinting to the clinical setting will require the identification of biomarkers capable of differentiating between key pathogen groups, and a careful evaluation of key diagnostic parameters, including accuracy, sensitivity, and specificity.
Supplementary Material
Acknowledgments
This work was supported by National Institutes of Health grant R21 AI121076 to JE Hill and Lennart KA Lundblad. Dartmouth College holds an Institutional Program Unifying Population and Laboratory Based Sciences award from the Burroughs Wellcome Fund, and CA Rees was supported by this grant (Grant#1014106). P-H. Stefanuto is a Marie-Curie COFUND postdoctoral fellow co-funded by the European Union and the University of Liège. We thank Elissa M Eckhardt and the team at the Clinical Microbiology Laboratory at Dartmouth-Hitchcock Medical Center for generously providing the isolates used in this study.
References
- 1.Schulz S, Dickschat JS. Bacterial volatiles: the smell of small organisms. Nat Prod Rep. 2007;24:814–42. doi: 10.1039/b507392h. [DOI] [PubMed] [Google Scholar]
- 2.Bos LD, Sterk PJ, Schultz MJ. Volatile metabolites of pathogens: a systematic review. PLoS Pathog. 2013;9:e1003311. doi: 10.1371/journal.ppat.1003311. [DOI] [PMC free article] [PubMed] [Google Scholar]
- 3.Martins C, Brandao T, Almeida A, Rocha SM. Metabolomics strategy for the mapping of volatile exometabolome from Saccharomyces spp. widely used in the food industry based on comprehensive two-dimensional gas chromatography. J Sep Sci. 2017;40:2228–2237. doi: 10.1002/jssc.201601296. [DOI] [PubMed] [Google Scholar]
- 4.Lonsdale CL, Taba B, Queralto N, Lukaszewski RA, Martino RA, Rhodes PA, Lim SH. The use of colorimetric sensor arrays to discriminate between pathogenic bacteria. PLoS One. 2013;8:e62726. doi: 10.1371/journal.pone.0062726. [DOI] [PMC free article] [PubMed] [Google Scholar]
- 5.Koo S, Thomas HR, Daniels SD, Lynch RC, Fortier SM, Shea MM, Rearden P, Comolli JC, Baden LR, Marty FM. A breath fungal secondary metabolite signature to diagnose invasive aspergillosis. Clin Infect Dis. 2014;59:1733–40. doi: 10.1093/cid/ciu725. [DOI] [PMC free article] [PubMed] [Google Scholar]
- 6.Schnabel R, Fijten R, Smolinska A, Dallinga J, Boumans ML, Stobberingh E, Boots A, Roekaerts P, Bergmans D, van Schooten FJ. Analysis of volatile organic compounds in exhaled breath to diagnose ventilator-associated pneumonia. Sci Rep. 2015;5:17179. doi: 10.1038/srep17179. [DOI] [PMC free article] [PubMed] [Google Scholar]
- 7.Sethi S, Nanda R, Chakraborty T. Clinical application of volatile organic compound analysis for detecting infectious diseases. Clin Microbiol Rev. 2013;26:462–75. doi: 10.1128/CMR.00020-13. [DOI] [PMC free article] [PubMed] [Google Scholar]
- 8.Vincent JL, et al. Sepsis in European intensive care units: results of the SOAP study. Crit Care Med. 2006;34:344–53. doi: 10.1097/01.ccm.0000194725.48928.3a. [DOI] [PubMed] [Google Scholar]
- 9.Luzzaro F, Ortisi G, Larosa M, Drago M, Brigante G, Gesu G. Prevalence and epidemiology of microbial pathogens causing bloodstream infections: results of the OASIS multicenter study. Diagn Microbiol Infect Dis. 2011;69:363–9. doi: 10.1016/j.diagmicrobio.2010.10.016. [DOI] [PubMed] [Google Scholar]
- 10.Flores-Mireles AL, Walker JN, Caparon M, Hultgren SJ. Urinary tract infections: epidemiology, mechanisms of infection and treatment options. Nature Rev Microbiol. 2015;13:269–84. doi: 10.1038/nrmicro3432. [DOI] [PMC free article] [PubMed] [Google Scholar]
- 11.Vincent JL, et al. International study of the prevalence and outcomes of infection in intensive care units. J Am Med Assoc. 2009;302:2323–9. doi: 10.1001/jama.2009.1754. [DOI] [PubMed] [Google Scholar]
- 12.Bean HD, Dimandja JM, Hill JE. Bacterial volatile discovery using solid phase microextraction and comprehensive two-dimensional gas chromatography-time-of-flight mass spectrometry. J Chromatogr B Analyt Technol Biomed Life Sci. 2012;901:41–6. doi: 10.1016/j.jchromb.2012.05.038. [DOI] [PMC free article] [PubMed] [Google Scholar]
- 13.Bean HD, Rees CA, Hill JE. Comparative analysis of the volatile metabolomes of Pseudomonas aeruginosa clinical isolates. J Breath Res. 2016;10:047102. doi: 10.1088/1752-7155/10/4/047102. [DOI] [PMC free article] [PubMed] [Google Scholar]
- 14.Rees CA, Shen A, Hill JE. Characterization of the Clostridium difficile volatile metabolome using comprehensive two-dimensional gas chromatography time-of-flight mass spectrometry. J Chromatogr B Analyt Technol Biomed Life Sci. 2016;1039:8–16. doi: 10.1016/j.jchromb.2016.11.009. [DOI] [PubMed] [Google Scholar]
- 15.Rees CA, Smolinska A, Hill JE. The volatile metabolome of Klebsiella pneumoniae in human blood. J Breath Res. 2016;10:027101. doi: 10.1088/1752-7155/10/2/027101. [DOI] [PubMed] [Google Scholar]
- 16.Costa CP, Goncalves Silva D, Rudnitskaya A, Almeida A, Rocha SM. Shedding light on Aspergillus niger volatile exometabolome. Sci Rep. 2016;6:27441. doi: 10.1038/srep27441. [DOI] [PMC free article] [PubMed] [Google Scholar]
- 17.Jones SE, Ho L, Rees CA, Hill JE, Nodwell JR, Elliot MA. Streptomyces exploration is triggered by fungal interactions and volatile signals. Elife. 2017;6 doi: 10.7554/eLife.21738. [DOI] [PMC free article] [PubMed] [Google Scholar]
- 18.Syhre M, Manning L, Phuanukoonnon S, Harino P, Chambers ST. The scent of Mycobacterium tuberculosis–part II breath. Tuberculosis (Edinb) 2009;89:263–6. doi: 10.1016/j.tube.2009.04.003. [DOI] [PubMed] [Google Scholar]
- 19.Scott-Thomas AJ, Syhre M, Pattemore PK, Epton M, Laing R, Pearson J, Chambers ST. 2-Aminoacetophenone as a potential breath biomarker for Pseudomonas aeruginosa in the cystic fibrosis lung. BMC Pulm Med. 2010;10:56. doi: 10.1186/1471-2466-10-56. [DOI] [PMC free article] [PubMed] [Google Scholar]
- 20.Weisburg WG, Barns SM, Pelletier DA, Lane DJ. 16S ribosomal DNA amplification for phylogenetic study. J Bacteriol. 1991;173:697–703. doi: 10.1128/jb.173.2.697-703.1991. [DOI] [PMC free article] [PubMed] [Google Scholar]
- 21.Frank JA, Reich CI, Sharma S, Weisbaum JS, Wilson BA, Olsen GJ. Critical evaluation of two primers commonly used for amplification of bacterial 16S rRNA genes. Appl Environ Microbiol. 2008;74:2461–70. doi: 10.1128/AEM.02272-07. [DOI] [PMC free article] [PubMed] [Google Scholar]
- 22.Ferrer C, Colom F, Frases S, Mulet E, Abad JL, Alio JL. Detection and identification of fungal pathogens by PCR and by ITS2 and 5.8S ribosomal DNA typing in ocular infections. J Clin Microbiol. 2001;39:2873–9. doi: 10.1128/JCM.39.8.2873-2879.2001. [DOI] [PMC free article] [PubMed] [Google Scholar]
- 23.Rees CA, Nordick KV, Franchina FA, Lewis AE, Hirsch EB, Hill JE. Volatile metabolic diversity of Klebsiella pneumoniae in nutrientreplete conditions. Metabolomics. 2017;13 doi: 10.1007/s11306-016-1161-z. [DOI] [PMC free article] [PubMed] [Google Scholar]
- 24.Mellors T, Rees C, Wieland-Alter W, von Reyn CF, Hill JE. The volatile molecule signature of four mycobacteria species. J Breath Res. 2017 doi: 10.1088/1752-7163/aa6e06. [DOI] [PubMed] [Google Scholar]
- 25.Dieterle F, Ross A, Schlotterbeck G, Senn H. Probabilistic quotient normalization as robust method to account for dilution of complex biological mixtures. Application in 1H NMR metabonomics. Anal Chem. 2006;78:4281–90. doi: 10.1021/ac051632c. [DOI] [PubMed] [Google Scholar]
- 26.Mann HB, Whitney DR. On a Test of Whether One of 2 Random Variables Is Stochastically Larger Than the Other. Ann Math Stat. 1947;18:50–60. [Google Scholar]
- 27.Benjamini Y, Hochberg Y. Controlling the False Discovery Rate - a Practical and Powerful Approach to Multiple Testing. J R Stat Soc Series B Stat Methodol. 1995;57:289–300. [Google Scholar]
- 28.Epskamp S, Cramer AOJ, Waldorp LJ, Schmittmann VD, Borsboom D. qgraph: Network Visualizations of Relationships in Psychometric Data. J Stat Softw. 2012;48:1–18. [Google Scholar]
- 29.Breiman L. Random forests. Machine Learning. 2001;45:5–32. [Google Scholar]
- 30.Williams KP, Gillespie JJ, Sobral BW, Nordberg EK, Snyder EE, Shallom JM, Dickerman AW. Phylogeny of gammaproteobacteria. J Bacteriol. 2010;192:2305–14. doi: 10.1128/JB.01480-09. [DOI] [PMC free article] [PubMed] [Google Scholar]
- 31.Phillips M, Cataneo RN, Chaturvedi A, Kaplan PD, Libardoni M, Mundada M, Patel U, Zhang X. Detection of an extended human volatome with comprehensive two-dimensional gas chromatography time-of-flight mass spectrometry. PLoS One. 2013;8:e75274. doi: 10.1371/journal.pone.0075274. [DOI] [PMC free article] [PubMed] [Google Scholar]
- 32.Nizio KD, Perrault KA, Troobnikoff AN, Ueland M, Shoma S, Iredell JR, Middleton PG, Forbes SL. In vitro volatile organic compound profiling using GCxGC-TOFMS to differentiate bacteria associated with lung infections: a proof-of-concept study. J Breath Res. 2016;10:026008. doi: 10.1088/1752-7155/10/2/026008. [DOI] [PubMed] [Google Scholar]
- 33.Rees CA, Franchina FA, Nordick KV, Kim PJ, Hill JE. Expanding the Klebsiella pneumoniae volatile metabolome using advanced analytical instrumentation for the detection of novel metabolites. J Appl Microbiol. 2016;122:785–795. doi: 10.1111/jam.13372. [DOI] [PubMed] [Google Scholar]
- 34.Mellors TR, Blanchet L, Flynn JL, Tomko J, O’Malley M, Scanga CA, Lin PL, Hill JE. A new method to evaluate macaque health using exhaled breath: A case study of M. tuberculosis in a BSL-3 setting. J Appl Physiol (1985) 2017;122:695–701. doi: 10.1152/japplphysiol.00888.2016. [DOI] [PMC free article] [PubMed] [Google Scholar]
- 35.Julak J, Prochazkova-Francisci E, Stranska E, Rosova V. Evaluation of exudates by solid phase microextraction-gas chromatography. J Microbiol Methods. 2003;52:115–22. doi: 10.1016/s0167-7012(02)00148-3. [DOI] [PubMed] [Google Scholar]
- 36.Coloe PJ. Head-space gas liquid chromatography for rapid detection of Escherichia coli and Proteus mirabilis in urine. J Clin Pathol. 1978;31:365–9. doi: 10.1136/jcp.31.4.365. [DOI] [PMC free article] [PubMed] [Google Scholar]
- 37.Roine A, et al. Rapid and accurate detection of urinary pathogens by mobile IMS-based electronic nose: a proof-of-principle study. PLoS One. 2014;9:e114279. doi: 10.1371/journal.pone.0114279. [DOI] [PMC free article] [PubMed] [Google Scholar]
- 38.Lim SH, et al. Colorimetric sensor array allows fast detection and simultaneous identification of sepsis-causing bacteria in spiked blood culture. J Clin Microbiol. 2014;52:592–8. doi: 10.1128/JCM.02377-13. [DOI] [PMC free article] [PubMed] [Google Scholar]
- 39.Bruins M, Bos A, Petit PL, Eadie K, Rog A, Bos R, van Ramshorst GH, van Belkum A. Device-independent, real-time identification of bacterial pathogens with a metal oxide-based olfactory sensor. Eur J Clin Microbiol Infect Dis. 2009;28:775–80. doi: 10.1007/s10096-009-0700-1. [DOI] [PMC free article] [PubMed] [Google Scholar]
- 40.Hug LA, et al. A new view of the tree of life. Nat Microbiol. 2016;1:16048. doi: 10.1038/nmicrobiol.2016.48. [DOI] [PubMed] [Google Scholar]
- 41.Boots AW, Smolinska A, van Berkel JJ, Fijten RR, Stobberingh EE, Boumans ML, Moonen EJ, Wouters EF, Dallinga JW, Van Schooten FJ. Identification of microorganisms based on headspace analysis of volatile organic compounds by gas chromatography-mass spectrometry. J Breath Res. 2014;8:027106. doi: 10.1088/1752-7155/8/2/027106. [DOI] [PubMed] [Google Scholar]
- 42.Liang JC, Hang YP, Chingin K, Hu LH, Chen HW. Rapid differentiation of microbial cultures based on the analysis of headspace volatiles by atmospheric pressure chemical ionization mass spectrometry. Rsc Advances. 2014;4:25326–25329. [Google Scholar]
- 43.O’Hara M, Mayhew CA. A preliminary comparison of volatile organic compounds in the headspace of cultures of Staphylococcus aureus grown in nutrient, dextrose and brain heart bovine broths measured using a proton transfer reaction mass spectrometer. J Breath Res. 2009;3:027001. doi: 10.1088/1752-7155/3/2/027001. [DOI] [PubMed] [Google Scholar]
- 44.Dryahina K, Sovova K, Nemec A, Spanel P. Differentiation of pulmonary bacterial pathogens in cystic fibrosis by volatile metabolites emitted by their in vitro cultures: Pseudomonas aeruginosa, Staphylococcus aureus, Stenotrophomonas maltophilia and the Burkholderia cepacia complex. J Breath Res. 2016;10:037102. doi: 10.1088/1752-7155/10/3/037102. [DOI] [PubMed] [Google Scholar]
- 45.Filipiak W, Sponring A, Baur MM, Filipiak A, Ager C, Wiesenhofer H, Nagl M, Troppmair J, Amann A. Molecular analysis of volatile metabolites released specifically by Staphylococcus aureus and Pseudomonas aeruginosa. BMC Microbiol. 2012;12:113. doi: 10.1186/1471-2180-12-113. [DOI] [PMC free article] [PubMed] [Google Scholar]
- 46.Junger M, Vautz W, Kuhns M, Hofmann L, Ulbricht S, Baumbach JI, Quintel M, Perl T. Ion mobility spectrometry for microbial volatile organic compounds: a new identification tool for human pathogenic bacteria. Appl Microbiol Biotechnol. 2012;93:2603–14. doi: 10.1007/s00253-012-3924-4. [DOI] [PMC free article] [PubMed] [Google Scholar]
- 47.Fend R, Kolk AH, Bessant C, Buijtels P, Klatser PR, Woodman AC. Prospects for clinical application of electronic-nose technology to early detection of Mycobacterium tuberculosis in culture and sputum. J Clin Microbiol. 2006;44:2039–45. doi: 10.1128/JCM.01591-05. [DOI] [PMC free article] [PubMed] [Google Scholar]
- 48.Crespo E, de Ronde H, Kuijper S, Pol A, Kolk AH, Cristescu SM, Anthony RM, Harren FJ. Potential biomarkers for identification of mycobacterial cultures by proton transfer reaction mass spectrometry analysis. Rapid Commun Mass Spectrom. 2012;26:679–85. doi: 10.1002/rcm.6139. [DOI] [PubMed] [Google Scholar]
- 49.McNerney R, Mallard K, Okolo PI, Turner C. Production of volatile organic compounds by mycobacteria. FEMS Microbiol Lett. 2012;328:150–6. doi: 10.1111/j.1574-6968.2011.02493.x. [DOI] [PubMed] [Google Scholar]
- 50.Nawrath T, Mgode GF, Weetjens B, Kaufmann SH, Schulz S. The volatiles of pathogenic and nonpathogenic mycobacteria and related bacteria. Beilstein J Org Chem. 2012;8:290–9. doi: 10.3762/bjoc.8.31. [DOI] [PMC free article] [PubMed] [Google Scholar]
- 51.Preti G, Thaler E, Hanson CW, Troy M, Eades J, Gelperin A. Volatile compounds characteristic of sinus-related bacteria and infected sinus mucus: analysis by solid-phase microextraction and gas chromatography-mass spectrometry. J Chromatogr B Analyt Technol Biomed Life Sci. 2009;877:2011–8. doi: 10.1016/j.jchromb.2009.05.028. [DOI] [PubMed] [Google Scholar]
- 52.Scotter JM, Langford VS, Wilson PF, McEwan MJ, Chambers ST. Real-time detection of common microbial volatile organic compounds from medically important fungi by Selected Ion Flow Tube-Mass Spectrometry (SIFT-MS) J Microbiol Methods. 2005;63:127–34. doi: 10.1016/j.mimet.2005.02.022. [DOI] [PubMed] [Google Scholar]
- 53.Casalinuovo IA, Di Pierro D, Bruno E, Di Francesco P, Coletta M. Experimental use of a new surface acoustic wave sensor for the rapid identification of bacteria and yeasts. Lett Appl Microbiol. 2006;42:24–29. doi: 10.1111/j.1472-765X.2005.01792.x. [DOI] [PubMed] [Google Scholar]
- 54.Sahgal N, Monk B, Wasil M, Magan N. Trichophyton species: use of volatile fingerprints for rapid identification and discrimination. Br J Dermatol. 2006;155:1209–16. doi: 10.1111/j.1365-2133.2006.07549.x. [DOI] [PubMed] [Google Scholar]
- 55.Sahgal N, Magan N. Fungal volatile fingerprints: Discrimination between dermatophyte species and strains by means of an electronic nose. Sens Actuators B Chem. 2008;131:117–120. [Google Scholar]
- 56.Aksebzeci BH, Asyali MH, Kahraman Y, Er O, Kaya E, Ozbilge H, Kara S. Classification of root canal microorganisms using electronic-nose and discriminant analysis. Biomed Eng Online. 2010;9:77. doi: 10.1186/1475-925X-9-77. [DOI] [PMC free article] [PubMed] [Google Scholar]
- 57.Bazemore RA, Feng J, Cseke L, Podila GK. Biomedically important pathogenic fungi detection with volatile biomarkers. J Breath Res. 2012;6:016002. doi: 10.1088/1752-7155/6/1/016002. [DOI] [PubMed] [Google Scholar]
- 58.Hertel M, Hartwig S, Schutte E, Gillissen B, Preissner R, Schmidt-Westhausen AM, Paris S, Kastner I, Preissner S. Identification of signature volatiles to discriminate Candida albicans, glabrata, krusei and tropicalis using gas chromatography and mass spectrometry. Mycoses. 2016;59:117–26. doi: 10.1111/myc.12442. [DOI] [PubMed] [Google Scholar]
- 59.Kuntzel A, Fischer S, Bergmann A, Oertel P, Steffens M, Trefz P, Miekisch W, Schubert JK, Reinhold P, Kohler H. Effects of biological and methodological factors on volatile organic compound patterns during cultural growth of Mycobacterium avium ssp. paratuberculosis. J Breath Res. 2016;10:037103. doi: 10.1088/1752-7155/10/3/037103. [DOI] [PubMed] [Google Scholar]
- 60.Probert CS, Jones PR, Ratcliffe NM. A novel method for rapidly diagnosing the causes of diarrhoea. Gut. 2004;53:58–61. doi: 10.1136/gut.53.1.58. [DOI] [PMC free article] [PubMed] [Google Scholar]
- 61.Scotter JM, Allardyce RA, Langford VS, Hill A, Murdoch DR. The rapid evaluation of bacterial growth in blood cultures by selected ion flow tube-mass spectrometry (SIFT-MS) and comparison with the BacT/ALERT automated blood culture system. J Microbiol Methods. 2006;65:628–31. doi: 10.1016/j.mimet.2005.09.016. [DOI] [PubMed] [Google Scholar]
- 62.Ballabio C, Cristoni S, Puccio G, Kohler M, Sala MR, Brambilla P, Martinez-Lozano Sinues P. Rapid identification of bacteria in blood cultures by mass-spectrometric analysis of volatiles. J Clin Pathol. 2014;67:743–6. doi: 10.1136/jclinpath-2014-202301. [DOI] [PubMed] [Google Scholar]
- 63.Dolch ME, Janitza S, Boulesteix AL, Grassmann-Lichtenauer C, Praun S, Denzer W, Schelling G, Schubert S. Gram-negative and -positive bacteria differentiation in blood culture samples by headspace volatile compound analysis. J Biol Res (Thessalon) 2016;23:3. doi: 10.1186/s40709-016-0040-0. [DOI] [PMC free article] [PubMed] [Google Scholar]
- 64.Hall KK, Lyman JA. Updated review of blood culture contamination. Clin Microbiol Rev. 2006;19:788–802. doi: 10.1128/CMR.00062-05. [DOI] [PMC free article] [PubMed] [Google Scholar]
- 65.Mehrad B, Clark NM, Zhanel GG, Lynch JP., 3rd Antimicrobial resistance in hospital-acquired gram-negative bacterial infections. Chest. 2015;147:1413–1421. doi: 10.1378/chest.14-2171. [DOI] [PMC free article] [PubMed] [Google Scholar]
Associated Data
This section collects any data citations, data availability statements, or supplementary materials included in this article.