Abstract
Thermal fluctuations in cell membranes manifest as an excess area which governs a multitude of physical process at the sub-micron scale. We present a theoretical framework, based on an in silico tether pulling method, which may be used to reliably estimate in live cells. We perform our simulations in two different thermodynamic ensembles: (i) the constant projected area and (ii) the constant frame tension ensembles and show the equivalence of our results in the two. The tether forces estimated from our simulations compare well with our experimental measurements for tethers extracted from ruptured GUVs and HeLa cells. We demonstrate the significance and validity of our method by showing that all our calculations performed in the initial tether formation regime (i.e., when the length of the tether is comparable to its radius) along with experiments of tether extraction in 15 different cell types collapse onto two unified scaling relationships mapping tether force, tether radius, bending stiffness κ, and membrane tension σ. We show that ℛbead is an important determinant of the radius of the extracted tether, which is equal to the characteristic length for ℛbead < ξ, and is equal to ℛbead for ℛbead > ξ. We also find that the estimated excess area follows a linear scaling behavior that only depends on the true value of for the membrane, based on which we propose a self-consistent technique to estimate the range of excess membrane areas in a cell.
Keywords: membrane excess area, membrane tether, tether pulling, umbrella sampling, dynamically triangulated Monte Carlo
1. Introduction
The mechanical properties of a cell can be used as a surrogate marker to identify cellular phenotypes. Mechanical characterization has been particularly useful in identifying a number of pathophysiologies — well known examples include the stiffening of malaria infected erythrocytes and hepatocytes, the softening of metastatic cancer cells, and the sickle shape of an erythrocyte laden with hemoglobin S [1, 2, 3]. Several works in biomechanics have aimed to characterize cells based on mechanical measurements using a wide range of techniques such as flow and optical cytometry, manipulation using micropipette aspiration, optical tweezers and laser traps, and microfluidic devices (see [1, 4, 5] for comprehensive reviews). These studies have focused on whole cell measurements and hence have investigated the relationship between the mechanotype and pathophysiology at the cellular and tissue scales. In many cases, the changes in mechanical properties are primarily caused by variations in the structure and organization of the cellular cytoskeleton [6] and the extracellular matrix [7]. Such subcellular scale rearrangements can significantly impact not only the mechanical properties of the cell membrane but also can significantly impact geometrical properties such as cell membrane excess area at length-scales smaller than cellular dimensions (i.e., tens of nanometers to less than one micron).
This length scale under discussion significantly impacts the ability of the cell membrane as an effective organizer and a host for functional signaling complexes. For example, a bi-directional coupling can be established between the cell exterior and cell interior in a “geometry-dependent” fashion through the control of membrane excess area [8], because is the conjugate variable for membrane tension as well as the membrane curvature. Several mechano-sensitive signaling events can therefore be transduced via the regulation in : they include cell-ECM interactions, which can tune acto-myosin tension and influence cell-proliferation through integrin-mediated signaling pathways [9, 10, 11]. Glycocalyx remodeling can influence membrane-curvature distribution on the cell surface and initiate a proliferative cell-response, funneling through integrin-mediating signals [12]. Cellular recycling pathways responsible for cargo transport from the endosome to the plasma membrane can also induce and nucleate cell-membrane protrusions providing dominant mechanisms for cell migration and motility [13, 14]. These examples serve to reiterate how membrane excess area, in response to the tuning variables like tension, and by influencing the curvature distribution of the cell membrane, can transduce signals impacting cell-fate decisions.
The sub-cellular scale relevant to the above discussion corresponds to the dimensions primarily set by the cortical cytoskeletal mesh, which has been estimated to be between lc = 150 – 500 nm [15, 16]. The mechanical properties of a patch of the cell membrane that spans the region between multiple cytoskeletal pinning points, with typical dimensions lc, can differ from the bulk because the nature of the thermal undulations (and the associated conformational entropy of the membrane) depends directly on lc, and in turn influences the system’s free energy. We denote the size of the membrane patch as ℒpatch. The total area of the membrane (denoted by ) is in general larger than the projected area of the cytoskeletal mesh (denoted by ) [6, 17]. The characteristics of the membrane deformations and undulations can be described by a dimensionless scalar quantity called the membrane excess area given as and the membrane is taken to be flat when =0 and curved/ruffled if . The presence of excess area (and curvature gradients) can alter the local signaling microenvironment for a number of biophysical processes whose downstream components include curvature sensing proteins like BAR, Exo70, and ENTH domains [18, 19, 14]. Notable processes where modulations in the membrane excess area at the sub-cellular scale can significantly impact common cellular functions including intracellular transport of cargo or viral/bacterial internalization through exo-/endo-/phago-cytosis [20, 21], cell polarization [22, 23], and cell motility [24]. Hence it is logical to posit that the primary mechanisms linking the cell-microenvironment to cell fate can revolve around the physical factors impacting the membrane at length-scales below lc [6, 25, 8, 12, 26].
We note that a number of experimental studies have focused on how membranous reservoirs respond to perturbations in the physical environment of the cell. The estimates for excess membrane area determined using conventional morphometric measurements, involving osmotic shock assays and cryo-EM [27] do not delineate thermally undulating excess areas, which causes a mis-estimation of the area. Moreover, such methods, by averaging over the entire cell (or even 100s of cells), ignore the heterogeneity on the scale of lc at a single cell level or the asymmetry in membrane response that could exist in a polarized cell (where the basal and apical surfaces may sustain very different membrane properties). On other hand, tether pulling assays provide a powerful route to systematically study the various heterogeneities in the membrane surface [28, 29, 25, 30, 31, 32, 33, 34, 35], but their application to estimate membrane excess areas for all cell types is limited by the theoretical framework used for analysis. In this article, we propose a theoretical framework/computational model applicable to tether pulling assays to obtain reliable estimates for the membrane excess area. Unique to our modelling approach is a new methodology that allows incorporation of large deformations as well as thermal membrane undulations in the estimate.
2. Computational model
We consider a fluctuating membrane bounded by a square frame of size ℒpatch ~ lc. , , and are respectively the curvilinear, projected, and excess areas of the membrane. This choice represents a model for membrane with finite where the effect of the cytoskeleton is taken into account in a mean-field fashion. We note that more complex models of cytoskeletal interactions that explicit consider pinning have been reported [33, 36]. However, the mean field model we adopt here effectively captures the role of cytoskeletal pinning through the frame tension τ or the excess area ; details of the model are given below. We discretize the membrane surface into a triangulated surface that contains M triangles intersecting at N vertices and forming L links [37, 38] and the statistical weights of the membrane conformations are governed by the discrete form of the Canham-Helfrich Hamiltonian [39, 40]:
| (1) |
κ and σ are respectively the bending rigidity and the bare surface tension of the membrane, while τ is the frame tension that represents the effect of the boundary frame. The surface tension is coupled to the membrane curvilinear area while the frame tension is coupled to the projected area . c1,i and c2,i are the principal curvatures at a given vertex i computed as in our earlier work [41]. The area of the cell membrane obeys an incompressibility condition which is set by the area compressibility modulus KA. In our studies we take σ = 0. However when thermal undulations are taken into account, the effective surface tension in the membrane will be non-zero due to renormalization effects and a mapping between the renormalized tension and excess area has been quantified in our earlier work [42].
The configurations of a planar membrane patch can be evolved under two different thermodynamic conditions namely: (i) the constant N-σ-τ-T ensemble and (ii) the constant ensemble. In the former we hold σ and τ as constants and this is equivalent to experimentally extracting tethers in a constant N-P-T setting. The constant N-σ-τ-T ensemble was previously described in reference [43]. Since is a free variable in the N-σ-τ-T ensemble we constrain the value of by setting KA = 4.1 μN/m. On the other hand, in the constant - ensemble, in which we hold σ and as constants, is extremely useful to systematically investigate the effect of on the formation of membrane tethers. Since we fix we allow for area fluctuations in the constant ensemble by setting KA = 0.
The conformational states of the triangulated surface in both the constant N-σ-τ-T and ensembles are evolved using the dynamically triangulated Monte Carlo (MC) technique which consists of two independent MC moves: (i) a vertex move that simulates thermal fluctuations, (ii) a link flip that captures the fluid nature of biological membranes. For simulations in the constant N-σ-τ-T ensemble we also introduce an additional MC move: a boundary move that allows for changes in . Detailed information about the Monte Carlo techniques may be found in Suppl. Info., Sec. S1. A MC step consists of N vertex moves and L link flips that are performed at random and all the moves are accepted using the Metropolis scheme [44]. The boundary move is performed once in every 10 MC steps and is also accepted using the Metropolis scheme. All the simulations reported here have been performed using a membrane patch with N = 2601 vertices and the statistics are collected over 1.5 million MC steps following an equilibration run of the same duration.
For a given value of κ, σ and , the constant and N-σ-τ-T ensembles can be uniquely mapped from one to the other through the membrane excess area . This is demonstrated in Figure 1 where we have shown as a function of , in the constant N-σ-τ-T ensemble, for five different values of the frame tension τ=−412, −206, 0, 206 and 412 μN/m. The range of τ was chosen to correspond with experimentally measured cortical tension values in mammalian cells, for a review see Sens and Plastino [17]. It may be seen that has a unique value for every τ which decreases with increasing frame tension. Furthermore, is an intrinsic variable that only depends on τ and is independent of and and , both of which are extrinsic variables. This result clearly demonstrates the equivalence of the constant and N-σ-τ-T ensembles. The data shown in Figure 1 corresponds to a membrane with κ = 20 kBT and σ = 0 while similar results for κ = 40, 160 kBT may be found in Suppl. Info., Sec. S2.
Figure 1.
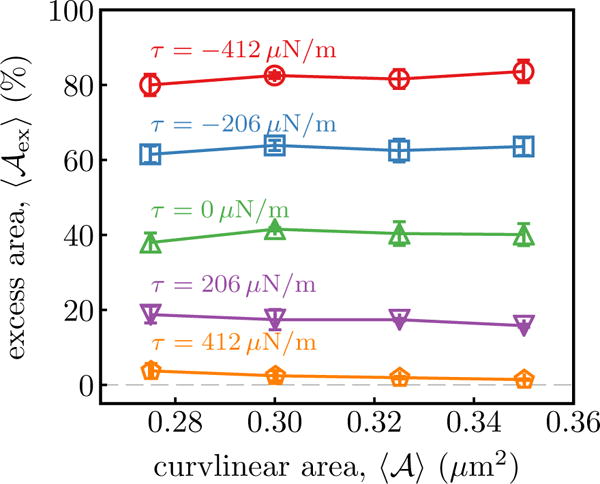
Equilibrium values of as a function of in the constant N-σ-τ-T ensemble. Data shown for five different values of τ=−412, −206, 0, 206 and 412 μN/m, for a membrane with κ = 20 kBT and σ = 0.
2.1. Analytical model for the membrane excess area
The excess area of a planar membrane in the small deformation limit (|∇h| ≪ 1, where h denotes the height of the membrane surface, measured with respect to the xy plane) can be analytically estimated to be [45, 46];
| (2) |
where q denotes the wavenumber of all possible undulation modes in the membrane and kB the Boltzmann constant. The effect of the frame tension τ does not enters into Equation (2) since it only contributes to the mode q = 0. The maximum value of the wavenumber is set by the size of the triangulated vertices a0 while its minimum value is set by the length scale lp with lp ≫ a0 and lp ≤ ℒpatch. We have performed all our analysis using three values of lp = 150, 250, and 510 nm that represent the variations in the cytoskeletal length-scales. We note that this model only has applicability in the regime of small when |∇h| ≪ 1 is satisfied and is expected to fail in regimes where the of the cell is not small (see Suppl. Info., Sec. S3 and S4).
2.2. In silico tether pulling assay
If ℱt be the force required to extract a tether of radius ℛt and length lt from the membrane patch, as illustrated in Figure 2, the total energy ℋtot, which has a contribution due to membrane deformations (Equation (1)) and an additional part from the work done to extract the tether (assuming that the tether is a perfect cylinder and ignoring thermal undulations), is given by [47]:
| (3) |
Minimization of the total energy with respect to lt and ℛt yields: (i) κ = ℱtℛt/(2π) and (ii) σ = ℱt/(4π ℛt). These relationships allow one to determine the elastic properties of the cell membrane through tether pulling experiments; however, the non-trivial geometry of a tether (which in general is not a perfect cylinder) and the underlying membrane patch (which is not a perfect planar entity but rather a ruffled surface subject to undulations, especially under high ) limits the applicability of Equation (3). To overcome these limitations, we have extended the umbrella sampling technique [48] to extract tethers of a specified length ℒt from a membrane in the ensemble. This is analogous to tether extraction in experiments where a constant outward force is applied on a selected region of the cell membrane through an AFM or an optical tweezer. In our model, we include a harmonic biasing potential of the form ℋbias = kbias(lt − ℒt)2/2 to Equation (1), per standard practice in umbrella sampling simulations. Here kbias is the spring constant of the biasing potential and ℒt is a reaction coordinate that denotes the prescribed length of the extruded tether. We performed umbrella sampling simulations at different values of ℒt and collected the biased tether length distribution, ; the window size for umbrella sampling simulations were chosen such that in successive windows overlap. The unbiased or equilibrium distribution of the tether length, , was computed from using the Weighted Histogram Analysis method (WHAM) [49, 50], which in turn was used to compute the potential of mean force for tether extraction as . In all our calculations we took kbias = 2.05 mN/nm2 and this value was chosen so that the undulation modes of the membrane remains unaltered.
Figure 2.
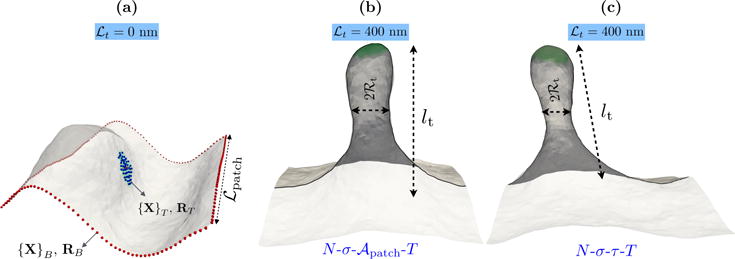
(a) Representative equilibrium conformation of a membrane with κ = 20 kBT and . The set of biased vertices at the tip ({XT}) and at the base ({XB}) are explicitly marked as spheres — RT and RB denote their respective center of masses. {XT} is the set of all vertices within a region of size ℛbead. The conformation of the membrane with a fully developed tether for ℒt=400 nm are shown in panels (b) and (c). The snapshot in panel (b) corresponds to a constant ensemble, while that in (c) corresponds to a constant N-σ-τ-T ensemble. lt and ℛt, the length and radius of the membrane tether, and the membrane dimension ℒpatch are also marked.
The length of the tether lt is defined using a macroscopic order parameter, determined from two different sets of vertices {XT} and {XB}, that are shown in Figure 2(a). RT and RB, which are also shown in Figure 2(a), represent the centers of mass of the chosen vertices that define the two macroscopic variables from which the instantaneous tether length is calculated as lt = |RT − RB|. While {XT} is predetermined at the start of the simulation, {XB} is computed at runtime and taken to be the set of all vertices at the boundary of the membrane patch (also see Suppl. Info., Sec. S10).
In a typical tether pulling assay, the bead used to extract the tether non-specifically binds to the membrane. To reflect this we choose the biased vertices in the tip to be a circular region of radius ℛbead; this is illustrated in Suppl. Info., Sec. S5. Since the non-specific binding does not control for the adhesive contact area, we vary the size of ℛbead in our simulations. The equilibrium configuration of a membrane patch with κ = 20 kBT and is shown in Figure 2(a). The representative conformations of the membrane tether stabilized for an imposed tether length of lt=400 nm in the constant and N-σ-τ-T ensembles are shown in Figure 2(b) and (c), respectively. It may be noted that simulations in both these ensembles yield identical tether conformations, which once again point to the equivalence of the two.
2.3. Potential of mean force
For a given membrane patch, independent simulations are performed to extract tethers within a given umbrella sampling window. For all simulations reported in this article, we use at least 64 windows each of width 5 nm — the number of windows required to extract fully developed tethers increases with increasing . Histograms of the instantaneous tether length in each of the windows are recorded for 1.5 million Monte Carlo steps and these statistics are converted to a potential of mean force (PMF) using the Weighted Histogram Analysis method [50]. The typical runtime for an umbrella-sampling window to sample 1.5 million MCS is around 36 hours on a 2.6 GHz processor.
2.4. Computing the radius and length of membrane tethers
The radius and length of the membrane tether ℛt and lt, respectively, can be determined exactly in the simulations, as shown in Figure 2(b). Let [r] be the set of all Nc vertices on the tubular region and rCM = (Nc)−1 Σi ri their center of mass: here ri is the three-dimensional position vector of vertex i in the Cartesian coordinates. The center of mass can be used to construct the gyration tensor as, whose eigenvalues are λ1, λ2, and λ3. Since the tethers formed are axi-symmetric we identify λ2 and λ3 using the relation λ2 ≈ λ3. Of the three eigenvalues, λ1 represents the length of the tether, with , and and represent its two principal radii. We estimate the average tether radius as .
3. Experimental Methods
3.1. Cell culture
HeLa cells were placed in 35 mm petridishes at 37° C in 5% CO2 in DMEM (Dulbecco’s Modified Eagle’s medium, Lonza) containing 10% FBS (Fetal Bovine Serum, Gibco) and 0.02% Penicillin/Streptomycin for 48 hours before commencing the experiment. A confluent culture of HeLa cells was treated with 0.25% Trypsin-EDTA (Gibco), detrypsinised in DMEM containing 10% FBS and seeded at a density of 80, 000 cells/coverslip (Ted Pella Inc., Redding), so that a single monolayer of cells are obtained on the coverslip.
3.2. Giant Unilamellar Vesicles (GUVs)
For the preparation of vesicles, 1, 2-dioleolyl-sn-glycero-3-phosphocholine (DOPC), 1, 2-dioleolyl-sn-glycero-3-phospho-L-serine (DOPS) (Avanti Polar, Alabaster, AL) and 1, 2-dioleolyl-sn-glycero-3-phospho-ethanolamine-N-(lissamine rhodamine B sulfonyl)(RhPE) (Invitrogen) stock solutions in chloroform, at room temperature were used. The lipid mix was aliquoted in a glass vial to a total lipid concentration of 1 mM at a ratio of DOPC:DOPS:RhPE (84:15:1 mol%).
Gel-assisted formation of GUVs were carried out using polyvinyl alcohol (PVA) as described earlier [51], with a few modifications as per the requirements of the experiments. In this method of GUV formation, a drop of 5% w/v degassed PVA (MW 145, 000, Sigma) in deionized water is added to a clean glass coverslip placed on a hot plate set at 75° C. The water gets evaporated in about 10 minutes leaving a dry thin film of PVA on the coverslip. To this, around 3 μL of the 1 mM lipid stock solution in chloroform was added to dry PVA while on the hot plate to let the chloroform evaporate. The thin film was peeled off and immersed in eppendorfs containing 20 mM HEPES, 150 mM NaCl, pH 7.4 with 100 mM sucrose. This immersed film was left undisturbed for around one hour followed by gentle tapping to release the GUVs from the PVA film to the buffer solution. The buffer containing large free floating GUVs (10-15 μm) was pipetted out and used for tether pulling experiments.
3.3. AFM Experiments
AFM-based force spectroscopic experiments were performed using Nanowizard II atomic force microscope (JPK Instruments). The AFM liquid cell was assembled with freshly cleaved mica discs prior to adding the GUV solution. The liquid cell was then mounted on the AFM stage and left undisturbed for 20 minutes to allow the vesicles to settle on the mica surface. Using a fluorescence microscope attached with the AFM set up, we could confirm that the GUVs settled on the surface and the floating ones were washed away by exchanging buffer solution with HBS. Subsequently, the GUVs got ruptured on the mica surface and they were imaged using AFM. The images obtained using AFM revealed the location and height of the ruptured GUV patches which matched with that of the height of a single bilayer membrane (5-6 nm). Force spectroscopy was then performed on these particular patches to pull membrane tethers. Silicon nitride cantilevers (MikroMasch CSC38/AlBS) were used for pulling the tethers. Cantilevers were calibrated before each experiment and its spring constant was determined using equipartition theorem [52]. The measured spring constant of the cantilevers used for most experiments was found to be range of 20-80 mN/m. Constant speed mode was used for approaching the tip to the sample surface followed by retraction at the same speed. The approach-retract cycle was repeated at various points on the membrane patch using force mapping tool built in Nanowizard II software and force-displacement curves were recorded. Force curves showing step profiles were selected and analyzed using JPK data processing software by fitting the curves with the in-built functions to measure the force minimum corresponding to the tether force and step heights in retraction force curves.
4. Results
4.1. Extraction of membrane tether proceeds through three distinct regimes
We first demonstrate the characteristics of a tether extracted from a model membrane with κ = 20 kBT and , using a bead size of ℛbead = 50 nm in the ensemble. The tether is extracted using the umbrella sampling technique described in the methods section, for reaction coordinate (imposed tether length) values in the range 0 < ℒt < 500 nm, with a window size of 5 nm. The top panel in Figure 3 shows representative snapshots of the membrane stabilized at four different values of ℒt = 0, 200, 300, and 450 nm. At small values of ℒt, the membrane conformations show large undulations whose magnitudes are set by the value of . However, at large values of ℒt, the membrane undulations are absorbed into the large out of plane protrusions that resemble a tether extracted from a planar membrane. It is noted that the shape of a fully developed tether (i.e., when the undulations in the planar region becomes very small) is consistent with that predicted for nearly planar membranes, using analytical methods [31, 53].
Figure 3.
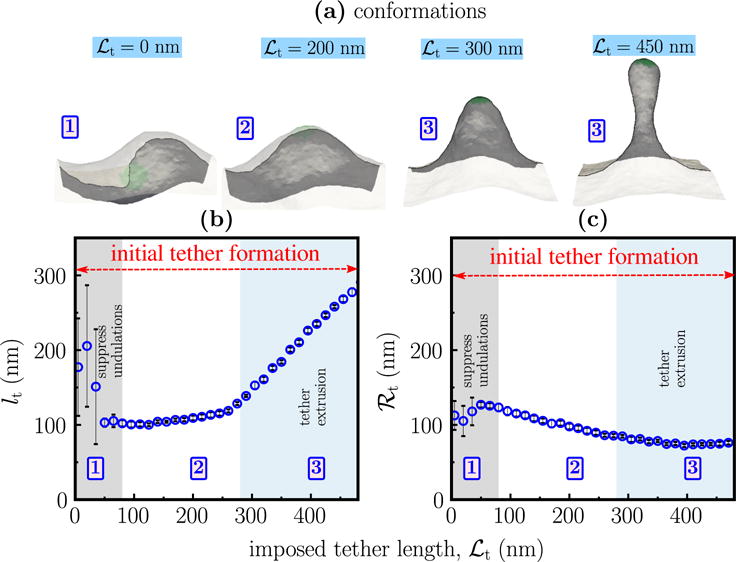
(a) Representative conformations of a membrane with κ = 20 kBT and as a function of ℒt. Panels (b) and (c) show the computed values of the tether length lt, and radius ℛt, respectively, as a function of ℒt. These quantities are computed as described in the methods section. The shaded regions mark the three regimes for initial tether formation (i.e., for lt/ℛt < 5) namely, regime 1: suppression of undulations, regime 2: formation of tethers, and regime 3: extrusion of tethers at a constant radius. The boxed numbers in the top panel denote the regimes to which the configurations correspond to.
The instantaneous length and radius of the tether region, denoted by lt and ℛt, as a function of the reaction coordinate ℒt, are shown in the middle and lower panels of Figure 3, respectively. Both lt and ℛt show non-monotonic behaviors with respect to ℒt, which are solely attributable to the non-zero excess area of the membrane. For membrane with thermal undulations, and hence non-zero excess areas, we identify three characteristic regimes for tether growth which are marked as shaded regions in the figure. These regions are characterized as follows:
Regime 1 (lt ≈ ℛt): for ℒt< 75 nm, where the tether radius and length are similar, the applied biasing potential only serves to suppress the short wavelength undulations in the membrane. This is reflected in the fact that the membrane conformations in this regime are not distinguishable from their equilibrium counterparts.
Regime 2 (lt ≈ constant and ℛt ∝ ℒt −1): for 75 < ℒt < 300 nm a pronounced protrusion is seen in the vicinity of the region where the biasing potential is applied. The radius of this protrusion decreases with increasing ℒt, while its length remains unchanged.
Regime 3 (ℛt ≈ constant and lt ∝ ℒt): for ℒt> 300 nm in Figure 3, the tether radius remains constant while its length increases linearly with ℒt, marking a region of tether growth. The linear increase in lt fails to hold when all excess area in the membrane is drawn into the tether region.
The extent of the three regimes, depend on the values of κ and . This is shown in the Suppl. Info., Sec. S6, where we have displayed the effects of and κ on the radius of the extracted tether. In conventional tether pulling experiments only regime 3 is well resolved, while regimes 1 and 2 are not commonly observed since these experiments do not have the required spatial resolution, as in our simulations, to resolve these regimes.
The characteristic length scale for a membrane, given by [54, 55], sets the limit below which curvature contributions are dominant. In our model, ξ is an increasing function of κ and — the latter may be deduced from the inverse relationship between σ and in Equation (2). In a tether pulling experiment performed in the ensemble, the radius of the extracted tether depends either on ξ or on the size of the biased region ℛbead used for tether extraction. This is shown in Figure 4 where we display the values of ℛt as a function of ℛbead, for κ = 20, 40, and 160 kBT and and 40%. The conformations shown in panel (a) for a membrane with κ = 20 kBT and , for ℒt = 300 nm, illustrates the interplay between the characteristic clearly length ξ and the imposed length ℛbead. While we observe fully grown and geometrically identical tethers for ℛbead ≤ 75 nm, we find the tether extracted with ℛbead = 100 nm to be significantly different. A fully grown tether for this regime is only obtained at a much larger value of ℒt. The radius of a fully grown tether is also a strong function of ℛbead and this feature is quantified in Figure 4(b) where we find the nearly constant tether radius (ℛt ~ 80 nm) for ℛbead ≤ 75 nm to show a marked increase to ℛt ~ 110 nm when ℛbead = 100 nm.
Figure 4.
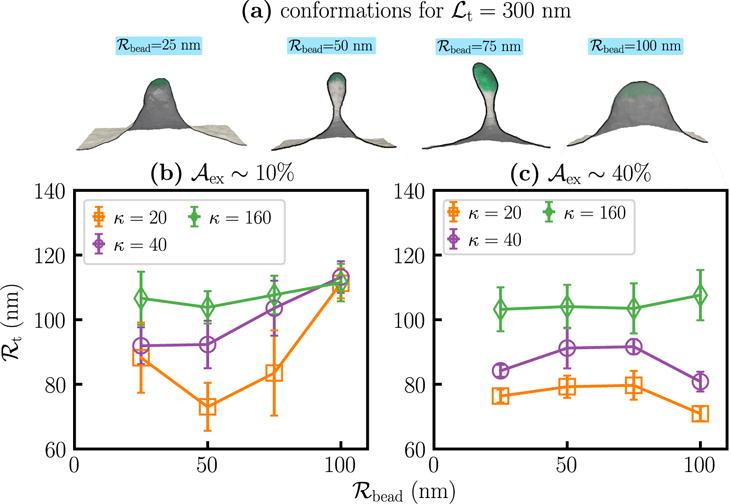
Dependence of the tether radius on the size of the biasing region. (a) Representative conformations of tethers, for ℒt=300 nm, extracted using beads with ℛbead = 25, 50, 75, and 100 nm, from a membrane with κ = 20 kBT and . Panels (b) and (c) show the computed values of ℛt, as a function of ℛbead, for κ = 20, 40, and 160 kB T for and 40%, respectively.
In panels (b) and (c) of Figure 4 two key features are worth noting: (i) as expected, the value of ℛt is an increasing function of κ for all values of ℛbead, and (ii) the dependence of ℛt on ℛbead is minimal for large values of κ and also when is large.
4.2. PMF and tether force
The PMF to extract a tether of length lt from a membrane patch of fixed is computed from the umbrella sampling data using the WHAM technique (see methods section). for a membrane with κ = 20 kBT and is shown in the top panel of Figure 5(a). The three characteristic regimes seen for ℛt (see Sec. Figure 4.1) are also reflected in the form of . Here, we again observe three scaling regimes : (i) an initial linear regime given by ℱ1lt, (ii) a second non-linear regime, ∝ lt2, and (iii) a final linear regime, ∝ ℱ2lt. Both the linear regimes are shown as solid lines in panel (a) of Figure 5 and the latter is attributable to tether extrusion at a constant radius, for which the elastic energy is expected to scale as ℋtot ∝ lt (Equation (3)). On the other hand, the source of the non-linear scaling is attributed to ℛt being a decreasing function of lt. We note that the scaling behavior is universal and is observed for all systems investigated.
Figure 5.
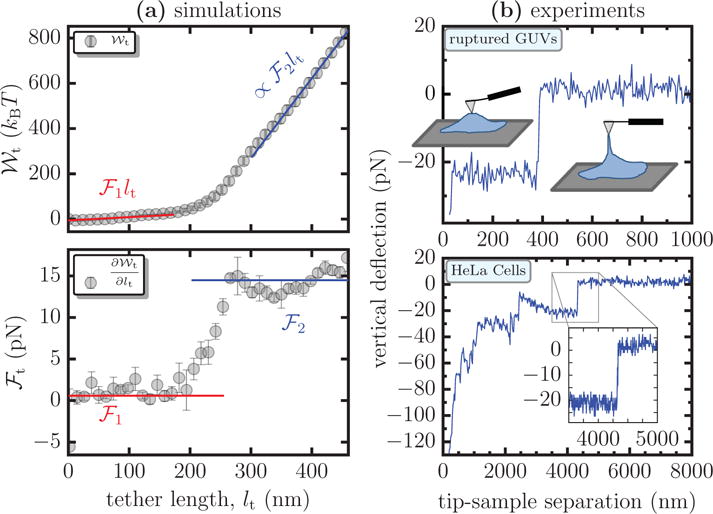
(a) The potential of mean force and the tether force ℱt, as a function of the tether length lt, for a membrane with κ = 20 kBT and . In the top panel, shows a linear scaling in regimes 1 and 3, which are represented by the functions ℱ1lt and ℱ2lt, respectively. The lower panel compares values of ℱt estimated from direct numerical differentiation of (symbols) to that obtained from the scaling relations (lines). (b) Force displacement curves for experimental tether pulling assay using ruptured GUVs (top panel) and HeLa cells (lower panel) – the inset shows a transition between regions of constant force. The illustration in the top panel shows the state of the membrane tether at various stages of the experiment. The vertical deflection of the AFM tip is measure of the tether force ℱt and its separation from the sample is a measure of the tether length lt.
The force required to extract the tether may be computed as where denotes a gradient with respect to lt. ℱt can be estimated either from direct numerical differentiation of or from the scaling relations — for the latter, ℱt = ℱ1 in regime 1 and ℱt = ℱ2 in regime 3. The tether forces computed using the two methods for in Figure 5(a) are shown in the lower panel — symbols and lines correspond to ℱt obtained using numerical differentiation and using the scaling relations, respectively. We find the estimates from both the methods to be in excellent agreement. Since direct numerical differentiation is subject to a large noise to signal ratio, we primarily rely on the scaling relation based method to estimate ℱt. As in experiments, we report the value of the force in the second regime as the tether force, i.e., ℱt ∼ ℱ2.
The tether force shown in Figure 5(a) has the same qualitative and quantitative behavior as that normally observed in experiments. The top and bottom panels in Figure 5(b) show forces required to extrude a tether from ruptured GUVs on mica and from HeLa cells, respectively — the tether extraction protocol is described in Suppl. Info., Sec. S7. The pulling speeds in both the experimental assays are taken to be 1 μm/s, which satisfies the assumption of quasi-equilibrium tether extraction employed in our simulations. Measurements at speeds less than that reported here are not possible due to the noise arising from cantilever thermal drift. Though there are no known techniques to calculate the precise value of for both systems, it is reasonable to assume that it is finite. Similarly, there are no reliable experimental methods to measure ℛbead, but given that the AFM tip-membrane interactions are non-specific in nature it is reasonable to assume that ℛbead < ξ.
While the force-displacement curves for both the systems depend on the properties of their respective bilayer membrane, in the case of HeLa cells there may be additional contributions due to the underlying cytoskeletal mesh. Though we would expect ruptured GUVs on a mica surface to be free of any pinning contacts, there could be a finite number of pinning sites due to the chemical heterogeneity on the surface in spite of the surface being atomically smooth. The salt concentration in the buffer may screen the interactions between the membrane and the mica surface leading to a sparse contact between the two and the effect of these non-specific contacts on the force-displacement curves are minimal. The forces measured in experiments match very well with the numerically computed values of ℱt. The measured tether force is about 20 pN for tethers pulled from both the ruptured GUVs and the HeLa cells. For the case of ruptured GUVs, the tether length at which we observe a transition to the tether extrusion regime is consistent with that seen in our simulations, while that for the cells is considerably higher extending into few microns. We attribute this deviation to the lack of a suitable reference frame for cellular measurements.
As noted in the introduction, the size of the cytoskeletal mesh (lc) bounding the cell membrane significantly influences the characteristics of the extracted tether. The current theoretical model only considers tethers from a homogeneous membrane with constant κ and . However, to zeroth order, the role of the cytoskeleton in suppressing long wavelength undulations beyond lc can be taken into account in our model by examining the dependence on the membrane patch size ℒpatch. In Figure 6, we investigate this effect by extracting tethers from two planar patches with ℒpatch = 510 nm and ℒpatch = 1.02 μm, which are representative of cell membranes scaffolded by dense and sparse cytoskeletal meshes, respectively. Panels (a) and (b) show data for membranes with κ = 20 and 40 kBT, respectively, for excess areas and 40%. It is evident from these figures that the PMF, and hence ℱt and ℛt, in addition to the elastic parameters κ and , are also functions of ℒpatch. This points to the fact the cell may have a heterogeneous mechanical microenvironment depending on the cytoskeletal mesh size and may provide varied response to biochemical processes, such as nanocarrier or viral binding, depending of the characteristic value of lc at the site of the process [36]. Hence, characterizing the mechanical properties of the cell membrane at the scale of lc would be extremely important. In the following, we will only focus on membrane patches with ℒpatch = 510 nm to establish how the excess area of the membrane can be inferred from tether pulling experiments.
Figure 6.
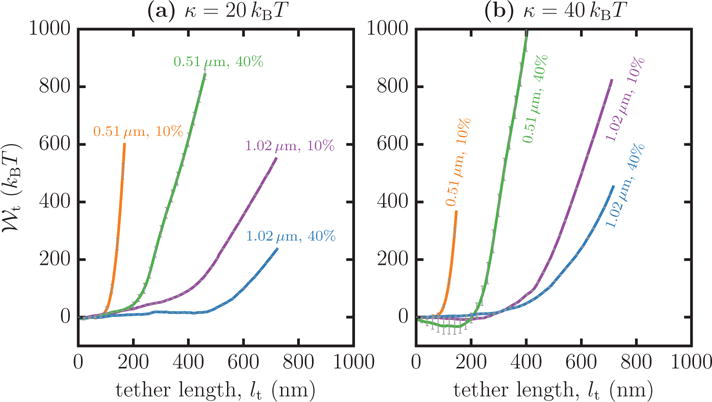
The potential of mean force as a function of the tether length lt, extracted with ℛbead = 50 nm, from membranes with ℒpatch = 0.51 μm and 1.02 μm, and excess areas and 40%. Data for κ= 20 kBT are shown in panel (a) and that for κ = 40 kBT is shown in panel (b).
It may be seen from Figure 6 that there are some subtle differences in the scaling behavior of the potential of mean force, , for small values of lt. The slope ℱ1 which characterizes the initial linear regime can either be positive or negative depending on the values of κ and . For instance, in Figure 6(b), the initial regime of for κ = 40 kBT and ℒpatch =510 nm has a positive slope for and a negative slope for . This can be understood by analyzing the value of the reaction coordinate of the membrane in its equilibrium state (i.e., at ℒt =0), which we denote as . This would correspond to the position of the minimum of . For systems with , the tether length lt increases with increasing imposed tether length ℒt, and as a result the potential of mean force increases linearly with a positive slope. On the other hand, for systems with , the tether length first decreases in the regime and increases for Since we always expect the position of the minimum of to be at , systems with would have a negative slope in the initial regime. This is characteristic of systems with large κ and , in which the curved morphologies of their native state [42] endow them with non-zero values of . We observe negative slopes in the initial regime for computed both in the constant and N-σ-τ-T ensembles, as is shown in Figures 7, 8 and 9.
Figure 7.
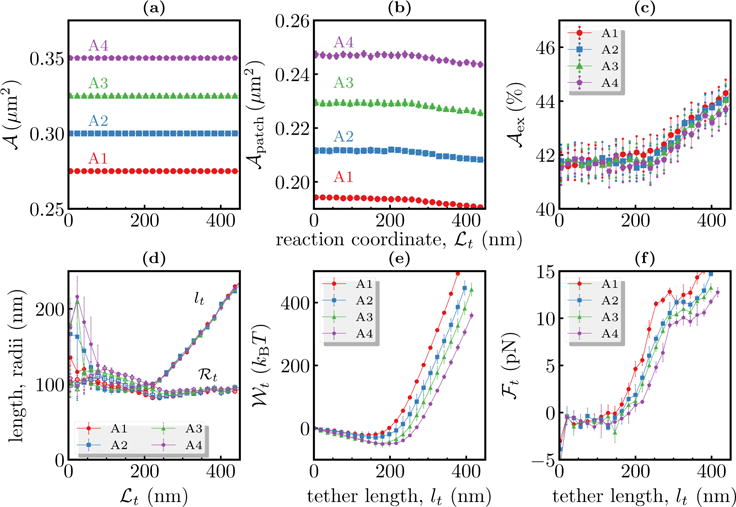
Comparison of tether characteristics in the constant N-σ-τ-T ensemble for four different membrane patches, denoted A1-A4. Panels (a), (b) and (c) show the area , projected area and excess area as a function of the reaction coordinate ℒt. The measured values of tether length lt and tether radius ℛt are shown in panel (d) as filled and open symbols, respectively. The potential of mean forces and the tether forces are shown in panels (e) and (f) as a function of the tether length lt.
Figure 8.
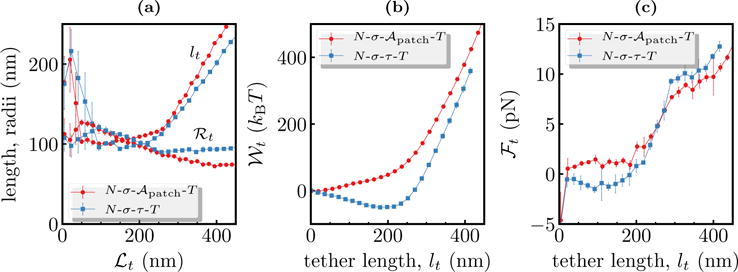
Comparison of tether characteristics in the constant and N-σ-τ-T ensembles. In panel (a), the tether length and radius are shown as open and filled symbols, respectively. The potential of mean forces (panel (e)) and tether force (panel (f)) are plotted as a function of the tether length lt. Data shown for a membrane with κ = 20 kBT.
Figure 9.
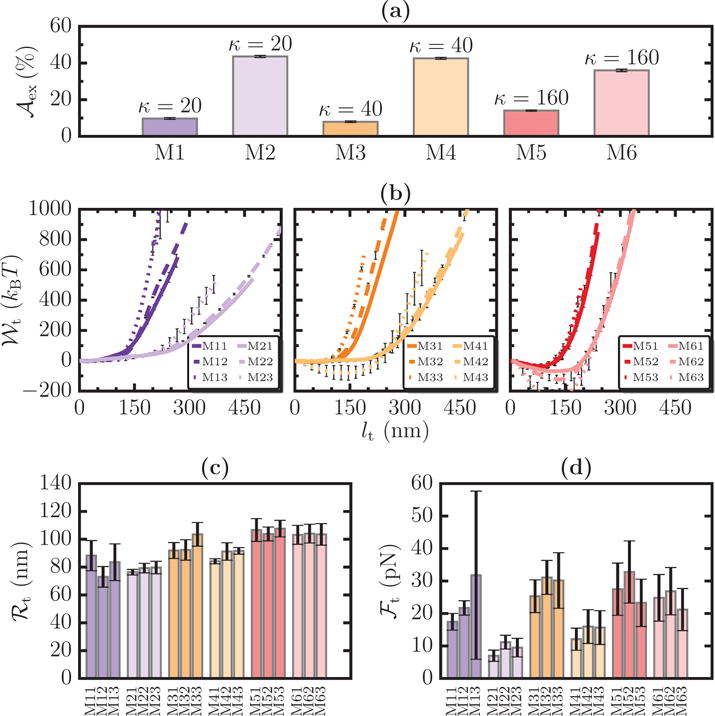
(a) Six model membrane systems, denoted M1–M6, with specified values of and κ. For any system Mi (i = 1 ⋯ 6), Mi1, Mi2, and Mi3 correspond to tethers extracted with ℛbead = 25, 50, and 75 nm, respectively. The values of , ℱt, and ℛt for all the systems are shown in panels (b), (c), and (d), respectively.
The dependence of on the size of the membrane patch is also seen in our simulations in the constant N-σ-τ-T ensemble. We extracted tethers from four different membrane patches that have similar excess areas but have different and ; here we initialized the systems as described in Suppl. Info., Sec. S11 and membrane patches with different were generated by changing , as described in Equation (1). The parameters for all the patches were taken to be κ = 20 kBT, τ = 0 and ℛbead=50 nm. In Figures 7 (a), (b), (c), where the four systems are marked A1-A4, we show the corresponding values of , , and as a function of the imposed tether length ℒt. Even at very large values of ℒt we only observe ~5% decrease in the value of which in turn leads to a similar increase in (see Figures 7 (b) and (c)). For all practical purposes, we can treat the membrane to have a nearly constant value of .
Figure 7 (d) shows the length and radius of the extracted tethers and as expected tether formation does not depend and but only on the membrane excess area. Similarly, the potential of mean force and the tether forces ℱt, that are displayed in Figures 7 (e) and (f), show a strong dependence on the membrane area . As in Figure 6, we find both and ℱt to be decreasing functions of . The observed reduction in and ℱt may be explained as follows. ℛt, the radius of a fully grown tether only depends on the elastic parameters as max , while its length lt is proportional to the degree of undulations in the membrane, i.e., lt is proportional to . For a given , since the amount of material stored in the form of undulations increases with increasing , the threshold length for tether growth without any elastic deformations is significantly higher for large membrane patches. Hence, tether growth in large membrane patches proceeds primarily through ironing out of thermal undulations, which requires smaller energy, compared to tether growth in smaller membrane patches in which higher energy elastic deformations dominate.
4.3. Comparison of tether characteristics in the constant and N-σ-τ-T ensembles
We had so far qualitatively established that tether extraction in both the constant and N-σ-τ-T ensembles yield similar results. Here we make a quantitative comparison of (i) ℛt (ii)lt (iii) and (iv)ℱt for tether extracted in the two ensembles for a membrane with κ = 20 kBT and . The N-σ-τ-T simulations were performed with τ = 0. The curvilinear area , projected area , and the excess area of the membrane patches in the two ensembles can be found in the Suppl. Info., Sec. S8. Though the values of and are different for both these systems they have similar excess areas (∼44% for the ensemble and ~42% for the N-σ-τ-T ensemble).
In Figure 8(a), we compare the measured values of ℛt and lt as a function of ℒt for tethers extracted using the two thermodynamic ensembles of interest. As noted before for the constant ensemble (see Figure 3) tether formation in the constant N-σ-τ-T ensemble also proceeds through three distinct regimes. The measured values of ℛt and lt display excellent quantitative agreement with their corresponding values measured in the constant ensemble.
The potentials of mean force for both systems, displayed in Figure 8(b), agree well for later values of lt but have different slopes at small lt, for the reasons mentioned in our discussions on Figure 6. On the other hand, the tether forces ℱt computed in the two ensembles show excellent qualitative and quantitative agreement, and this is displayed in Figure 8(c). These results categorically show that the choice of the thermodynamic ensemble should not influence our results. Therefore, all of our subsequent studies were performed in the constant ensemble.
4.4. Tether radii and forces measured in silico compare well with range of values measured in in vivo experiments
Pontes et. al. [56] have recently reported results for in vivo tether pulling assays studies of 15 different cell types in the central nervous system (CNS) — the data is also shown in the Suppl. Info., Sec. S9. Based on this study, we classify cells in the CNS into four distinct categories: (i) small κ (20 – 60kBT) & small σ, (ii) small κ & large σ, (iii) large κ (∼ 160 kBT) & small σ, and (iv) large κ & large σ. In order to establish the quantitative accuracy of our model, we compute the values of ℛt and ℱt for six model systems which are representative of the cells in the CNS. They are denoted by M1 (κ = 20 kBT, ), M2 (κ = 20 kBT, ), M3 (κ = 40 kBT, ), M4 (κ = 40 kBT, ), M5 (κ = 160 kBT, ), and M6 (κ = 160 kBT, ). These model systems are also depicted in Figure 9(a).
For each of the six model systems (Mi, with i = 1 ⋯ 6), we extracted tethers using three bead sizes, chosen to be ℛbead = 25, 50, and 75 nm. We denote each set of data as Mij, where j=1, 2, and 3 is the index for the three bead radii, respectively. The PMFs for these systems are displayed in Figure 9(b) and the presence of the three characteristic regimes for , discussed earlier, are evident. Despite a similarity in the scaling behavior, the values of are highly sensitive to changes in both ℛbead and the elastic parameters κ and , predominantly so for the latter. The average values of ℛt and ℱt for the model systems are displayed in Figure 9(c) and (d) respectively. ℛt is found to be independent of ℛbead and, as expected, we find: (i) for a given κ, ℛt is a decreasing function of (e.g. M1>M2), and (ii) for a fixed , ℛt is an increasing function of κ (e.g. M5>M3>M1). The tether force also shows a similar behavior, with ℱt being larger for systems with smaller and larger κ. The range of values for the tether force (10 < ℱt < 50 pN) and radius (60 < ℛt < 110 nm) measured in our simulations compare very well with the experiments of Pontes et. al. [56], where they report values in the range 15 < ℱt < 70 pN and 43 < ℛt < 158 nm. The large error bars seen for some systems are reflective of the rough free energy landscape for tether extraction under the prescribed conditions. This establishes the validity of our present model as a tool for interpreting tether pulling assays that aim to probe tethers in the nanoscopic scale.
Our results in Figure 10(a) and (b), depict the adherence to the constitutive relations derived by minimizing Equation (3). Briefly, the effective bending rigidity and the surface tension are expected as follow the relations κ/α = (2π)−1 and σ/Γ = (4π)−1, respectively. Here the scaling parameters are α = ℱtℛt/kBT and Γ = ℱt/ℛt. As can be seen from the figures, data from both our simulations (marked M1–M6 and shown as open symbols) and from the experiments of Pontes et. al. [56] (marked C1–C15 and shown as filled symbols) show a good collapse, with correlation coefficients of r2 = 0.846 for κ and r2 = 0.952 for σ, which further establishes the agreement of our calculations and the referred experiments with known scaling relationships. The dotted lines in Figure 10(a) and (b) correspond to (2π)−1 and (4π)−1, respectively.
Figure 10.
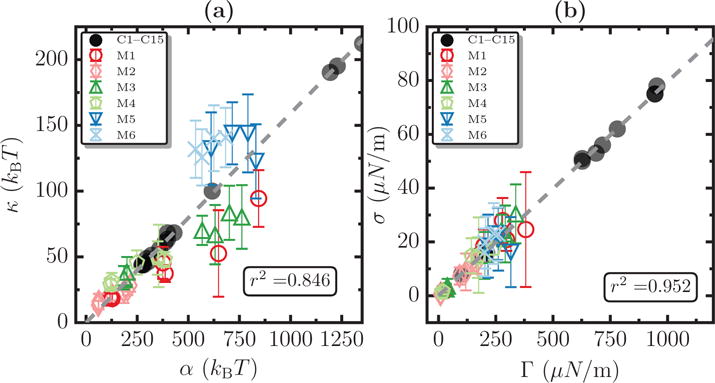
Validity of the scaling relations for κ and σ for data from simulations (M1–M6, shown as open symbols) and experiments (C1–C15, shown as filled symbols). Panel (a) shows the relation κ/α = 1/2π and panel (b) shows the scaling relation σ/Γ = 1/4π, and the corresponding correlation coefficients for systems M1-M6 are found to be r2 = 0.846 and r2 = 0.952, respectively. The dotted lines in panels (a) and (b) correspond to 1/2π and 1/4π respectively.
4.5. Data from tether pulling experiments may be classified according to
Using a suitable choice of scaling parameters, that show a higher sensitivity to variations in the membrane excess area, data from various tether pulling assays may be classified according to the excess area in the membrane. We demonstrate this feature in Figure 11(a) where we show a plot of α vs Γ for the six model systems we have chosen. Each system is represented by a set of four data points which correspond to tethers extracted with ℛbead = 25, 50, 75, and 100 nm. The entire set of data clusters into groups, that are primarily dependent only on the value of in the model membrane. It may be seen that systems M1, M3, and M5 (with ) are clustered in the top right while M2, M4, and M6 (with ) are clustered in the bottom left, and these two clusters are marked as shaded regions. Such a clustering analysis provides a useful route to experimentally classify cells. However, such a grouping analysis does not yield any information about the true value of .
Figure 11.
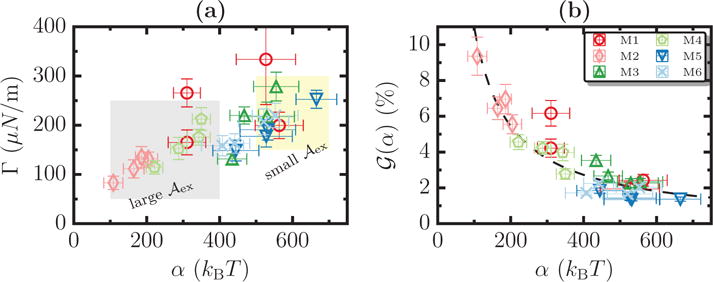
(a) A plot of α vs Γ for M1–M6, for different values of ℛbead, show data clustering in an excess area dependent fashion. (b) , the analytical estimates for the membrane excess area for M1–M6, computed using Equation (2). The dotted line denotes a scaling of the form G/α, with G ∼ 1107.
In order to obtain this information, using Equation (2), we recognize that shows a scaling of the form G/α (dotted line in Figure 11(b)). The data from our calculations are consistent with this scaling as depicted in Figure 11(b). The data shown here despite displaying the correct scaling behavior highlight the shortcomings of existing approaches to estimate membrane excess area using Equation (2). By comparing the values of for systems M1-M6 (shown in Figure 9(a)) with the values of , it may be noted that the method based on Equation (2) consistently underpredicts the excess area for most systems (except for system M1) by nearly a factor of 5–10. This demonstration clearly supports our view as to why new analysis techniques are required to mechanotype cell membranes at the cellular scale. Given the potential for clustering of our data in Figure 11(a) on the basis of , and the scaling shown in in Figure 11(b), we define a dimensionless variable .
A plot of η as a function of α for systems M1–M6, for four different values of ℛbead, are shown in Figure 12(a). Intriguingly, the data collapse into a linear scaling behavior when η is plotted against α (see Figure 12(a)) where the slope of the scaling line depends only on . For a given value of α, the scaling of η is represented as:
| (4) |
Figure 12.
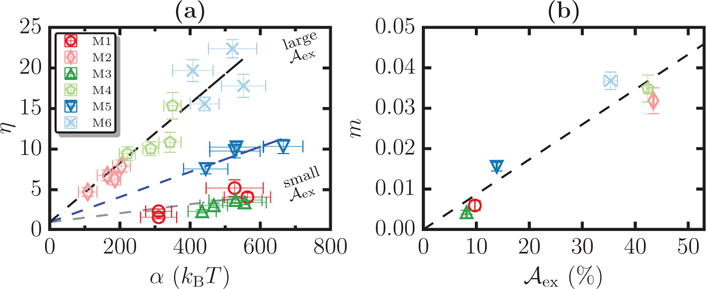
(a) Scaling plot of η vs α for systems M1–M6 for four different values of ℛbead. The dotted lines, show representative scaling relations of the form η = mα + 1, for small, intermediate, and large regimes. (b) A plot of the slope m as a function of and the dotted lines denote the best linear fit to the data. Fitting we find the value of K = 0.00085.
The intercept is taken to be 1 because in the small slope limit where the estimation parameter . We estimate the slope for each system by fitting the corresponding data to a linear function. The three representative dotted lines in Figure 12(a), corresponding to the small, intermediate, and large excess area regimes, show the clustering of data that only depends on the value of in the membrane. The values of m for the six systems M1–M6 as a function of their excess area are shown in Figure 12(b). In general, the dependence of is unknown. As a first approximation, we find to be a linear function of and hence . K being the slope of the best fit linear function, shown as a dotted line in Figure 12(b) and from our calculations we estimate its value to be 0:00085.
The presence of an excess area dependent scaling described by the slope in Figure 12(b) allows one to devise strategies to estimate the range of in cells directly from tether pulling experiments. One possible approach is to use self consistently solve for using the relationship:
| (5) |
Here, the variables α = ℱtℛt/kBT and are directly computed from the tether force and radius measured in tether pulling experiments. The value of K may in turn be obtained from simulations of model systems, that correctly accounts for the size of the cytoskeletal mesh in the target cell. The excess membrane area may then be estimated by self consistently solving Equation (5).
Given the errorbars in a typical experiment, solving Equation (5) for estimating from one single measurement of ℱt and ℛt will not result in a robust prediction. Instead, we propose to do multiple experiments by varying ℛbead. For a set of N measurements, let ℱt,i and ℛt,i denote the tether force and tether radius in the ith measurement, which in turn can be used to compute αi and . Similarly, for a chosen value of we can compute the estimation parameter for the i th measurement as . The best estimate for the excess area is obtained in an iterative manner by minimizing the objective function . This minimization procedure ensures that the best estimate of satisfies the following constraints: (i) the value of ηi follows a linear scaling, with slope a m, as in Equation (5) and (ii) the slope m has a linear dependence on , as shown in Figure 12(b).
5. Discussion
We have presented a computational approach based on umbrella sampling and the weighted histogram analysis technique to compute the free energy landscape and the force-extension relationship for the pulling of membrane tethers from membrane patches of different excess membrane areas, . The tether forces measured in our simulations agree very well with in vitro tether pulling experiments on ruptured GUVs on substrate and on HeLa cells. Unlike existing models, we are able to account for both mechanical work as well as entropic work in tether extraction by performing finite temperature calculations, delineation of the Helmholtz free energy, and performing the analysis in an ensemble with non-zero . In the tether formation regime, based on the computed values of the force required for tether extraction and the tether radius, we established scaling relationships involving ℱt, ℛt, and . We demonstrated the relevance of the calculations by showing the scaling of κ with α and σ with Γ from the model and those obtained from 15 different cell experiments collapse on to a single curve. These scaling curves can be used to construct new schemes for estimating the excess membrane area, which alleviate the limitations of previous methods by being valid for large curvatures, and by taking into account the thermal membrane undulations in the high curvature limit. We have shown that our results successfully recapitulate the results of the previous model in the small-curvature limit. However, in the large-curvature limit, when the domain of applicability of the previous model is limited, we predict the values of the excess membrane areas that are substantially larger than the estimates from the small-curvature model. In light of the discussion above, there is a profound biomedical ramification of the excess membrane area distribution as revealed by our analyses of the tether pulling experiments using the fully non-linear model of the membrane patch subject to finite temperature undulations.
Our model while directly relevant to tether extraction in well behaved in vitro setups, such as GUVs or supported bilayers, does not include the full complexity required to recapitulate the cellular experiments. The complexities arise due to: (i) the dynamic nature of the cytoskeletal reorganization, (ii) changes in due to cellular trafficking mechanisms; the latter poses an important constraint regarding the ensemble. While in in vitro experiments or in our model, we have the ability to either select/design a constant or a constant σ ensemble, it is not obvious what the correct cellular condition would be. For example, at early timescales (i.e. too short for changes in lc) the cell membrane patch may be under a state of tension but at later times both σ and can change due to signaling and trafficking. Notwithstanding these considerations, our model can still be applicable under certain cellular conditions, namely (i) the timescale of the tether extraction is faster than that for cytoskeletal reorganization and trafficking (∼ 10-100 s [57]); (ii) the dimensions of the extracted tethers are smaller than lc. When these conditions are met, one can treat the tether extraction as a quasi-equilibrium process where the cytoskeleton merely serves as a pinning boundary condition for the membrane. This is further justified because the membrane tension equilibrates at a much faster time scale of τtension = ηsσ ~1-100μs, (where ηs is the surface dilational viscosity of the bilayer ≈ 0.35 Ns/m [58]). Under these assumptions, ℒpatch can serve as an approximate surrogate to include cytoskeletal pinning effects. These considerations and caveats must be taken into consideration in developing experimental methods for determining in cells based on the model we have described here.
From a broader perspective, the geometric characterization of cell membrane excess area, the main topic of discussion in this article, is important in circumstances where the cell membrane plays a dominant role such as in the viral invasion of host cells in virology, formation of the immunological synapse in adaptive immunity, or targeted delivery of nanocarriers in pharmacology. It is also expected to be crucial in circumstances where the underlying heterogeneity is intrinsic such as in a tumor microenvironment as it influences cell fate through outside-in mechanisms relayed via membrane mechanotransduction to intracellular signaling.
Supplementary Material
Acknowledgments
This work was supported in part by Grants NIH/U01EB016027 (R.R and D.M.E), NIH/1U54CA193417 (R.R and T.B), and NIH/R01GM097552 (T.B). T.P and S.P acknowledge support from the Wellcome Trust-DBT India alliance. Computational resources were provided in part by the Grant MCB060006 from XSEDE and NSF/DMR-1120901.
Footnotes
Author contributions statement
N.R, R.R and K.K.S designed and performed the simulations. A.R, T.P and S.P designed and performed the experiments. All authors were involved in data analysis and interpretation and in writing of the manuscript.
Competing financial interests
The authors declare that they have no competing financial interests.
References
- 1.Suresh S. Acta Biomater. 2007;3:413–438. doi: 10.1016/j.actbio.2007.04.002. [DOI] [PMC free article] [PubMed] [Google Scholar]
- 2.Physical Sciences - Oncology Centers Network. Agus DB, Alexander JF, Arap W, Ashili S, Aslan JE, Austin RH, Backman V, Bethel KJ, Bonneau R, Chen WC, Chen-Tanyolac C, Choi NC, Curley SA, Dallas M, Damania D, Davies PCW, Decuzzi P, Dickinson L, Estevez-Salmeron L, Estrella V, Ferrari M, Fischbach C, Foo J, Fraley SI, Frantz C, Fuhrmann A, Gascard P, Gatenby RA, Geng Y, Gerecht S, Gillies RJ, Godin B, Grady WM, Greenfield A, Hemphill C, Hempstead BL, Hielscher A, Hillis WD, Holland EC, Ibrahim-Hashim A, Jacks T, Johnson RH, Joo A, Katz JE, Kelbauskas L, Kesselman C, King MR, Konstantopoulos K, Kraning-Rush CM, Kuhn P, Kung K, Kwee B, Lakins JN, Lambert G, Liao D, Licht JD, Liphardt JT, Liu L, Lloyd MC, Lyubimova A, Mallick P, Marko J, McCarty OJT, Meldrum DR, Michor F, Mumenthaler SM, Nandakumar V, O’Halloran TV, Oh S, Pasqualini R, Paszek MJ, Philips KG, Poultney CS, Rana K, Reinhart-King CA, Ros R, Semenza GL, Senechal P, Shuler ML, Srinivasan S, Staunton JR, Stypula Y, Subramanian H, Tlsty TD, Tormoen GW, Tseng Y, van Oudenaarden A, Verbridge SS, Wan JC, Weaver VM, Widom J, Will C, Wirtz D, Wojtkowiak J, Wu PH. Sci Rep. 2013;3:1449. doi: 10.1038/srep01449. [DOI] [PMC free article] [PubMed] [Google Scholar]
- 3.Steward RL, Rosner SR, Zhou EH, Fredberg JJ. Swiss Med Wkly. 2013;143:w13766. doi: 10.4414/smw.2013.13766. [DOI] [PMC free article] [PubMed] [Google Scholar]
- 4.Lee GYH, Lim CT. Trends Biotechnol. 2007;25:111–118. doi: 10.1016/j.tibtech.2007.01.005. [DOI] [PubMed] [Google Scholar]
- 5.Van Vliet KJ, Bao G, Suresh S. Acta Materialia. 2003;51:5881–5905. [Google Scholar]
- 6.Sheetz MP, Sable JE, Döbereiner HG. Annu Rev Biophys Biomol Struct. 2006;35:417–434. doi: 10.1146/annurev.biophys.35.040405.102017. [DOI] [PubMed] [Google Scholar]
- 7.Acerbi I, Cassereau L, Dean I, Shi Q, Au A, Park C, Chen YY, Liphardt J, Hwang ES, Weaver VM. Integr Biol. 2015;7:1120–1134. doi: 10.1039/c5ib00040h. [DOI] [PMC free article] [PubMed] [Google Scholar]
- 8.Diz-Muñoz A, Fletcher DA, Weiner OD. Trends in Cell Biology. 2013;23:47–53. doi: 10.1016/j.tcb.2012.09.006. [DOI] [PMC free article] [PubMed] [Google Scholar]
- 9.Mih JD, Marinkovic A, Liu F, Sharif AS, Tschumperlin DJ. Journal of Cell Science. 2012;125:5974–5983. doi: 10.1242/jcs.108886. [DOI] [PMC free article] [PubMed] [Google Scholar]
- 10.Paszek MJ, Zahir N, Johnson KR, Lakins JN, Rozenberg GI, Gefen A, Reinhart-King CA, Margulies SS, Dembo M, Boettiger D, Hammer DA, Weaver VM. Cancer Cell. 2005;8:241–254. doi: 10.1016/j.ccr.2005.08.010. [DOI] [PubMed] [Google Scholar]
- 11.Samuel MS, Lopez JI, McGhee EJ, Croft DR, Strachan D, Timpson P, Munro J, Schröder E, Zhou J, Brunton VG, Barker N, Clevers H, Sansom OJ, Anderson KI, Weaver VM, Olson MF. Cancer Cell. 2011;19:776–791. doi: 10.1016/j.ccr.2011.05.008. [DOI] [PMC free article] [PubMed] [Google Scholar]
- 12.Paszek MJ, DuFort CC, Rossier O, Bainer R, Mouw JK, Godula K, Hudak JE, Lakins JN, Wijekoon AC, Cassereau L, Rubashkin MG, Magbanua MJ, Thorn KS, Davidson MW, Rugo HS, Park JW, Hammer DA, Giannone G, Bertozzi CR, Weaver VM. Nature. 2014;511:319–325. doi: 10.1038/nature13535. [DOI] [PMC free article] [PubMed] [Google Scholar]
- 13.Zuo X, Zhang J, Zhang Y, Hsu SC, Zhou D, Guo W. Nature Cell Biology. 2006;8:1383–1388. doi: 10.1038/ncb1505. [DOI] [PubMed] [Google Scholar]
- 14.Zhao Y, Liu J, Yang C, Capraro BR, Baumgart T, Bradley RP, Ramakrishnan N, Xu X, Radhakrishnan R, Svitkina T, Guo W. Developmental Cell. 2013;26:266–278. doi: 10.1016/j.devcel.2013.07.007. [DOI] [PMC free article] [PubMed] [Google Scholar]
- 15.Ritchie K, Iino R, Fujiwara T, Murase K, Kusumi A. Mol Membr Biol. 2003;20:13–18. doi: 10.1080/0968768021000055698. [DOI] [PubMed] [Google Scholar]
- 16.Morone N, Fujiwara T, Murase K, Kasai RS, Ike H, Yuasa S, Usukura J, Kusumi A. The Journal of Cell Biology. 2006;174:851–862. doi: 10.1083/jcb.200606007. [DOI] [PMC free article] [PubMed] [Google Scholar]
- 17.Sens P, Plastino J. J Phys: Condens Matter. 2015;27 doi: 10.1088/0953-8984/27/27/273103. [DOI] [PubMed] [Google Scholar]
- 18.McMahon HT, Gallop JL. Nature Cell Biology. 2005;438:590–596. doi: 10.1038/nature04396. [DOI] [PubMed] [Google Scholar]
- 19.Zimmerberg J, Kozlov MM. Nat Rev Mol Cell Biol. 2006;7:9–19. doi: 10.1038/nrm1784. [DOI] [PubMed] [Google Scholar]
- 20.Goh LK, Sorkin A. Cold Spring Harbor Perspectives in Biology. 2013;5:a017459–a017459. doi: 10.1101/cshperspect.a017459. [DOI] [PMC free article] [PubMed] [Google Scholar]
- 21.Grant BD, Donaldson JG. Nat Rev Mol Cell Biol. 2009;10:597–608. doi: 10.1038/nrm2755. [DOI] [PMC free article] [PubMed] [Google Scholar]
- 22.Bryant DM, Mostov KE. Nat Rev Mol Cell Biol. 2008;9:887–901. doi: 10.1038/nrm2523. [DOI] [PMC free article] [PubMed] [Google Scholar]
- 23.Orlando K, Guo W. Cold Spring Harbor Perspectives in Biology. 2009;1:a001321. doi: 10.1101/cshperspect.a001321. [DOI] [PMC free article] [PubMed] [Google Scholar]
- 24.Luo T, Mohan K, Iglesias PA, Robinson DN. Nature Materials. 2013;12:1064–1071. doi: 10.1038/nmat3772. [DOI] [PMC free article] [PubMed] [Google Scholar]
- 25.Sheetz MP. Nat Rev Mol Cell Biol. 2001;2:392–396. doi: 10.1038/35073095. [DOI] [PubMed] [Google Scholar]
- 26.Miaczynska M. Cold Spring Harbor Perspectives in Biology. 2013;5:a009035. doi: 10.1101/cshperspect.a009035. [DOI] [PMC free article] [PubMed] [Google Scholar]
- 27.Schmid-Schönbein GW, Shih YY, Chien S. Blood. 1980;56:866–875. [PubMed] [Google Scholar]
- 28.Bo L, Waugh RE. Biophys J. 1989;55:509–517. doi: 10.1016/S0006-3495(89)82844-9. [DOI] [PMC free article] [PubMed] [Google Scholar]
- 29.Hochmuth FM, Shao JY, Dai J, Sheetz MP. Biophys J. 1996;70:358–369. doi: 10.1016/S0006-3495(96)79577-2. [DOI] [PMC free article] [PubMed] [Google Scholar]
- 30.Jiang YQ, Guo HL, Liu CX, Li ZL, Cheng BY, Zhang DZ, Jia ST. Chinese Physics Letters. 2004;21:1659–1662. [Google Scholar]
- 31.Derényi I, Jülicher F, Prost J. Phys Rev Lett. 2002;88:238101. doi: 10.1103/PhysRevLett.88.238101. [DOI] [PubMed] [Google Scholar]
- 32.Powers T, Huber G, Goldstein R. Phys Rev E. 2002;65:041901. doi: 10.1103/PhysRevE.65.041901. [DOI] [PubMed] [Google Scholar]
- 33.Schumacher KR, Popel AS, Anvari B, Brownell WE, Spector AA. Phys Rev E. 2009;80:041905. doi: 10.1103/PhysRevE.80.041905. [DOI] [PMC free article] [PubMed] [Google Scholar]
- 34.Brownell WE, Qian F, Anvari B. Biophys J. 2010;99:845–852. doi: 10.1016/j.bpj.2010.05.025. [DOI] [PMC free article] [PubMed] [Google Scholar]
- 35.Khatibzadeh N, Gupta S, Farrell B, Brownell WE, Anvari B. Soft Matter. 2012;8:8350. doi: 10.1039/C2SM25263E. [DOI] [PMC free article] [PubMed] [Google Scholar]
- 36.Ramakrishnan N, Tourdot RW, Eckmann DM, Ayyaswamy PS, Muzykantov V, Radhakrishanan R. J Royal Society Open Science. 2016;3:160260. doi: 10.1098/rsos.160260. [DOI] [PMC free article] [PubMed] [Google Scholar]
- 37.Baumgärtner A, Ho J. Phys Rev A. 1990;41:5747–5750. doi: 10.1103/physreva.41.5747. [DOI] [PubMed] [Google Scholar]
- 38.Kroll DM, Gompper G. Science. 1992;255:968–971. doi: 10.1126/science.1546294. [DOI] [PubMed] [Google Scholar]
- 39.Canham P B. J Theor Biol. 1970;26:61–81. doi: 10.1016/s0022-5193(70)80032-7. [DOI] [PubMed] [Google Scholar]
- 40.Helfrich W. Z Naturforsch C. 1973;28:693. doi: 10.1515/znc-1973-11-1209. [DOI] [PubMed] [Google Scholar]
- 41.Ramakrishnan N, Sunil Kumar PB, Ipsen JH. Phys Rev E. 2010;81:041922. doi: 10.1103/PhysRevE.81.041922. [DOI] [PubMed] [Google Scholar]
- 42.Tourdot RW, Ramakrishnan N, Radhakrishnan R. Phys Rev E. 2014;90:022717. doi: 10.1103/PhysRevE.90.022717. [DOI] [PMC free article] [PubMed] [Google Scholar]
- 43.Shiba H, Noguchi H, Fournier JB. Soft Matter. 2016;12:2373–2380. doi: 10.1039/c5sm01900a. [DOI] [PubMed] [Google Scholar]
- 44.Metropolis N, Rosenbluth AW, Rosenbluth MN, Teller AH, Teller E. J Chem Phys. 1953;21:1087–1092. [Google Scholar]
- 45.Helfrich W, Servuss RM. Il Nuovo Cimento D. 1984;3:137–151. [Google Scholar]
- 46.Waheed Q, Edholm O. Biophys J. 2009;97:2754–2760. doi: 10.1016/j.bpj.2009.08.048. [DOI] [PMC free article] [PubMed] [Google Scholar]
- 47.Phillips R, Kondev J, Theriot J. Physical biology of the cell. Garland Science; 2009. [Google Scholar]
- 48.Frenkel D, Smit B. Understanding Molecular Simulation : From Algorithms to Applications. 2nd. Academic Press; 2001. [Google Scholar]
- 49.Kumar S, Rosenberg JM, Bouzida D, Swendsen RH, Kollman PA. J Comput Chem. 1992;13:1011–1021. [Google Scholar]
- 50.Roux B. Computer Physics Communications. 1995;91:275–282. [Google Scholar]
- 51.Weinberger A, Tsai FC, Koenderink GH, Schmidt TF, Itri R, Meier W, Schmatko T, Schröder A, Marques C. Biophys J. 2013;105:154–164. doi: 10.1016/j.bpj.2013.05.024. [DOI] [PMC free article] [PubMed] [Google Scholar]
- 52.Hutter JL, Bechhoefer J. Review of Scientific Instruments. 1993;64:1868–1873. [Google Scholar]
- 53.Singh P, Mahata P, Baumgart T, Das SL. Phys Rev E. 2012;85:051906. doi: 10.1103/PhysRevE.85.051906. [DOI] [PMC free article] [PubMed] [Google Scholar]
- 54.Lipowsky R. Nature. 1991;349:475–481. doi: 10.1038/349475a0. [DOI] [PubMed] [Google Scholar]
- 55.Seifert U. Advances in Physics. 1997;46:13–137. [Google Scholar]
- 56.Pontes B, Ayala Y, Fonseca ACC, Romão LF, Amaral RF, Salgado LT, Lima FR, Farina M, Viana NB, Moura-Neto V, Nussenzveig HM. PLoS ONE. 2013;8:e67708. doi: 10.1371/journal.pone.0067708. [DOI] [PMC free article] [PubMed] [Google Scholar]
- 57.Joanny JF, Prost J. HFSP journal. 2009;3:94–104. doi: 10.2976/1.3054712. [DOI] [PMC free article] [PubMed] [Google Scholar]
- 58.Haluska CK, Riske KA, Marchi-Artzner V, Lehn JM, Lipowsky R, Dimova R. Proc Natl Acad Sci USA. 2006;103:15841–15846. doi: 10.1073/pnas.0602766103. [DOI] [PMC free article] [PubMed] [Google Scholar]
Associated Data
This section collects any data citations, data availability statements, or supplementary materials included in this article.


