Abstract
Fibroblasts can be directly reprogrammed to induced renal tubular epithelial cells (iRECs) using four transcription factors. These engineered cells may be used for disease modeling, cell replacement therapy or drug and toxicity testing. Direct reprogramming induces drastic changes in the transcriptional landscape, protein expression, morphological and functional properties of cells. However, how the metabolome is changed by reprogramming and to what degree it resembles the target cell type remains unknown. Using untargeted gas chromatography-mass spectrometry (GC-MS) and targeted liquid chromatography-MS, we characterized the metabolome of mouse embryonic fibroblasts (MEFs), iRECs, mIMCD-3 cells, and whole kidneys. Metabolic fingerprinting can distinguish each cell type reliably, revealing iRECs are most similar to mIMCD-3 cells and clearly separate from MEFs used for reprogramming. Treatment with the cytotoxic drug cisplatin induced typical changes in the metabolic profile of iRECs commonly occurring in acute renal injury. Interestingly, metabolites in the medium of iRECs, but not of mIMCD-3 cells or fibroblast could distinguish treated and non-treated cells by cluster analysis. In conclusion, direct reprogramming of fibroblasts into renal tubular epithelial cells strongly influences the metabolome of engineered cells, suggesting that metabolic profiling may aid in establishing iRECs as in vitro models for nephrotoxicity testing in the future.
Introduction
The growing incidence of chronic kidney disease leads to various socio-economic implications and represents a major challenge for health care systems worldwide1. There is an unmet demand for new in vitro models of kidney diseases to develop new diagnostic and therapeutic methods and to get a better insight into molecular mechanisms of kidney diseases. In the last decade, enormous progress has been made in generating kidney cells in vitro, including the in vitro expansion of nephron progenitors2,3, directed differentiation of induced pluripotent stem cells (iPSCs)4–7 and direct reprogramming8,9. These approaches have the potential to circumvent some of the disadvantages of primary kidney cells in culture, such as dedifferentiation, limited proliferative capacity and senescence10–12. Moreover, newly generated kidney cells resemble their native counterparts and share more characteristics with primary kidney cells than immortalized kidney-derived cell lines like IMCD-3 or HK-2 cells13. Therefore, these cells can be established as reliable in vitro systems for drug toxicity testing and disease modeling. Furthermore, in vitro generated kidney cells could represent a patient-specific source for future cell replacement therapies5.
Direct reprogramming is an established approach to convert one cell type into another differentiated cell type bypassing the pluripotent state of iPSCs and the risks associated with this approach. Already accomplished for hepatocytes14,15, neurons16, cardiomyocytes17 and others, we recently managed to directly reprogram fibroblasts to induced renal tubular epithelial cells (iRECs) by forced expression of four transcription factors8. By lentiviral transduction of Hnf1β, Hnf4α, Pax8 and Emx2 fibroblasts were converted into iRECs, which exhibit distinct features of differentiated tubular epithelial cells. In contrast to fibroblasts, iRECs express epithelial and tubular surface markers and tubule-specific transporters. Using transcriptional profiling techniques and CellNet18- based characterization, we demonstrated that iRECs bear a substantial similarity to primary kidney tubule cells. On an ultra-structural level, they show tight junctions, a clear apico-basal polarity and a basement-membrane like matrix. Importantly, expression of proximal-tubule specific transporters like OCT2 (SLC22A2, organic cation transporter-2) and the apolipoprotein-receptor megalin (LRP2), detection of microvilli and evidence for endocytotic uptake of albumin indicate that iRECs share specific characteristics of proximal tubule cells.
Although iRECs have been analyzed at a morphological and functional level, little is known about metabolic changes that occur in reprogrammed cells. Several studies have dealt with metabolome profiling of induced pluripotent stem cells19–22. Bioenergetics analysis of iPSCs revealed that transition from a somatic state to pluripotency was accompanied by a switch from mitochondrial oxidative phosphorylation to glycolytic ATP production19. Interestingly, the inhibition of glycolysis prevented iPSC reprogramming. These findings could be confirmed by an independent study using an untargeted metabolomic approach20. Comparing iPSCs to human ESCs (embryonic stem cells) and somatic cells (fibroblasts) demonstrated that the metabolic signature of iPSCs resembles that of hESCs23. This demonstrates that cellular reprogramming is accompanied by metabolic reprogramming. Recently, the analysis of fully and partially reprogrammed human iPSCs uncovered that the metabolic profile of iPSCs reflected their grade of immaturity22. These studies demonstrate that major changes in cell metabolism are not only characteristic of reprogramming, but also play a crucial role in the reprogramming process itself. To our knowledge, no studies have analyzed metabolic features of directly reprogrammed or iPSC-derived kidney cells.
One important application of directly reprogrammed cells could be their use in drug monitoring, toxicity testing of novel compounds and prediction of drug toxicity on a personalized, patient-specific level. We previously demonstrated that iRECs are susceptible to nephrotoxic substances like gentamicin and tacrolimus8, showing elevated rates of cell death compared to MEFs and upregulation of Kidney injury molecule 1 (KIM1). Notably, there was also an iREC- specific cytotoxic response to cisplatin (cis-diamminedichloroplatinum II), which could not be detected in MEFs.
Cisplatin is one of the most widely applied chemotherapeutic drugs for the treatment of malignancies like carcinomas and germline tumors. However, like many chemotherapeutic drugs, cisplatin has several relevant side effects, including ototoxicity, myelosuppression, peripheral neuropathy and anaphylaxis24. Due to the accumulation in renal tissue, the kidneys are especially susceptible to cisplatin, and nephrotoxicity represents a major, dose-limiting side effect25,26. Cisplatin-mediated toxic damage often leads to acute kidney injury (AKI), induced by proximal tubular injury, oxidative stress, vascular injury and inflammation24. The S3 segment of the renal proximal tubule, which is mainly located in the kidney medulla, is particularly sensitive to nephrotoxic substances27. Uptake of cisplatin is mediated by organic cation transporter-2 (OCT2), on the basolateral side of proximal tubule cells28. OCT2 is also expressed in iRECs8. After uptake, cisplatin is converted into reactive metabolites29. By forming DNA intra- and interstrand cross-links30, it mainly interferes with DNA synthesis and targets rapidly proliferating cells. Following cisplatin- induced DNA damage and DNA damage repair (DDR), multiple molecular pathways are activated, such as p53 signaling31, apoptosis pathways, autophagy32 and TNFα expression33. These processes, including mitochondrial dysfunction and activation of the mitochondrial apoptotic pathway34, have various implications for the transcriptome, proteome and metabolome of affected cells35.
Consequently, several studies aimed at analyzing cisplatin-induced metabolic alterations in cells treated with cisplatin27,35–41. There is a known depletion of amino acids in tubular cells after cisplatin application, mainly caused by elevated levels of aminoaciduria and deteriorated reabsorption of amino acids27,36,37. Notably, branched-chain amino acids like leucine, isoleucine and valine are elevated in urine and decreased in serum, and could be used as biomarkers to assess individual predisposition for nephrotoxicity as they correlate with common markers for renal function after cisplatin exposure39. Moreover, cisplatin impacts lipid metabolism and leads to an accumulation of fatty acids in kidney tissue, due to reduced fatty acid oxidation35,37,42. Furthermore, diacylglycerols, triacylglycerols, ceramides and in general neutral lipids accumulate upon cisplatin application27,43. In addition to alterations in lipid metabolism, cisplatin has also been shown to reduce enzymes involved in glycolysis44. Thus, glucose accumulates by cisplatin application and metabolites involved in glycolysis decrease45.
In this study, we analyzed iRECs, mIMCD-3 cells, MEFs and whole kidneys with an untargeted metabolomic approach. Analyzing the endo- and exometabolome by gas chromatography-mass spectrometry (GC-MS), each cell type could be reliably distinguished. iRECs cluster with mIMCD-3 cells but clearly separate from MEFs, indicating that the metabolic profile of iRECs is similar to the profile of mIMCD-3 cells. Treatment with the chemotherapeutic drug cisplatin affected the metabolome of iRECs and mIMCD-3 cells, whereas no changes could be elicited in MEFs. In iRECs and mIMCD-3 cells cisplatin administration led to a decrease of several clusters of metabolites, including amino acids, metabolites involved in glycolysis and the pentose monophosphate pathway, and TCA cycle intermediates. Interestingly, we could detect several well described changes after cisplatin exposure in iRECs, which could not be confirmed in mIMCD-3 cells. In particular, there was an increase of medium- and large-chain fatty acids in the cell and an increase of amino acids in the exometabolome.
Material and Methods
Animals
For whole kidney metabolomic analysis kidneys of three adult C57BL/6 N mice were used. After excision with a scalpel blade, kidneys were weighed and directly prepared for further metabolomic analysis. Mice were housed in a SPF facility with free access to chow and water and a 12 h day/night cycle. All animal experiments were conducted according to the National Institutes of Health Guide for the Care and Use of Laboratory Animals, as well as the German law for the welfare of animals, and were approved by the local authorities (Regierungspräsidium Freiburg). MEFs were generated as previously described8.
Cell culture
iRECs were generated by direct reprogramming of mouse embryonic fibroblasts (MEFs) as described previously8. In short, KspCre reporter MEFs were transduced with four lentivirus, each containing one of the four transcription factors Hnf1b, Hnf4a, Emx2 and Pax8 cloned into the pWPXLd lentiviral vector (Addgene no. 12258). Virus concentrate was diluted 1:1000 to 1:100 in MEFM containing 8 µg ml−1 Polybrene (sc-134220). Cells were incubated for 12 h on 7 consecutive days. 14 days after the last viral transduction GFP-positive cells were sorted using a BD FACSAriaTM Fusion flow cytometer (Becton Dickinson). Afterwards, the cells were expanded in MEFM (Dulbecco’s modified Eagle’s medium (DMEM), 2 mM L-glutamine, penicillin/streptomycin, 10% fetal bovine serum (FBS)). All cells were cryoconserved in freezing medium (containing 50% MEFM, 40% FBS, 10% DMSO) and stored in liquid nitrogen.
For metabolomic analysis MEFs, iRECs and mIMCD-3 (ATTC) cells were thawed and counted. 2· 106 cells were seeded per 10 cm culture dish and expanded until harvested. All three cell lines were grown in MEFM containing DMEM High Glucose (4,5 g L−1). Medium was changed on a daily basis; the medium for metabolomic analysis was incubated on cells for 24 h before harvesting. For cisplatin exposure, all three cell lines were incubated in MEFM containing 6 µL mL−1 cisplatin for 24 h (Cisplatin stock solution 0,1 mg mL−1, Apotheke des Universitätsklinikums Freiburg).
Metabolite extraction
Cells were washed twice on ice with 5 mL 0.9% NaCl. Metabolism was quenched by adding 1.5 mL ice-cold extraction medium, i.e. methanol/water (9/1 v/v) containing 1 µg mL−1 ribitol and phenyl-beta-D-glucopyranoside as internal standards. Cells were harvested by scratching them off with cell scrapers and transferred into 2 mL screw-cup vials prefilled with 300 mg glass beads and immediately frozen in liquid nitrogen. Cells were lyzed by a Precellys 24 tissue homogenizer by applying three cycles of 15 s maximal intensity and 10 s break at −20 °C. After centrifugation (21,000 g, 4 °C, 10 min), 550 µL of the supernatant were transferred in a new 2 mL Eppendorf tube and dried overnight in an Eppendorf Concentrator plus vacuum rotator. Metabolite pellets were stored under nitrogen atmosphere until derivatization.
Kidneys were weighed and washed with 0.9% NaCl. The whole kidneys were transferred into screw-cup vials prefilled with 300 mg glass beads and quenched with extraction medium. The volume was adjusted to tissue weight to yield equal concentrations (see supplementary Table S1). Kidneys were lyzed by a Precellys 24 tissue homogenizer by applying three cycles of 30 s maximal intensity and 30 s break at −20 °C twice, with five minutes between the two runs. Lysates were centrifuged (21,000 g, 4 °C, 10 min) and 100 µL were dried in an Eppendorf Concentrator plus vacuum rotator.
Medium was centrifuged (5 min, 20,000 g, 4 °C) to remove detached or dead cells. 100 µL medium were added to 900 µL ice-cold acetonitrile/methanol (3/1 v/v) containing 1 µg mL−1 ribitol and phenyl-beta-D-glucopyranoside as internal standards. After 10 s of vortexing, the medium was centrifuged (1 h, 20,000 g, 4 °C) and 100 µL of the supernatant were transferred to a new 2 ml Eppendorf tube and dried for three hours.
Derivatization
Metabolite pellets gained from cells, tissue or medium were derivatized by methoxymethylation of keto- and aldehyde-groups as well as trimethylsilylation of amines, hydroxyl- and carboxylic groups. Therefor, 20 µL methoxyamine hydrochloride (20 mg mL−1 in pyridine) were added to the metabolite pellet and shaken for 90 min at 28 °C with 1200 rpm. Afterwards, 50 µL N-methyl-N-(trimethylsilyl)-trifluoroacetamide were added and incubated for 30 min at 37 °C with 1200 rpm.
GC/MS-Analysis
1 μL of the derivatized sample was splitlessly injected by a Gerstel MPS2 XL autosampler into an Agilent 7890 A/5975 C system in randomized order (sample order is shown in supplementary Table S2). Chromatographic separation was performed using an HP5-MS column (5%-diphenyl-95%-dimethylpolysiloxane, 60 m x 0.25 mm × 0.25 μm). The gradient was 80 °C hold for 3 min, to 320 °C with 5 °C/min and hold for 14 min. The carrier gas flow rate (He) was set to 1 mL min−1 and the septum purge flow was 3 mL min−1. Spectra were acquired in full scan mode with a scan rate of 1.99 s−1 from 50 m/z to 800 m/z. Equilibration time and post run time was 1 min each. The inlet temperature was 230 °C, the MS source temperature 230 °C and the quadrupole analyzer temperature 150 °C.
LC/MS-Analysis
Cells or medium pellets were resuspended in 100 µL resuspension buffer (10 mM NH4CH3CO2 pH 9, acetonitrile/water 1/1). 5 µL were injected onto a BEH Amide 150 × 2.1 mm column. The column temperature was set to 40 °C. Two targeted methods were applied: one targeting amino acids, the other one targeting intermediates of glycolysis and the TCA-cycle. Buffer A consisted of 10 mM NH4CH3CO2 pH 9 acetonitrile/water 20/80 and buffer B of 10 mM NH4CH3CO2 pH 9 acetonitrile/water 95/5. The chromatographic program for amino acid separation was 99.9% B for 0.5 min, to 80% B until 0.6 min, to 25% B until 5 min, hold until 8 min, to 99.9% B until 8.5 min and hold until 12 min. Separating intermediates of glycolysis and the TCA-cycle was achieved by the following program: 99.9% B hold for 1 min, to 30% B until 5 min, to 25% B until 5.5 min hold until 8.5 min, to 99.9% B until 9 min and hold until 14 min. Each flow rate was set to 400 µL min−1. Multiple-Reaction-Monitoring (MRM) was optimized for each compound with analytical standards using Agilent’s MRM-Optimizer. All transitions are displayed in supplementary Table S3. Instrument parameters (6460 triple quadrupole Agilent Technologies) were set to 350 °C gas temperature, 8 L min−1 gas flow, 30 psi nebulizer pressure, 250 °C sheath gas temperature, 5 L min−1 sheath gas flow, +3 kV/−3.5 kV capillary voltage and +500 V/−300 V nozzle voltage. As internal standards, 13C3-pyruvic acid, d4-succinic acid and 13C4-15N-aspartic acid were used for intermediates of energy metabolism and amino acids, respectively. The results of methodology validation are displayed in supplementary Table S4.
Data analysis
Within the GC/MS sample set, there was one C10-C40 n-alkane standard sample for building system independently Kováts’ retention index (RI)46.
Automated Mass spectral Deconvolution and Identification System (AMDIS)47 was used for retention index calculation, peak identification, deconvolution and integration. A compound matrix was generated by spectconnect online tool48 with compounds found in more than 50% of the replicates and an 80% similarity threshold of mass spectra. We applied these rather loose settings purposely in order not to miss too many cell type specific metabolites essential to establish cellular metabolic identity. Compounds were annotated by matching the obtained spectra with library spectra of Nist1449, FiehnLib50 and golmDB51, where a match factor threshold of 750 and a retention index deviation of less than 5% were applied. Annotated compounds were normalized to phenyl-glucose. Further, all compounds were normalized to the sum of all compounds to take different cell numbers and mass into account52. For cells, blank plates treated equally as plates containing cells were analyzed the same way and their average intensity of each compound was subtracted from each compound in each condition.
For LC/MS analysis, metabolites were identified by Quantitative Analysis software (Agilent) using retention time and specific MRM-transitions as well as their qualifier ratios. Data were normalized to the isotopically labeled standard according to the corresponding pathway. For cells, averaged blank values were subtracted from each metabolite.
For statistical analysis, metaboanalyst 3.053–58, an R based statistic suit for metabolomics, was used. Half of the minimum positive value of each metabolite replaced missing values in GC/MS analysis. In this study, following tests were performed: ANalysis Of VAriance (ANOVA), Benjamini-Hochberg false discovery rate with a q-value cut-off of 0.05, principal component analysis and heat map generation both including range-scaling (mean-centered and divided by the range of each variable), cluster and distance analysis after Pearson and Ward, pathway analysis as well as Very ImPortant feature (VIP)-plot calculation. A VIP-score above 1 was considered as meaningful.
Data availability
The dataset with every replicate for endometabolite and exometabolite analysis of this study is shown in supplementary Table S5.
Results
Endometabolic profiling of transdifferentiated kidney cells revealed similar fingerprints to immortalized kidney cells and primary kidneys
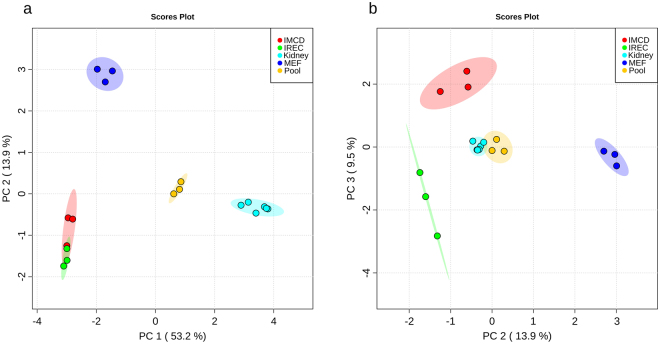
To investigate the metabolic identity of iRECs in comparison to other renal epithelial cells and cells they were derived from (MEFs), cultured iRECs, mIMCD-3 cells, MEFs and whole adult kidney lysates were analyzed by untargeted GC/MS based metabolic profiling. Principle component analysis (PCA) revealed that principle component (PC) 1 discriminated between primary renal tissue (positive PC1) and cell culture (negative PC1) with 53.2% of the observed differences (Fig. 1a.) PC 2 accounted for 13.9% of the alterations and distinguished fibroblasts (positive PC2) from kidney cells (negative PC2). Applying two-dimensional PCA, there was no global difference between mIMCD-3 cells and iRECs. Hence, pooled samples serving as quality control were centered between the four groups and had low intra-group variance. In PC3, iRECs and mIMCD-3 cells were separated with 9.5% of all differences occurred (Fig. 1b).
Figure 1.
iRECs are similar to other renal epithelial cells and differ significantly from MEFs. (a) PCA of endometabolite profiling with PC1 against PC2. (b) PCA of endometabolite profiling with PC2 against PC3. blue: MEFs, red: mIMCD-3 cells, green: iRECs, orange: pooled quality control sample, each n = 3; turquoise: whole kidneys, n = 6. Replicates are highlighted as individual dots, shaded area shows the 95%-confidence interval.
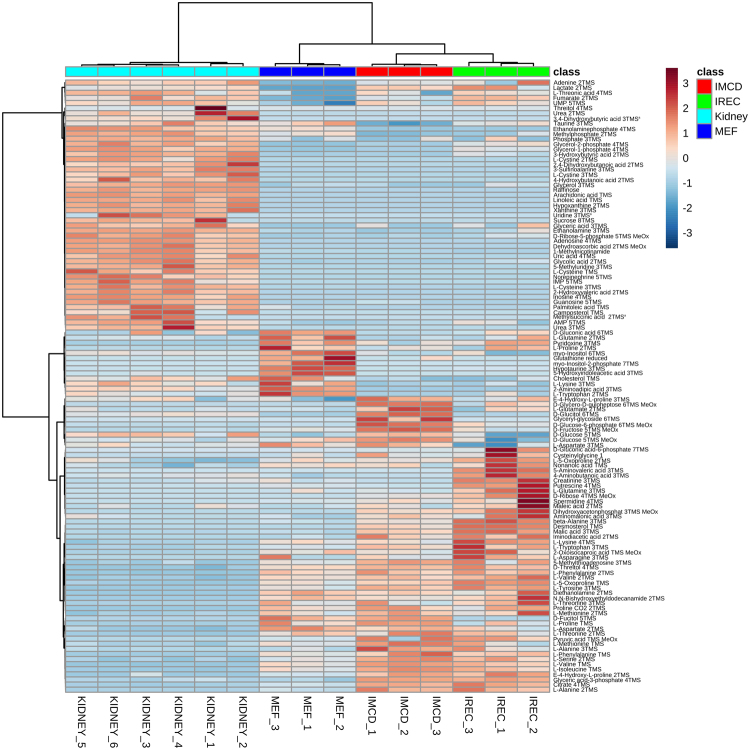
Figure 2 shows a heat map of metabolites with an FDR-corrected q-value < 0.05 (all ANOVA and Tukey’s HSD results are shown in supplementary Table S6). The main differences were observed between kidney lysates and cultured cells as shown by Ward clustering. These alterations are also representing the discrimination of kidney tissue to cell culture samples by PC1 (Fig. 1a). The contributing metabolites were products or intermediates of organismal catabolism like urea, 3-sulfinoalanine or modified nucleosides as well as typical animal fatty acids like arachidonic acid, linoleic acid or palmitoleic acid which are either uniquely present or higher abundant in kidney tissue than in cultured cells. Additionally, the metabolic extract was higher concentrated using kidneys compared to cells obtained from culture and thus more metabolites were detected in kidneys, which were below the detection limit in cell culture. This group mainly consisted of nucleosides and nucleobases.
Figure 2.
Heat map and cluster analysis of endometabolites reveal similarity between renal epithelial cells. Range-scaled Z-scores of annotated features with a q-value < 0.05 according to ANOVA and FDR correction. Differently abundant metabolite clusters after Pearson and Ward reflect the similarity between cultured renal epithelial cells and iRECs in comparison to MEFs. Marked differences are observable between cultured cells and primary tissue. blue: MEFs, red: mIMCD-3 cells, green: iRECs, each n = 3; turquoise: whole kidneys, n = 6. a: not significant after Tukey’s HSC post-hoc analysis.
The heat map also shows the different clusters distinguishing cell types. Here, the differences were not based on cell type specific metabolites but different concentration ratios and included mainly amino acids, sugars and organic acids and their related metabolites. In MEF cells, metabolites involved in sugar and energy metabolism were in general strikingly different to mIMCD-3 cells as well as iRECs. These clusters consist, among others, of glyceric acid-3-phosphate, lactate, citrate and fumarate. This result might reflect the high energy demand of kidney cells. Interestingly, iRECs and mIMCD3 cells are mainly discriminated by increased concentrations of biogenic amines such as beta-alanine, putrescine or spermidine in iRECs as well as increased concentrations of sugars in mIMCD-3 cells.
Exometabolic profiles showed clustering between mIMCD-3 cells and iRECs but not MEFs
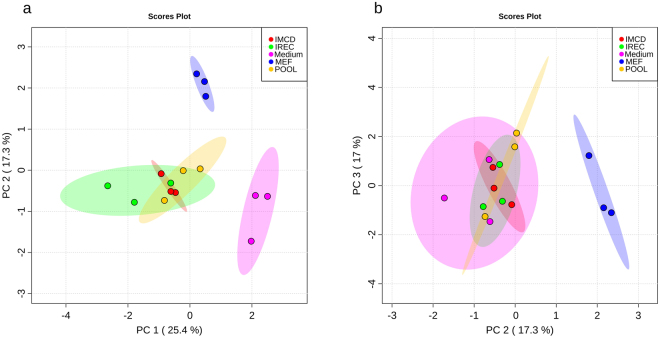
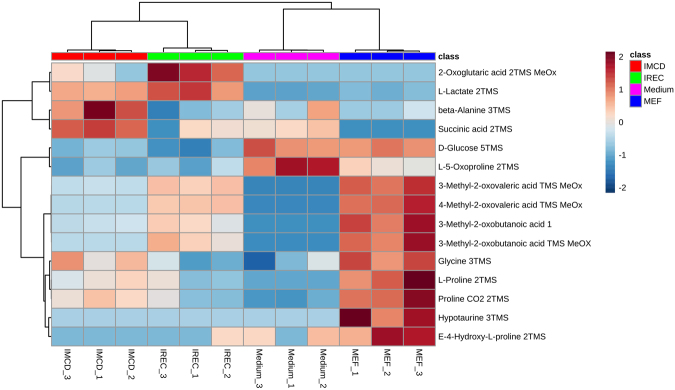
To explore whether mIMCD-3 cells and iRECs also behave similarly in their excreted metabolites, cell culture medium was analyzed. Due to the analysis of cell culture medium, no data is available for the exometabolome of whole kidneys. PCA revealed discrimination between cell- conditioned and unused medium in PC1 as expected (Fig. 3a). PC2 showed a significant difference between cultured kidney cells and fibroblasts. Hence, we could not detect a difference between iRECs and mIMCD-3 cells in any PC dimension (Fig. 3). Figure 4 shows the corresponding heat map with significantly altered metabolites according to FDR-corrected q-values from ANOVA. Unused medium was not considered in the ANOVA to highlight only those metabolites which actually differed between the cell types. Two clusters lead to the difference between MEFs and kidney cells: the first one is composed of glucose and amino acids and their relatives which were higher in MEF medium. The second cluster consists of glycolysis and TCA-cycle intermediates which were decreased in MEF medium. Nevertheless, some differences between mIMCD-3 cells and iRECs regarding the amino acids and their derivatives, succinic acid and 2-oxoglutaric acid were detected.
Figure 3.
Exometabolites from iRECs are similar to those from mIMCD-3 cell medium and not to MEF medium. (a) PCA of exometabolite profiling with PC1 against PC2. (b) PCA of exometabolite profiling with PC2 against PC3. blue: MEFs, red: mIMCD-3 cells, green: iRECs, pink: blank medium, orange: pooled quality control sample, each n = 3. Replicates are represented by individual dots, shaded area shows the 95%-confidence interval.
Figure 4.
Heat map and cluster analysis of exometabolome. Range-scaled Z-scores of annotated features with q-value < 0.05 according to ANOVA and FDR. Differently abundant metabolite clusters after Pearson and Ward reflect the similarity between mIMCD-3 cells and iRECs in comparison to MEFs. blue: MEFs, red: mIMCD-3 cells, green: iRECs, pink: blank medium, each n = 3.
Endometabolome changed upon Cisplatin treatment in iRECs and mIMCD-3 cells but not in MEFs
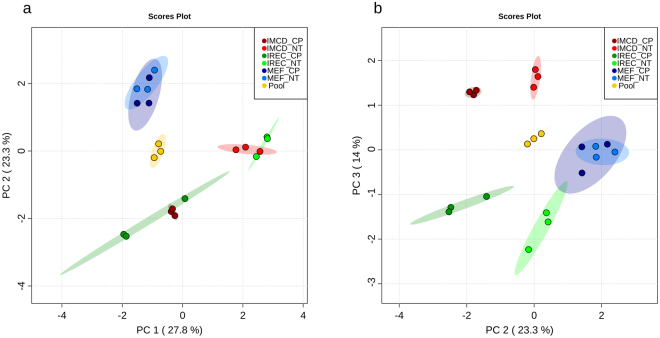
To further test the suitability of iRECs as an in vitro model for renal epithelial cells, we tested the impact of cisplatin on MEFs, mIMCD-3 cells and iRECs. Due to its long use as a chemotherapeutic agent and its dose limiting nephrotoxicity, cisplatin is well studied in in vivo animal models and metabolically well characterized27,35–40. As can be seen in the PCA, cisplatin had no global effect on MEFs, neither in PC1, PC2 nor PC3 (Fig. 5). However, cisplatin induced metabolic alterations in kidney cells which could be observed in PC1 as well as in PC2 (Fig. 5a). PC3 did not discriminate between cisplatin treated and non-treated cells but iRECs and mIMCD-3 cells (Fig. 5b).
Figure 5.
Cisplatin affects the endometabolome exclusively in renal epithelial cells and iRECs. (a) PCA of endometabolite profiling with PC1 against PC2. (b) PCA of endometabolite profiling with PC2 against PC3. light color: untreated, dark color: cisplatin-treated; blue: MEFs, red: mIMCD-3 cells, green: iRECs, orange: pooled quality control sample, each n = 3. Each dot represents a replicate, shaded area shows the 95%-confidence interval.
The heat map shows significantly altered metabolites of the endometabolome (Fig. 6). In MEFs, the two main clusters of either highly abundant or lowly abundant metabolites did not change after cisplatin treatment. In contrast, the main clusters of renal epithelial cells changed in response to cisplatin. After cisplatin treatment, a concomitant decrease in many metabolites was observed including many amino acids as well as glycolysis, pentose monophosphate pathway and TCA-cycle intermediates. One cluster showed an increase of metabolites after cisplatin treatment that was only observed in iRECs. Contributing features were medium-chain and large-chain fatty acids, as well as glucose. At the bottom of the heat map, minor clusters appeared which showed differences between mIMCD-3 cells and iRECs independently of cisplatin, and an increase of metabolites induced by cisplatin specifically in mIMCD-3 cells. To determine which pathways were particularly affected, we performed a pathway analysis comparing the specific impact of cisplatin in the three cell lines. While no significant alteration occurred in MEFs, several pathways were affected in both mIMCD-3 cells and iRECs. This analysis confirmed the results from the heat map as several amino acid pathways, glycolysis, TCA-cycle and some lipid pathways were significantly altered (see supplementary Table S7). As the key alterations changed after cisplatin application could be detected in amino acid and energy metabolism, we performed a targeted LC/MS analysis for amino acids and intermediates of glycolysis and the TCA-cycle. Whereas no significant alteration was observed in MEFs, in both mIMCD-3 cells and iRECs amino acids and energy metabolites were drastically decreased. Glucose accumulation could only be validated in iRECs, although an insignificant trend could also be observed in mIMCD-3 cells (see supplementary Fig. S1 and supplementary Table S6). The clustering confirmed the discrimination between MEFs and kidney cells. Moreover, the impact of cisplatin on the metabolome of renal cells led to a more prominent discrimination than the two renal cell lines did themselves (see supplementary Fig. S1, top). These results are thus consistent with the untargeted GC/MS analysis.
Figure 6.
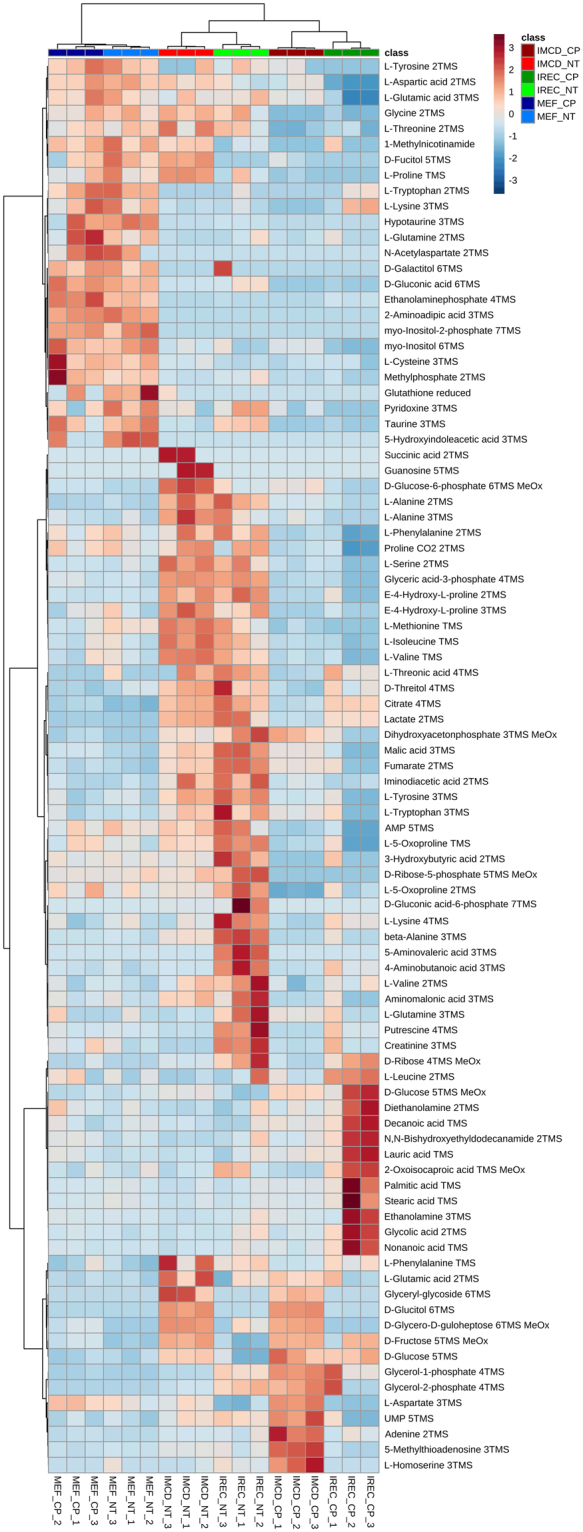
Heat map and cluster analysis of endometabolome discriminates cisplatin treatment only in renal epithelial cells. Range-scaled Z-scores of annotated features with a q-value < 0.05 according to ANOVA and FDR. No effect could be observed in MEFs after cisplatin application, while there was a strong influence on renal epithelial cells. Amino acids and intermediates of glycolysis, TCA-cycle and pentose phosphate pathway were concomitantly down regulated by cisplatin in iRECs and mIMCD-3 cells, whereas fatty acid accumulation was unique to iRECs. light color: untreated, dark color: Cisplatin-treated; blue: MEFs, red: mIMCD-3 cells, green: iRECs, each n = 3
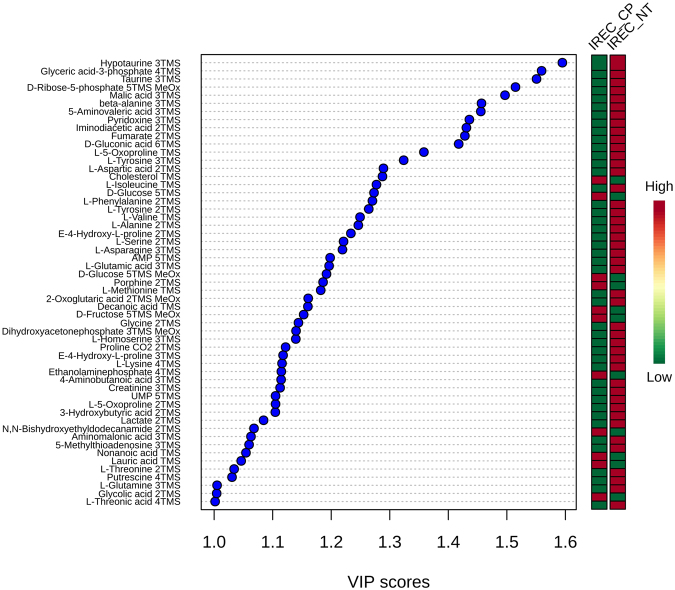
To test which metabolites contributed most to the alteration by cisplatin in iRECs, a VIP plot was calculated (detailed results are shown in supplementary Table S8). Figure 7 shows all compounds with a VIP score above 1. The most important features were intermediates from sugar metabolism as well as hypotaurine, taurine, beta-alanine, 5-aminovaleric acid and pyridoxine. Almost all of these metabolites were down regulated.
Figure 7.
Most important metabolites changed by cisplatin in iRECs. All features with a VIP score > 1 between cisplatin treated and untreated iRECs are displayed. Relative levels are shown for each feature with high abundance (red) and low abundance (green).
Exometabolomics revealed impaired amino acid uptake in iRECs by Cisplatin
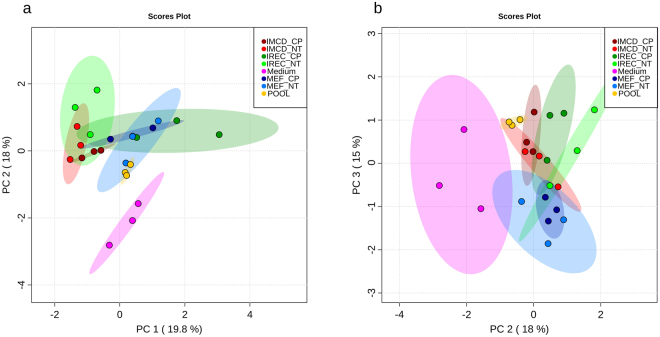
As shown in Fig. 8, global metabolome analysis could not discriminate cisplatin-treated medium from non-treated medium, neither in PC1, PC2 nor PC3.
Figure 8.
Cisplatin does not influence the exometabolome globally. (a) Principal component analysis of exometabolite profiling with PC1 against PC2. (b) PCA of exometabolite profiling with PC2 against PC3. light color: untreated, dark color: cisplatin-treated; blue: MEFs, red: mIMCD-3 cells, green: iRECs, orange: pooled quality control sample, each n = 3. Each dot represents a replicate, shaded area shows the 95%-confidence interval.
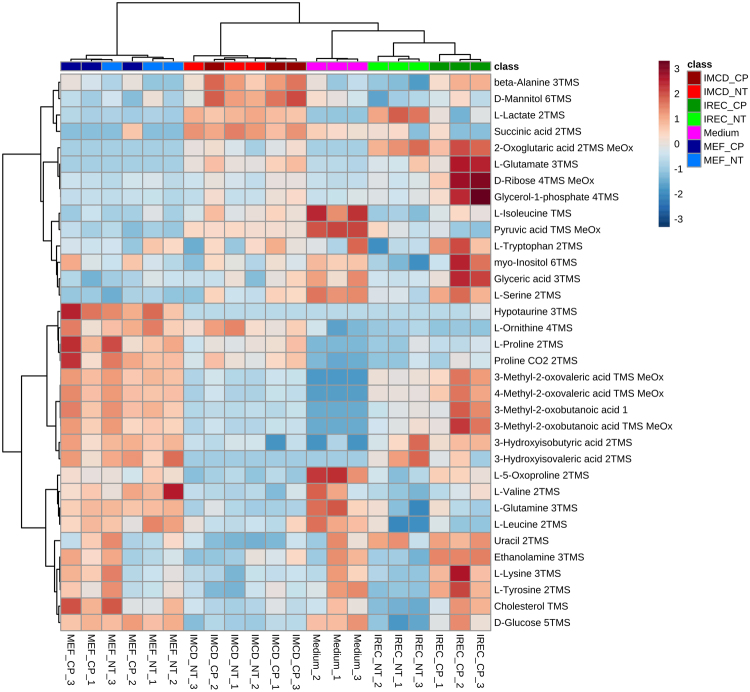
However, restricting the analysis to ANOVA-positive metabolites revealed differences between treated and non-treated medium from iRECs and no discrimination within MEF medium or mIMCD-3 cell medium (Fig. 9). Contributing metabolites were basically amino acids, which were increased after cisplatin-treatment. Comparison to the unused medium indicated that these increases resulted from both elevated excretion and reduced import. Additionally, there were significant alterations in specific metabolites like sugars, lactate and ethanolamine.
Figure 9.
Heat map and cluster analysis of exometabolome after cisplatin-treatment. Range-scaled Z-scores of annotated features with a q-value < 0.05 according to ANOVA and FDR. Medium was excluded for the statistical analysis. No effect could be observed by cisplatin application on MEF and mIMCD-3 medium as there was clustering between both untreated and cisplatin-treated groups. However, clustering differentiated between the medium of treated and non-treated iRECs. Amino acids and their derivatives as well as sugars and lactate were mainly affected. light color: untreated, dark color: cisplatin-treated; blue: MEFs, red: mIMCD-3 cells, green: iRECs, each n = 3.
Consistently, targeted validation of the exometabolome by LC/MS led to less prominent results than the targeted endometabolome analysis. No significant alterations were observed in the medium of MEFs and only serine was significantly upregulated in the medium of mIMCD-3 cells. In iRECs medium, serine and cystine were upregulated while glycolysis intermediates pyruvate and lactate were decreased upon cisplatin treatment (see supplementary Fig. S2).
Discussion
In this study, directly reprogrammed renal epithelial cells were characterized by untargeted metabolomics for the first time. By this approach, we could successfully show that the metabolic profile of iRECs is strikingly similar to that of cultured renal epithelial cells (mIMCD-3 cells). Importantly, cluster analysis could clearly discriminate iRECs from those cells they were derived from (MEFs). The similarity was not only shown by endometabolite profiling but also by analyzing the exometabolome.
To further functionally test the metabolome of iRECs, we applied a well-described nephrotoxic drug, cisplatin, to MEFs, iRECs and mIMCD-3 cells. Global endometabolome analysis revealed significant alterations in the metabolome of mIMCD-3 cells and iRECs upon cisplatin treatment whereas no effects could be observed in MEFs. Strikingly, the alterations were thoroughly in line with published in vivo data, including deprivation of amino acids27,36 and reduced levels of intermediates of glycolysis, pentose phosphate pathway and citric acid cycle44,45. These central findings could be successfully validated by targeted LC/MS analysis of amino acids, glycolysis and TCA-cycle intermediates.
Most interestingly, an accumulation of medium and large chain fatty acids was only observed in iRECs but not in mIMCD-3 cells. These alterations also take place in vivo probably by impaired signaling of peroxisome proliferator-activated receptor-α (PPAR-α)37,59,60, due to direct cisplatin-mediated inhibition of PPAR-α DNA- binding activity61. Consequently, the PPAR-α target gene, mitochondrial medium-chain acyl-CoA dehydrogenase (MCAD), one important enzyme in fatty acid oxidation, was less expressed in cisplatin- treated mice62. Consistently, PPAR-α activators lead to elevated MCAD mRNA levels and enzyme activity62 and to reduced fatty acid accumulation after cisplatin treatment37,60. In kidney tissue and serum of mice treated with cisplatin and the PPAR-α ligand WY, levels of non-esterified fatty acids and triacylglycerols were significantly reduced in contrast to mice treated with cisplatin only. Moreover, treatment with the PPAR-α ligand WY prevented acute renal failure after cisplatin exposure62. These observations suggest that the accumulation of fatty acids we observed in iRECs plays a significant pathophysiological role in cisplatin- mediated nephrotoxicity.
In addition, exometabolome analysis revealed an increase in amino acids in the medium of iRECs but neither in mIMCD-3 cells nor MEFs. This is again consistent with aminoaciduria observed in vivo27,36,37. Targeted LC/MS validation revealed more significant alterations in the medium of iRECs than in the medium of mIMCD-3 cells and MEFs, including amino acids and metabolites of energy metabolism.
Analysis of metabolites most significantly changed upon cisplatin treatment in the endometabolome of iRECs uncovered substances, to which beneficial effects against cisplatin-induced nephrotoxicity have been attributed. These included taurine, pyridoxine and beta-alanine (the latter administered as N-benzoyl-beta-alanine)63–65. In summary, our findings suggest that iRECs faithfully reflect many pathophysiological responses to cisplatin. If metabolomic profiling of iRECs represents a good in vitro model system for nephrotoxicity testing, will need to be confirmed by testing additional nephrotoxic substances.
The possibility to reprogram human fibroblasts to hiRECs8 offers the opportunity to test nephrotoxic agents individually for patients or in a disease specific background. Untargeted metabolomics is not only an excellent technique to test the response of iRECs to new drugs as a risk assessment for potential nephrotoxic side effects, but could also be used to discover agents preventing or attenuating nephrotoxicity of substances in clinical use.
Electronic supplementary material
Supplementary Tables and Figures S1 and S2
Acknowledgements
We thank Amos Spielmann for excellent technical support. This work was supported by the Emmy Noether Programme to S.S.L. (LI1817/2-1) and Projects B07 and B01 of the collaborative research initiative (SFB 1140 - KIDGEM) to S.S.L., G.W. and B.K. by the German Research Foundation (DFG). Furthermore the study was supported by the Else Kroener- Forschungskolleg (EKFK - NAKSYS) to R.P. and the Berta-Ottenstein- Programme to M.M.K.
Author Contributions
B.K., S.S.L., S.L., R.P., M.S., M.M.K. and G.W. designed the study. S.L. and R.P. performed the experiments and data analysis. M.S. aided in data analysis and LC/MS method development. M.M.K. generated the iRECs. All authors read and approved the manuscript. B.K. and S.S.L. were responsible for supervision of the project.
Competing Interests
The authors declare no competing interests.
Footnotes
Simon Lagies and Roman Pichler contributed equally to this work.
Electronic supplementary material
Supplementary information accompanies this paper at 10.1038/s41598-018-22073-7.
Publisher's note: Springer Nature remains neutral with regard to jurisdictional claims in published maps and institutional affiliations.
Contributor Information
Soeren S. Lienkamp, Email: soeren.lienkamp@uniklinik-freiburg.de
Bernd Kammerer, Email: bernd.kammerer@zbsa.uni-freiburg.de.
References
- 1.National Institutes of Health, National Institute of Diabetes and Digestive and Kidney Diseases, Bethesda, MD. United States Renal Data System. 2016 USRDS annual data report: Epidemiology of kidney disease in the United States (2016).
- 2.Brown AC, Muthukrishnan SD, Oxburgh L. A synthetic niche for nephron progenitor cells. Developmental cell. 2015;34:229–241. doi: 10.1016/j.devcel.2015.06.021. [DOI] [PMC free article] [PubMed] [Google Scholar]
- 3.Li Z, et al. 3D Culture Supports Long-Term Expansion of Mouse and Human Nephrogenic Progenitors. Cell stem cell. 2016;19:516–529. doi: 10.1016/j.stem.2016.07.016. [DOI] [PMC free article] [PubMed] [Google Scholar]
- 4.Freedman BS, et al. Modelling kidney disease with CRISPR-mutant kidney organoids derived from human pluripotent epiblast spheroids. Nature communications. 2015;6:8715. doi: 10.1038/ncomms9715. [DOI] [PMC free article] [PubMed] [Google Scholar]
- 5.Morizane R, et al. Nephron organoids derived from human pluripotent stem cells model kidney development and injury. Nature biotechnology. 2015;33:1193–1200. doi: 10.1038/nbt.3392. [DOI] [PMC free article] [PubMed] [Google Scholar]
- 6.Takasato M, et al. Directing human embryonic stem cell differentiation towards a renal lineage generates a self-organizing kidney. Nature cell biology. 2014;16:118–126. doi: 10.1038/ncb2894. [DOI] [PubMed] [Google Scholar]
- 7.Takasato M, et al. Kidney organoids from human iPS cells contain multiple lineages and model human nephrogenesis. Nature. 2015;526:564–568. doi: 10.1038/nature15695. [DOI] [PubMed] [Google Scholar]
- 8.Kaminski MM, et al. Direct reprogramming of fibroblasts into renal tubular epithelial cells by defined transcription factors. Nature cell biology. 2016;18:1269–1280. doi: 10.1038/ncb3437. [DOI] [PubMed] [Google Scholar]
- 9.Hendry CE, et al. Direct transcriptional reprogramming of adult cells to embryonic nephron progenitors. Journal of the American Society of Nephrology: JASN. 2013;24:1424–1434. doi: 10.1681/ASN.2012121143. [DOI] [PMC free article] [PubMed] [Google Scholar]
- 10.Zhuang S, Duan M, Yan Y. Src family kinases regulate renal epithelial dedifferentiation through activation of EGFR/PI3K signaling. Journal of cellular physiology. 2012;227:2138–2144. doi: 10.1002/jcp.22946. [DOI] [PMC free article] [PubMed] [Google Scholar]
- 11.Wieser M, et al. hTERT alone immortalizes epithelial cells of renal proximal tubules without changing their functional characteristics. American journal of physiology. Renal physiology. 2008;295:F1365–75. doi: 10.1152/ajprenal.90405.2008. [DOI] [PubMed] [Google Scholar]
- 12.Berkenkamp B, et al. In vivo and in vitro analysis of age-associated changes and somatic cellular senescence in renal epithelial cells. PLoS ONE. 2014;9:e88071. doi: 10.1371/journal.pone.0088071. [DOI] [PMC free article] [PubMed] [Google Scholar]
- 13.Li Y, et al. Identification of nephrotoxic compounds with embryonic stem-cell-derived human renal proximal tubular-like cells. Molecular pharmaceutics. 2014;11:1982–1990. doi: 10.1021/mp400637s. [DOI] [PubMed] [Google Scholar]
- 14.Huang P, et al. Direct reprogramming of human fibroblasts to functional and expandable hepatocytes. Cell stem cell. 2014;14:370–384. doi: 10.1016/j.stem.2014.01.003. [DOI] [PubMed] [Google Scholar]
- 15.Sekiya S, Suzuki A. Direct conversion of mouse fibroblasts to hepatocyte-like cells by defined factors. Nature. 2011;475:390–393. doi: 10.1038/nature10263. [DOI] [PubMed] [Google Scholar]
- 16.Vierbuchen T, et al. Direct conversion of fibroblasts to functional neurons by defined factors. Nature. 2010;463:1035–1041. doi: 10.1038/nature08797. [DOI] [PMC free article] [PubMed] [Google Scholar]
- 17.Ieda M, et al. Direct reprogramming of fibroblasts into functional cardiomyocytes by defined factors. Cell. 2010;142:375–386. doi: 10.1016/j.cell.2010.07.002. [DOI] [PMC free article] [PubMed] [Google Scholar]
- 18.Cahan P, et al. CellNet: network biology applied to stem cell engineering. Cell. 2014;158:903–915. doi: 10.1016/j.cell.2014.07.020. [DOI] [PMC free article] [PubMed] [Google Scholar]
- 19.Folmes CDL, et al. Somatic oxidative bioenergetics transitions into pluripotency-dependent glycolysis to facilitate nuclear reprogramming. Cell metabolism. 2011;14:264–271. doi: 10.1016/j.cmet.2011.06.011. [DOI] [PMC free article] [PubMed] [Google Scholar]
- 20.Panopoulos AD, et al. The metabolome of induced pluripotent stem cells reveals metabolic changes occurring in somatic cell reprogramming. Cell research. 2012;22:168–177. doi: 10.1038/cr.2011.177. [DOI] [PMC free article] [PubMed] [Google Scholar]
- 21.Zhang J, et al. UCP2 regulates energy metabolism and differentiation potential of human pluripotent stem cells. The EMBO journal. 2011;30:4860–4873. doi: 10.1038/emboj.2011.401. [DOI] [PMC free article] [PubMed] [Google Scholar]
- 22.Park S-J, et al. Metabolome Profiling of Partial and Fully Reprogrammed Induced Pluripotent Stem Cells. Stem cells and development. 2017;26:734–742. doi: 10.1089/scd.2016.0320. [DOI] [PubMed] [Google Scholar]
- 23.Meissen JK, et al. Induced pluripotent stem cells show metabolomic differences to embryonic stem cells in polyunsaturated phosphatidylcholines and primary metabolism. PLoS ONE. 2012;7:e46770. doi: 10.1371/journal.pone.0046770. [DOI] [PMC free article] [PubMed] [Google Scholar]
- 24.Ozkok A, Edelstein CL. Pathophysiology of cisplatin-induced acute kidney injury. BioMed Research International. 2014;2014:967826. doi: 10.1155/2014/967826. [DOI] [PMC free article] [PubMed] [Google Scholar]
- 25.Safirstein R, Miller P, Guttenplan JB. Uptake and metabolism of cisplatin by rat kidney. Kidney international. 1984;25:753–758. doi: 10.1038/ki.1984.86. [DOI] [PubMed] [Google Scholar]
- 26.Miller RP, Tadagavadi RK, Ramesh G, Reeves WB. Mechanisms of Cisplatin nephrotoxicity. Toxins. 2010;2:2490–2518. doi: 10.3390/toxins2112490. [DOI] [PMC free article] [PubMed] [Google Scholar]
- 27.Zhang P, et al. Renal Medulla is More Sensitive to Cisplatin than Cortex Revealed by Untargeted Mass Spectrometry-Based Metabolomics in Rats. Scientific reports. 2017;7:44804. doi: 10.1038/srep44804. [DOI] [PMC free article] [PubMed] [Google Scholar]
- 28.Ciarimboli G, et al. Cisplatin nephrotoxicity is critically mediated via the human organic cation transporter 2. The American journal of pathology. 2005;167:1477–1484. doi: 10.1016/S0002-9440(10)61234-5. [DOI] [PMC free article] [PubMed] [Google Scholar]
- 29.Townsend DM, Deng M, Zhang L, Lapus MG, Hanigan MH. Metabolism of Cisplatin to a nephrotoxin in proximal tubule cells. Journal of the American Society of Nephrology: JASN. 2003;14:1–10. doi: 10.1097/01.ASN.0000042803.28024.92. [DOI] [PMC free article] [PubMed] [Google Scholar]
- 30.Wang D, Lippard SJ. Cellular processing of platinum anticancer drugs. Nature reviews. Drug discovery. 2005;4:307–320. doi: 10.1038/nrd1691. [DOI] [PubMed] [Google Scholar]
- 31.Cummings BS, Schnellmann RG. Cisplatin-induced renal cell apoptosis: caspase 3-dependent and -independent pathways. The Journal of pharmacology and experimental therapeutics. 2002;302:8–17. doi: 10.1124/jpet.302.1.8. [DOI] [PubMed] [Google Scholar]
- 32.Periyasamy-Thandavan S, et al. Autophagy is cytoprotective during cisplatin injury of renal proximal tubular cells. Kidney international. 2008;74:631–640. doi: 10.1038/ki.2008.214. [DOI] [PubMed] [Google Scholar]
- 33.Zhang B, Ramesh G, Norbury CC, Reeves WB. Cisplatin-induced nephrotoxicity is mediated by tumor necrosis factor-alpha produced by renal parenchymal cells. Kidney international. 2007;72:37–44. doi: 10.1038/sj.ki.5002242. [DOI] [PubMed] [Google Scholar]
- 34.Santos NAG, et al. Cisplatin-induced nephrotoxicity is associated with oxidative stress, redox state unbalance, impairment of energetic metabolism and apoptosis in rat kidney mitochondria. Archives of toxicology. 2007;81:495–504. doi: 10.1007/s00204-006-0173-2. [DOI] [PubMed] [Google Scholar]
- 35.Wilmes A, et al. Mechanism of cisplatin proximal tubule toxicity revealed by integrating transcriptomics, proteomics, metabolomics and biokinetics. Toxicology in vitro: an international journal published in association with BIBRA. 2015;30:117–127. doi: 10.1016/j.tiv.2014.10.006. [DOI] [PubMed] [Google Scholar]
- 36.Boudonck KJ, et al. Discovery of metabolomics biomarkers for early detection of nephrotoxicity. Toxicologic pathology. 2009;37:280–292. doi: 10.1177/0192623309332992. [DOI] [PubMed] [Google Scholar]
- 37.Portilla D, et al. Metabolomic study of cisplatin-induced nephrotoxicity. Kidney international. 2006;69:2194–2204. doi: 10.1038/sj.ki.5000433. [DOI] [PubMed] [Google Scholar]
- 38.Zhang P, et al. Discovery of Potential Biomarkers with Dose- and Time-Dependence in Cisplatin-Induced Nephrotoxicity Using Metabolomics Integrated with a Principal Component-Based Area Calculation Strategy. Chemical research in toxicology. 2016;29:776–783. doi: 10.1021/acs.chemrestox.5b00519. [DOI] [PubMed] [Google Scholar]
- 39.Zhang P, et al. Branched-Chain Amino Acids as Predictors for Individual Differences of Cisplatin Nephrotoxicity in Rats: A Pharmacometabonomics Study. Journal of proteome research. 2017;16:1753–1762. doi: 10.1021/acs.jproteome.7b00014. [DOI] [PubMed] [Google Scholar]
- 40.Uehara T, et al. Identification of metabolomic biomarkers for drug-induced acute kidney injury in rats. Journal of applied toxicology: JAT. 2014;34:1087–1095. doi: 10.1002/jat.2933. [DOI] [PubMed] [Google Scholar]
- 41.Kwon HN, et al. Predicting idiopathic toxicity of cisplatin by a pharmacometabonomic approach. Kidney international. 2011;79:529–537. doi: 10.1038/ki.2010.440. [DOI] [PubMed] [Google Scholar]
- 42.Portilla D, Schnackenberg L, Beger RD. Metabolomics as an extension of proteomic analysis: study of acute kidney injury. Seminars in nephrology. 2007;27:609–620. doi: 10.1016/j.semnephrol.2007.09.006. [DOI] [PMC free article] [PubMed] [Google Scholar]
- 43.Li S, et al. Reduced kidney lipoprotein lipase and renal tubule triglyceride accumulation in cisplatin-mediated acute kidney injury. American Journal of Physiology - Renal Physiology. 2012;303:F437–48. doi: 10.1152/ajprenal.00111.2012. [DOI] [PMC free article] [PubMed] [Google Scholar]
- 44.Zhou R, Heiden MGV, Rudin CM. Genotoxic Exposure Is Associated with Alterations in Glucose Uptake and Metabolism. Cancer Res. 2002;62:3515–3520. [PubMed] [Google Scholar]
- 45.Choi, Y.-M. et al. Mechanism of Cisplatin-Induced Cytotoxicity Is Correlated to Impaired Metabolism Due to Mitochondrial ROS Generation. PLoS ONE10 (2015). [DOI] [PMC free article] [PubMed]
- 46.Kováts E. Gas-chromatographische Charakterisierung organischer Verbindungen. Teil 1. Retentionsindices aliphatischer Halogenide, Alkohole, Aldehyde und Ketone. HCA. 1958;41:1915–1932. doi: 10.1002/hlca.19580410703. [DOI] [Google Scholar]
- 47.Stein SE. An Integrated Method for Spectrum Extraction and Compound Identification from Gas Chromatography/Mass Spectrometry. Data. 1999;10:770–781. [Google Scholar]
- 48.Styczynski MP, et al. Systematic identification of conserved metabolites in GC/MS data for metabolomics and biomarker discovery. Analytical chemistry. 2007;79:966–973. doi: 10.1021/ac0614846. [DOI] [PubMed] [Google Scholar]
- 49.Babushok VI, et al. Development of a database of gas chromatographic retention properties of organic compounds. Journal of chromatography. A. 2007;1157:414–421. doi: 10.1016/j.chroma.2007.05.044. [DOI] [PubMed] [Google Scholar]
- 50.Kind T, et al. FiehnLib: mass spectral and retention index libraries for metabolomics based on quadrupole and time-of-flight gas chromatography/mass spectrometry. Analytical chemistry. 2009;81:10038–10048. doi: 10.1021/ac9019522. [DOI] [PMC free article] [PubMed] [Google Scholar]
- 51.Kopka J, et al. GMD@CSB.DB: the Golm Metabolome Database. Bioinformatics (Oxford, England) 2005;21:1635–1638. doi: 10.1093/bioinformatics/bti236. [DOI] [PubMed] [Google Scholar]
- 52.Hutschenreuther A, Kiontke A, Birkenmeier G, Birkemeyer C. Comparison of extraction conditions and normalization approaches for cellular metabolomics of adherent growing cells with GC-MS. Anal. Methods. 2012;4:1953. doi: 10.1039/c2ay25046b. [DOI] [Google Scholar]
- 53.Xia J, Mandal R, Sinelnikov IV, Broadhurst D, Wishart DS. MetaboAnalyst 2.0—a comprehensive server for metabolomic data analysis. Nucleic Acids Res. 2012;40:W127–W133. doi: 10.1093/nar/gks374. [DOI] [PMC free article] [PubMed] [Google Scholar]
- 54.Xia J, Psychogios N, Young N, Wishart DS. MetaboAnalyst: a web server for metabolomic data analysis and interpretation. Nucleic Acids Res. 2009;37:W652–W660. doi: 10.1093/nar/gkp356. [DOI] [PMC free article] [PubMed] [Google Scholar]
- 55.Xia J, Sinelnikov IV, Han B, Wishart DS. MetaboAnalyst 3.0—making metabolomics more meaningful. Nucleic Acids Res. 2015;43:W251–W257. doi: 10.1093/nar/gkv380. [DOI] [PMC free article] [PubMed] [Google Scholar]
- 56.Xia, J. & Wishart, D. S. Metabolomic Data Processing, Analysis, and Interpretation Using MetaboAnalyst, 14.10.1-14.10.48. [DOI] [PubMed]
- 57.Xia J, Wishart DS. Web-based inference of biological patterns, functions and pathways from metabolomic data using MetaboAnalyst. Nature Protocols. 2011;6:743–760. doi: 10.1038/nprot.2011.319. [DOI] [PubMed] [Google Scholar]
- 58.Xia J, Wishart DS. Using MetaboAnalyst 3.0 for Comprehensive Metabolomics Data Analysis. Current protocols in bioinformatics. 2016;55:14.10.1–14.10.91. doi: 10.1002/cpbi.11. [DOI] [PubMed] [Google Scholar]
- 59.Vega RB, Huss JM, Kelly DP. The coactivator PGC-1 cooperates with peroxisome proliferator-activated receptor alpha in transcriptional control of nuclear genes encoding mitochondrial fatty acid oxidation enzymes. Molecular and cellular biology. 2000;20:1868–1876. doi: 10.1128/MCB.20.5.1868-1876.2000. [DOI] [PMC free article] [PubMed] [Google Scholar]
- 60.Portilla D, et al. Alterations of PPARalpha and its coactivator PGC-1 in cisplatin-induced acute renal failure. Kidney international. 2002;62:1208–1218. doi: 10.1111/j.1523-1755.2002.kid553.x. [DOI] [PubMed] [Google Scholar]
- 61.Nagothu KK, Bhatt R, Kaushal GP, Portilla D. Fibrate prevents cisplatin-induced proximal tubule cell death. Kidney international. 2005;68:2680–2693. doi: 10.1111/j.1523-1755.2005.00739.x. [DOI] [PubMed] [Google Scholar]
- 62.Li S, et al. PPAR alpha ligand protects during cisplatin-induced acute renal failure by preventing inhibition of renal FAO and PDC activity. American journal of physiology. Renal physiology. 2004;286:F572–80. doi: 10.1152/ajprenal.00190.2003. [DOI] [PubMed] [Google Scholar]
- 63.Tokunaga J, et al. Protective effect of N-benzoyl-beta-alanine against cisplatin nephrotoxicity in rats. Renal failure. 1996;18:225–240. doi: 10.3109/08860229609052792. [DOI] [PubMed] [Google Scholar]
- 64.Rastegar AM, Bidadkosh A, Vahdani R, Eini F, Azadi S. Vitamin B6 dose-dependently ameliorates renal hemodynamic toxicity of cisplatin in rat model of nephrotoxicity: the histopathologic and biochemical findings. Comparative Clinical Pathology. 2014;23:703–708. doi: 10.1007/s00580-012-1674-4. [DOI] [Google Scholar]
- 65.Chowdhury S, Sinha K, Banerjee S, Sil PC. Taurine protects cisplatin induced cardiotoxicity by modulating inflammatory and endoplasmic reticulum stress responses. BioFactors. 2016;42:647–664. doi: 10.1002/biof.1301. [DOI] [PubMed] [Google Scholar]
Associated Data
This section collects any data citations, data availability statements, or supplementary materials included in this article.
Supplementary Materials
Supplementary Tables and Figures S1 and S2
Data Availability Statement
The dataset with every replicate for endometabolite and exometabolite analysis of this study is shown in supplementary Table S5.


