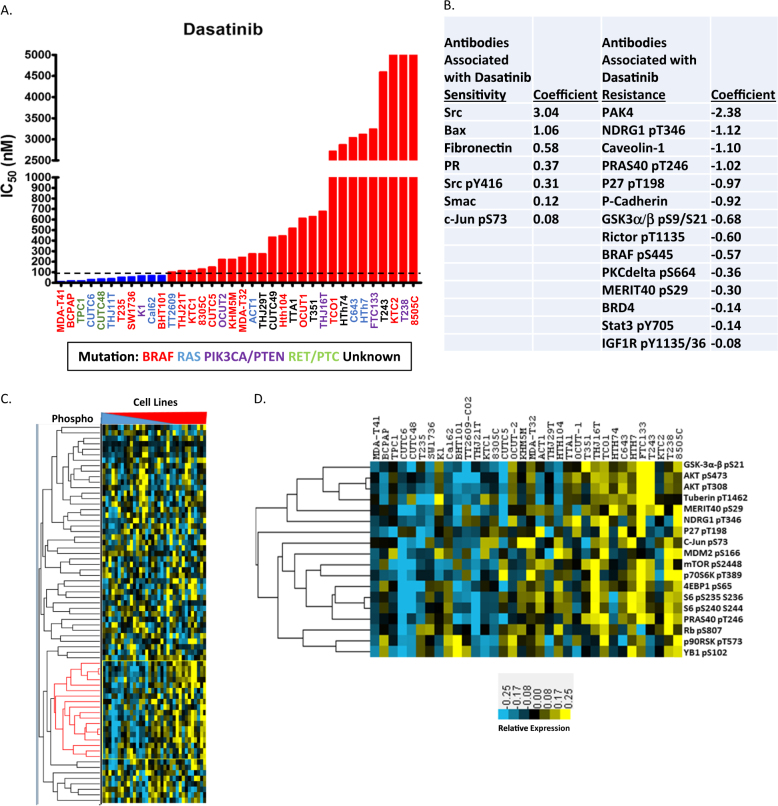
Fig. 1. Analysis of dasatinib intrinsic sensitivity and resistance.
a Absolute quantification of the IC50 value for dasatinib, in 36 thyroid cancer cell lines. Growth curves were measured across the cell lines using the CellTiter-Glo Assay (Promega), and the IC50 values were calculated. An IC50 cutoff of 90 nM (dashed line) was used to determine cell lines sensitive and resistant to dasatinib. b Protein expression parameters associated with dasatinib sensitvity and resistance in elastic net regression analysis of RPPA data generated from 34 thyroid cancer cell lines. Higher absolute coefficient value illustrates stronger association with dasatinib sensitivity or resistance. c Hierarchical clustering of phosphoprotein expression data obtained by RPPA analysis of 34 thyroid cancer cell lines. Cell lines were arranged in increasing dasatinib IC50 order from most sensitive to most resistant. d phosphoprotein cluster containing many components of PI3K pathway, whose expression positively correlates with dasatinib resistance

