Abstract
This cohort study uses the 33-item Mood and Feelings Questionnaire to examine whether symptom network density is associated with treatment response in adolescent depression.
One in 4 adolescents with depression does not respond favorably to treatment. Prognostic markers to identify this nonresponder group are lacking and urgently needed. It has been suggested that the network structure of depressive symptoms (ie, group-level covariance or connectivity between symptoms) may be informative in this regard. Intuitively, one may expect that more densely connected networks would be more inclined to result in negative spirals (eg, sleeplessness causes an individual to be too tired to go out, which leads to a lack of friends, resulting in sadness) and therefore more liable to nonresponse. An influential naturalistic study by van Borkulo et al published in JAMA Psychiatry reported that adult patients with depression who continue to experience problems in subsequent years have more densely connected networks at baseline than patients who later recover. Here, we performed a conceptual replication of that study in adolescents with depression who participated in a psychological treatment trial. We tested whether network characteristics at baseline were prognostic for long-term outcomes.
Methods
Patients with depression completed the 33-item Mood and Feelings Questionnaire (MFQ) prior to treatment, with regular additional assessments up to 12 months after the end of treatment (ie, mean [SD], 22 [4.7] months after baseline assessment). The MFQ assesses recent self-reported depressive symptoms on a 4-point scale (never, sometimes, often, and always), with total scores ranging from 0 to 66 (higher scores indicate more severe depressive symptoms). In accordance with van Borkulo et al, 11 items optimally representing DSM-5 symptoms of depression were selected for use in the present study conducted from June 29, 2010, to January 17, 2013, with data analyses performed from February 1 to June 25, 2017. The study was approved by the Cambridgeshire Research Ethics Committee and local National Health Service provider trusts. All patients and parents gave written informed consent.
To derive 2 equally sized groups, relatively good and poor responders were differentiated by the median percentage change between baseline and final follow-up of the MFQ summary score (median [interquartile range], −66% [41.2%]). Baseline regularized partial correlation matrices were estimated based on Spearman correlation coefficients. From those, the weighted sum of all absolute connections in the network (network density) as well as in each node (node strength) was derived. Parameters were compared using permutation testing (global α = .05; adjusted α per node per item, .05/11 = .005; 1-sided). All analyses were performed using R, version 3.2.4 (The R Foundation), with the qgraph package, version 1.3.5.
Results
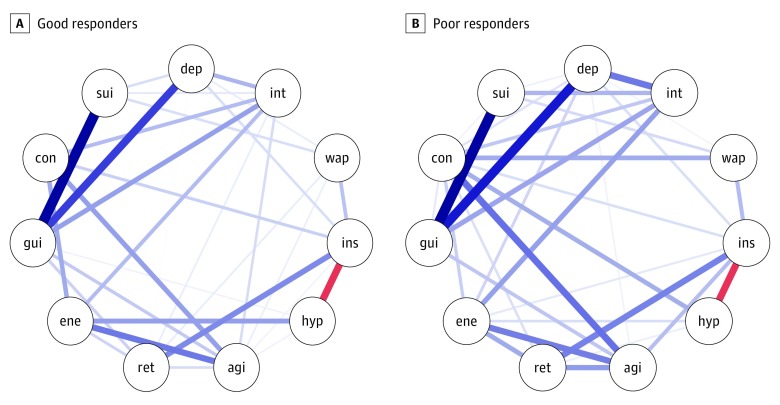
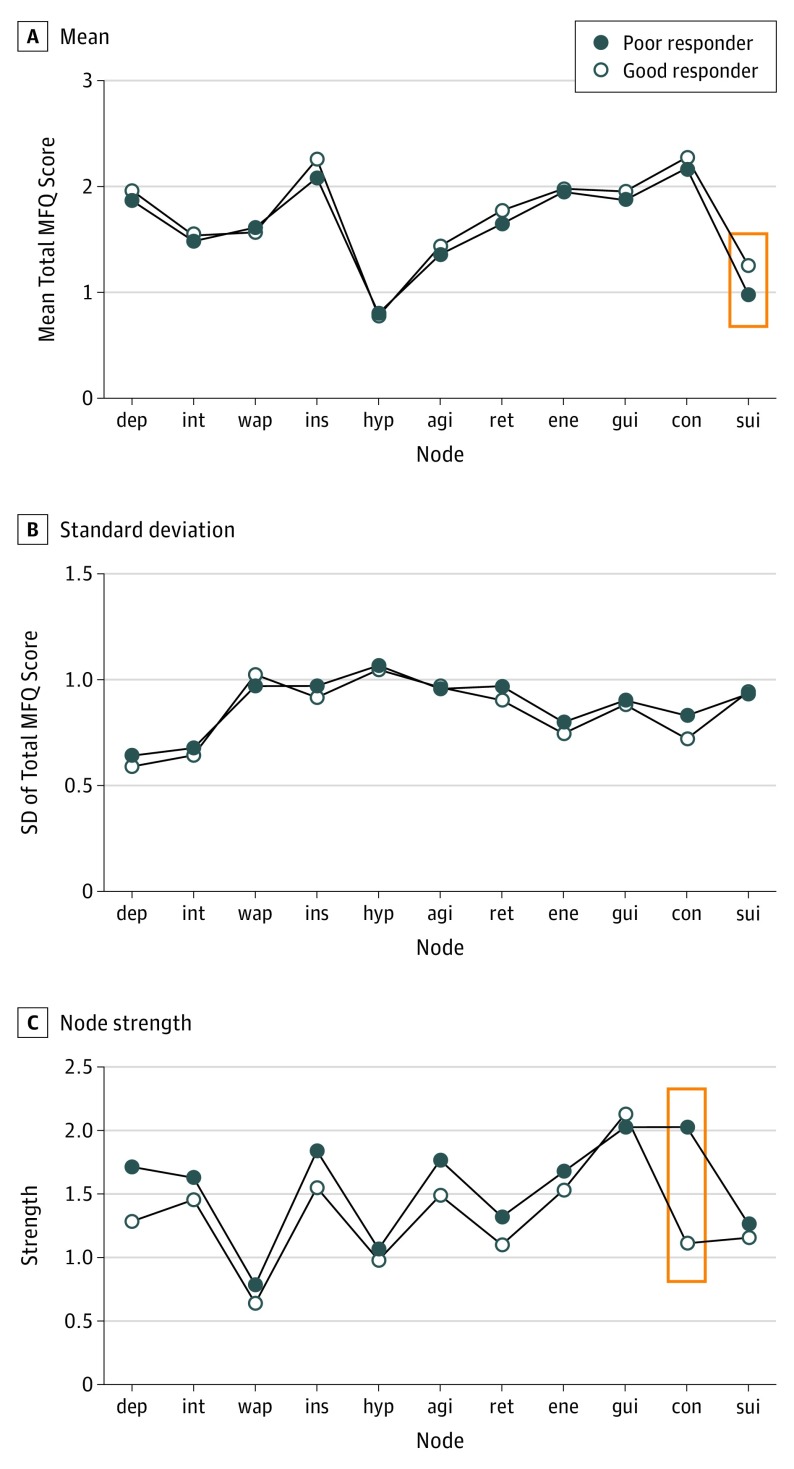
The cohort consisted of 465 adolescents with depression (349 [75.1%] were girls; aged 11-17 years). Good responders had higher mean (SD) MFQ summary scores at baseline (47.5 [9.2] vs 44.3 [11.6]; P = .006) and higher mean (SD) levels of suicidality (1.25 [0.9] vs 1.00 [0.9]; P < .001) compared with poor responders. Although global network strength was higher in poor responders, the difference was not significant (good responders, 3.6; poor, 4.3; P = .15; Figure 1). There were no differences in local node strength except for that of “concentration problems,” which at the uncorrected α level was more connected to the other nodes in the poor responders than in the good responders (good responders, 1.1; poor responders, 2.0; P = .02; Figure 2). Sensitivity analyses indicated similar findings when treatment response was defined as below clinical threshold (ie, MFQ score <27) at the final follow-up.
Figure 1. Network Structures of Depressive Symptoms in 233 Relatively Good and 232 Poor Responders to Treatment.
Blue lines represent positive connections; red lines, negative connections; and thicker lines, stronger connections. For the symptom (node) abbreviations, agi indicates psychomotor agitation; con, concentration problems; dep, feeling sad/depressed; ene, loss of energy; gui, guilt/worthlessness; hyp, hypersomnia; ins, insomnia; int, loss of interest/pleasure; ret, psychomotor retardation; sui, suicidal ideation; and wap, weight or appetite change.
Figure 2. Differences in Total Mood and Feelings Questionnaire (MFQ) Mean Score, SD of the Mean Score, and Node Strength by Symptom Between Good and Poor Responders to Treatment.
Red boxes outline statistically significant differences. Symptom (node) abbreviations are defined in the caption to Figure 1.
Discussion
Applying the same statistical methods as those used in the study by van Borkulo et al, which had a similarly sized sample of adults with depression followed up naturalistically, we found no significant association between higher network strength and poorer outcomes. That the direction of the association in our study was consistent with the results of the previous study, however, indicates that further investigation of the validity of network strength as a prognostic marker is warranted. There were 2 important methodological differences between the studies. First, the previous one was a naturalistic cohort study, whereas here we evaluated treatment outcomes. Stronger symptom networks may be prognostic of depression persistence in naturalistic settings but not when symptoms (and perhaps networks) are actively being challenged. Second, network density may not have equal prognostic value in adult and adolescent groups. For instance, denser networks may be a consequence and a behavioral marker of longer illness duration or recurrent episodes but have no such signature in first-episode depression in adolescents. Unfortunately, this hypothesis cannot be tested within the current sample of adolescents with depression, most of whom were experiencing their first episode.
With network analyses taking an astonishing flight in psychiatry, we recommend cautious application of group-level network density as a prognostic marker. Crucial steps to be taken by the field include further replication studies as well as in-depth psychometric evaluation of the reliability and clinical correlates of network parameters.
References
- 1.Goodyer IM, Reynolds S, Barrett B, et al. Cognitive behavioural therapy and short-term psychoanalytical psychotherapy versus a brief psychosocial intervention in adolescents with unipolar major depressive disorder (IMPACT): a multicentre, pragmatic, observer-blind, randomised controlled superiority trial. Lancet Psychiatry. 2017;4(2):109-119. [DOI] [PMC free article] [PubMed] [Google Scholar]
- 2.Nilsen TS, Eisemann M, Kvernmo S. Predictors and moderators of outcome in child and adolescent anxiety and depression: a systematic review of psychological treatment studies. Eur Child Adolesc Psychiatry. 2013;22(2):69-87. [DOI] [PubMed] [Google Scholar]
- 3.van Borkulo C, Boschloo L, Borsboom D, Penninx BWJH, Waldorp LJ, Schoevers RA. Association of symptom network structure with the course of [corrected] depression. JAMA Psychiatry. 2015;72(12):1219-1226. [DOI] [PubMed] [Google Scholar]
- 4.Daviss WB, Birmaher B, Melhem NA, Axelson DA, Michaels SM, Brent DA. Criterion validity of the Mood and Feelings Questionnaire for depressive episodes in clinic and non-clinic subjects. J Child Psychol Psychiatry. 2006;47(9):927-934. [DOI] [PubMed] [Google Scholar]
- 5.Epskamp S, Cramer AOJ, Waldorp LJ, Schmittmann VD, Borsboom D. Qgraph: network visualizations of relationships in psychometric data. J Stat Soft. 2012;48(4):1-18. [Google Scholar]
- 6.van Borkulo CD, Waldorp LJ, Boschloo L, et al. Comparing network structures on three aspects: a permutation test. ResearchGate. Published March 2017. Accessed May 4, 2017. doi: 10.13140/RG.2.2.29455.38569 [DOI] [PubMed] [Google Scholar]


