

A comprehensive field and modeling study indicates vulnerability of tidal wetlands to sea-level rise on the U.S. Pacific coast.
Abstract
We used a first-of-its-kind comprehensive scenario approach to evaluate both the vertical and horizontal response of tidal wetlands to projected changes in the rate of sea-level rise (SLR) across 14 estuaries along the Pacific coast of the continental United States. Throughout the U.S. Pacific region, we found that tidal wetlands are highly vulnerable to end-of-century submergence, with resulting extensive loss of habitat. Using higher-range SLR scenarios, all high and middle marsh habitats were lost, with 83% of current tidal wetlands transitioning to unvegetated habitats by 2110. The wetland area lost was greater in California and Oregon (100%) but still severe in Washington, with 68% submerged by the end of the century. The only wetland habitat remaining at the end of the century was low marsh under higher-range SLR rates. Tidal wetland loss was also likely under more conservative SLR scenarios, including loss of 95% of high marsh and 60% of middle marsh habitats by the end of the century. Horizontal migration of most wetlands was constrained by coastal development or steep topography, with just two wetland sites having sufficient upland space for migration and the possibility for nearly 1:1 replacement, making SLR threats particularly high in this region and generally undocumented. With low vertical accretion rates and little upland migration space, Pacific coast tidal wetlands are at imminent risk of submergence with projected rates of rapid SLR.
INTRODUCTION
Accelerating rates of sea-level rise (SLR) threaten the long-term sustainability of valuable tidal ecosystems. Coastal ecosystems, including tidal wetlands, protect human communities from storm surges and SLR (1, 2), helping to ameliorate approximately 23.2 billion U.S.$/year of damage along the U.S. Atlantic and Southern coastlines alone (3). They also provide other critical ecosystem services such as endangered species and fisheries habitat, carbon sequestration, water filtration, and sediment trapping (4, 5). Estimates for relative SLR projections for the Pacific coast of North America range from 0.15 to 1.6 m over the next century (6), although recent studies indicate that melting of Antarctic ice sheets alone could contribute more than 1 m of SLR by the end of the century (7). Wetland submergence from SLR can be avoided if vertical accretion and landward transgression or migration are occurring at a rate faster than relative SLR (8). Tidal wetlands build elevation relative to sea level by sediment accumulation and organic matter production (9), but human perturbation of sediment dynamics affects accretion potential (10) and alters geomorphic processes by increasing land subsidence and soil compaction (11), which can increase local relative SLR rates. Pacific coast wetlands are largely dependent on mineral sediment delivery from rivers and the ocean for vertical accretion (12, 13). Human modifications to watersheds, especially the prevalence of dams and other water diversions, have reduced sediment delivery to many of these tidal wetlands (14). In addition, the initial wetland platform elevation relative to sea level, termed elevation capital or the potential of an intertidal wetland to remain within a suitable inundation regime in the face of increasing SLR, is an important metric to understand vulnerability (15). Besides accreting vertically, marshes can also adjust to SLR through landward horizontal transgression or migration onto adjacent, low-lying uplands, therefore preventing acreage loss (16, 17). All of the above processes vary from wetland to wetland, making regional assessments of vulnerability important. The potential for vertical and horizontal wetland adjustment to future SLR has raised questions about the uncertainty regarding the general vulnerability of tidal wetlands to anticipated rates of relative SLR over the 21st century, leading to suggestions that vulnerability has been overestimated (18).
Because marshes will respond in a highly individualistic manner to SLR, an empirical model [Wetland Accretion Rate Model of Ecosystem Resilience (WARMER) (19)] that can readily be applied individually to a large number of sites is required to estimate regional vulnerability of coastal wetlands to 21st century SLR. WARMER uses a dynamic accretion mechanism that incorporates a positive relationship between flooding and accretion (20) and improves on other approaches that use constant historic accretion rates and have been subject to criticism (8). Our approach incorporates site-specific data on wetland elevation, tidal inundation, accretion rates, soil characteristics, and SLR predictions into a dynamic process model to generate high-resolution predictions of marsh vulnerability to SLR through the century. Therefore, our modeling goes beyond approaches based on a single study site, metric, or measured indicators of present or past accretion rates, such as Surface Elevation Tables (SETs) that are commonly used (15, 17, 21, 22) and do not isolate the impacts of SLR from other stressors. Here, we report on the first such effort applied to a network of 14 estuaries that are distributed across a latitudinal and climate gradient along the Pacific coast of the continental United States (Fig. 1). Estuaries along the Pacific coast are relatively small in comparison to other regions of the world, and they occupy low-energy areas along riverine valleys in the Pacific Northwest or highly urbanized and modified estuaries throughout much of California. Tidal wetlands along the Pacific coast have a mixed semidiurnal tidal regime, creating high-elevation platforms that are composed primarily of low, middle, and high marsh vegetation along a tidal gradient. The California coast has a Mediterranean climate with warm dry weather, with freshwater delivery primarily coming during winter rainy months, whereas the Pacific Northwest has a temperate maritime climate with cool wet conditions year round with higher summer ambient temperatures. The mean tidal range (1.75 to 3.38 m) and relative SLR (Southern California, 1.74 ± 0.63 mm/year; Washington, 0.62 ± 0.59 mm/year) also differ along this latitudinal and climate gradient. This region of North America contains important nursery for fisheries, marine mammals, migratory birds, and endemic wetland wildlife but has largely been missing from the wetland SLR literature.
Fig. 1. We examined the vulnerability to SLR in 14 estuaries distributed along a climate, tidal, and latitudinal gradient.
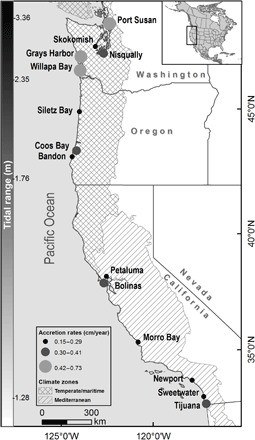
Sites varied in historic accretion rates, as determined from radio isotopic dating of sediment cores.
RESULTS
Our modeling demonstrates that the magnitude of wetland elevation loss to SLR varied across sites and SLR scenarios projected through 2110 (SLR scenarios: Washington and Oregon, high = +142 cm, moderate = +63 cm, and low = +12 cm; California, high = +166 cm, moderate = +93 cm, and low = +44 cm) but was highest in the latter part of the 21st century and under the highest SLR rates (Fig. 2). Mean initial elevation of the marsh surface above mean sea level (MSL; z* = 0.0) was z* = 0.92 for all sites, with 29% of sites over local mean higher high water (MHHW). Mean initial elevation was z* = 0.89 for Pacific Northwest wetlands, with 25% above local MHHW, and z* = 0.96 for California wetlands, with 33% above local MHHW. Contrary to recent theory (15), we found that elevation capital was not a consistent indicator of persistence with SLR to the end of the century, whereas measured accretion rates and the rate of SLR were better predictors of vulnerability. For example, four study sites (Nisqually, Siletz, Sweetwater, and Tijuana) had large elevation capital relative to MHHW, but none maintained elevation relative under SLR because of low measured accretion rates (0.33, 0.27, 0.15, and 0.33 cm/year, respectively). Mean wetland elevation at all study sites declined under moderate and high SLR scenarios (Fig. 2), and 50% of sites declined to below MSL (z* = 0.0) by 2110 under the highest SLR scenario. Under the highest SLR scenario, wetland area was markedly lost across all wetlands, except for two study sites located in the Pacific Northwest. Grays Harbor, which had the second highest net accretion rate (0.79 cm/year), and Willapa Bay, which had the third largest accretion rate (0.62 cm/year), were both projected to maintain higher relative elevations compared to the rest of the sites through 2110 under all SLR scenarios, even with mean initial elevations below MHHW (Willapa, z* = 0.97; Grays Harbor, z* = 0.82). The remaining 12 wetlands were projected to markedly lose elevation relative to sea levels under moderate and high SLR scenarios, resulting in submergence.
Fig. 2. WARMER projections of marsh elevation under three SLR scenarios.
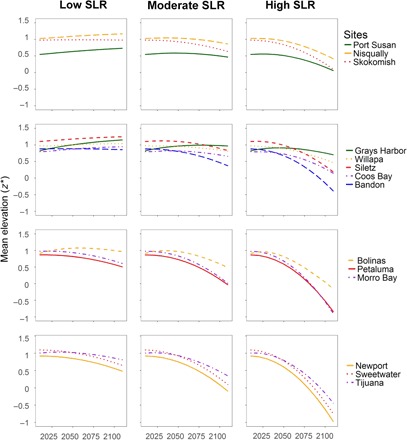
We incorporated low, moderate, and high SLR rates (6) into the WARMER model to project 2010–2110 change in mean marsh elevation. Under a low SLR scenario, many tidal marshes were projected to lose little elevation through most of the century. However, under higher rates of SLR, most wetland study sites lost mean elevation and did not “keep pace” with relative SLR, resulting in the loss of wetland elevation. MHHW is at z* = 1.0; mean tide level (MTL) is at z* = 0.0.
We determined the resulting fate of wetland vegetation communities and habitat based on vegetation occurrence and relationships between tidal inundation and wetland elevation. Extensive field surveys were used to develop relationships between inundation and changes in habitat type and wildlife vulnerabilities. Using measured relationships, we defined low, middle, and high wetland habitats within each site. These habitat zones along the tidal gradient support different plant assemblages (23, 24). These wetland habitats also support obligate plant and animal species that are of management concern, including many threatened and endangered species (25–27). We found that, under low SLR scenarios, habitat composition remained similar over the coming century, except for Southern California where high marsh habitats were submerged in the latter part of the century. Under a moderate SLR scenario, 95 and 60% of high and middle marsh areas, respectively, were lost by 2110. High SLR scenarios indicated a total loss of all high and middle marsh habitats by the end of the century (Fig. 3). Under a high SLR scenario, 83% of total marsh habitat across all study sites transitioned to unvegetated habitat (both mudflat and open water) by 2110, with the greatest shifts in habitat occurring in Oregon and California. All marsh habitats under high SLR remaining at the end of the century (17% of the area) consisted of low marsh, with all of it located in the Pacific Northwest. Under high SLR scenario, all wetland study sites in California and Oregon were submerged by the end of the century, illustrating a clear vulnerability, with only low marsh vegetation remaining in estuaries with relatively high accretion rates in the Pacific Northwest.
Fig. 3. Habitat projections from WARMER modeling under three SLR scenarios.
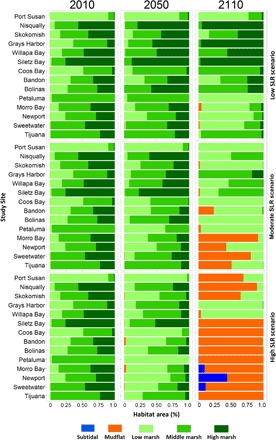
Under moderate and high SLR scenarios, all study sites are projected to undergo substantial loss of elevation over the coming century, resulting in major changes in the composition of tidal wetland habitat types. By 2050, under moderate and high SLR scenarios, there is a gradual loss of high marsh habitats with an expansion of middle and low marsh habitats. Under moderate SLR scenarios by 2110, there is a loss of middle and high marsh habitats and submergence of tidal marsh, with a conversion to intertidal mudflat and open water at 36% of our study sites. Under high SLR scenarios, there is a total loss of all middle and high marsh habitats and submergence at 86% of the study sites, with three study sites going partly subtidal.
To explore wetland transgression or migration potential, we defined adjacent low-lying areas within an elevation zone corresponding to high SLR scenarios. For most of the estuaries we examined, opportunities for wetlands to migrate upslope were limited because of urban encroachment or steep terrain (fig. S1), with wetlands already occupying the maximum space available to them. Mean wetland migration potential for 1:1 wetland area replacement across estuaries was only 32%, with wetlands at Skokomish, WA and Sweetwater, CA having the possibility of more than 50% replacement of current marsh area within adjacent uplands (Fig. 4 and fig. S1). Many Pacific Northwest sites occupy narrow riverine valleys with steep topography that limits upslope movement. In contrast, California sites were constrained by adjacent human infrastructure, both urban and agriculture areas. Accounting for potential migration area under high SLR, California sites will lose a total of 292 ha (59%) of marsh habitat if migration is allowed to occur [496 ha (99%) without migration], and Pacific Northwest sites will lose 103 ha [19%; 372 ha (68%) without migration] even if migration occurs. However, most of those available hectares for migration are in the Pacific Northwest at one study site (Skokomish marsh), with 151 ha of adjacent upland that could potentially be future wetland habitat with migration. Pairing migration potential (migration potential index, current marsh area/suitable upland migration area) with the WARMER results for the high SLR scenario (WARMER ratio, 2110 ending elevation/2010 starting elevation), we are able to identify sites that are susceptible to SLR vertically and have little to no migration potential upslope (Fig. 4). Because of barriers restricting upslope migration, vertical elevation building within U.S. Pacific coast marshes is critical for maintenance of current wetland extent and composition under SLR scenarios. With limited migration area and low vertical accretion, sites such as Morro Bay located on the Central California coast and Bandon marsh on the Oregon outer coast have little likelihood of persisting without direct management intervention (Fig. 4).
Fig. 4. Relative vulnerability of tidal marsh study sites to SLR.
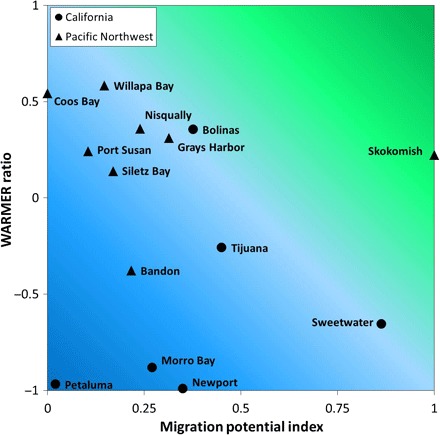
We assessed relative differences in overall wetland vulnerability across the Pacific coast by pairing available upland migration space with modeled vertical wetland elevation change under high SLR using WARMER. Migration potential index was calculated by dividing the current marsh area in the estuary by the area of suitable upland migration area. California sites were the most vulnerable because of substantial wetland elevation loss and minimal migration potential under a high SLR scenario. No study sites had enough low-elevation adjacent upland to allow 1:1 replacement of the current wetland area, and most wetlands had less than 50% available land for replacement. WARMER ratio was calculated by dividing the ending 2110 elevation by the beginning 2010 elevation under a high SLR scenario. WARMER ratio represents a site’s ability to maintain elevation through time. Colors represent risk at 25% intervals, from blue shades illustrating highest risks of submergence to green shades suggesting lowest risk of submergence from SLR.
DISCUSSION
In contrast to the Atlantic coast and the Gulf of Mexico where there are observed higher rates of SLR and significant current wetland loss in regions such as the Mississippi Delta, tidal wetland vulnerability may be lessened by greater opportunities for wetlands to migrate inland (8, 28, 29). Along the Pacific coast, the combined effects of SLR, low accretion rates, and a severe lack of upland accommodation space for wetland migration indicate that many Pacific coast wetlands are highly vulnerable to SLR over the coming century (Fig. 4). These factors can act in synergy, exacerbating the potential negative impacts of accelerating SLR to wetland area and functions. As development pressure in the coastal zone increases, constraints on wetland migration are likely to increase, intensifying loss with SLR. In addition to broad geographic patterns of SLR along the Pacific coast, site-specific conditions, such as higher accretion rates paired with higher initial elevation profiles or the presence of more flooding-tolerant plant species (such as Spartina foliosa in California estuaries), may decrease the near-term vulnerability of specific sites to submergence. For example, Tijuana Slough marsh in Southern California has higher current elevations and supports Spartina foliosa populations, perhaps increasing the site’s short-term resilience to SLR. However, it is unlikely that these factors alone will stave off wetland loss by 2110 because of the site’s low accretion rate and higher projected rates of SLR for the Southern California region.
The total loss of vegetated wetlands or the transition to primarily low marsh habitat under moderate and high SLR projections will result in a loss of storm surge protection, wildlife habitat, and a net loss of important ecosystem services along the coastline (Fig. 5). For example, in Southern and Central California, tidal wetlands are critical habitat for several endemic threatened and endangered wildlife species (30). Loss of marsh vegetation complexity due to shifts from high to low marsh is likely to negatively affect wildlife species such as the endangered salt marsh harvest mouse (Reithrodontomys raviventris) that rely on elevated refugia in the high marsh zone to escape predation and drowning (31). The endangered marsh endemic species of Southern California, including the light-footed Ridgway’s rail (Rallus obsoletus levipes) and Belding’s Savannah Sparrow (Passerculus sandwichensis beldingi), are projected to experience substantial habitat loss relatively early in the century, increasing risk of extirpation and extinction. The long-term capacity for carbon storage in tidal wetlands will also decline with accelerating SLR (32), and carbon will be released into the system as wetlands drown, resulting in a negative feedback to SLR. In the Pacific Northwest, wetland loss will affect the availability of food resources for life history stages of migratory birds (5) and salmonids dependent on vegetated estuarine resources for foraging during key times of the year (33). In contrast, expansion of intertidal mudflat with relative SLR may increase foraging habitat for shorebirds (Fig. 5); however, future use by wildlife of these analog habitats is highly uncertain.
Fig. 5. Modeling results illustrate changes from current habitat composition to greater extent of low marsh and mudflats under high rates of SLR at Newport Bay, which sits within the urban landscape of Southern California.
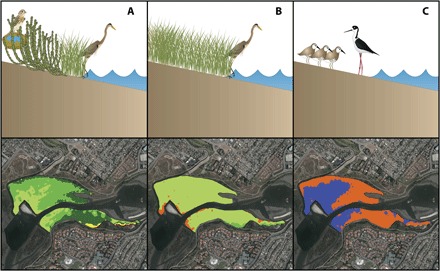
(A) Currently, there is a mix of high, middle, and low marsh that provides habitat to a variety of endemic threatened and endangered wetland species, but (B) middle and high marsh habitats are projected to be lost by 2050, decreasing plant community complexity and diversity and available habitat. (C) Increased availability of waterbird habitat may occur with expansion of subtidal and intertidal mudflats, but the complete loss of wetland vegetation is projected to occur by 2110.
Management actions that prevent tidal wetland loss over the near and long term are important topics of concern to coastal managers. The relatively slow rates of SLR early this century provide an opportunity to build additional resilience into tidal wetland ecosystems through wetland restoration, enhancement, or coastal engineering such as “managed retreat” (34–36). Ecosystem-based engineering solutions that combine conventional engineering and wetland restoration may mitigate the risks of rising sea levels (37). Wetland habitat response to SLR will have implications for restoration design but will be realized differently within each estuary based on current conditions and the limitations of promoting self-sustaining landscapes that incorporate large-scale disturbances from SLR (38). SLR pressure on wetlands will act in conjunction with a range of other stressors in estuaries, including land conversion and hydrological changes in water supply and quality, floods, and droughts, which are all projected to increase in the coming century (39, 40). However, many coastal regions are forging ahead with wetland restoration plans while incorporating innovative restoration adaptations for SLR. For example, in San Francisco Bay, California, wetland restoration planning has incorporated climate change and other stressors into a new comprehensive report that describes actions that can be taken to ensure that the tidal wetlands continue to support the ecosystem functions of San Francisco Bay with SLR (41). In addition, the use of dredged sediments to augment wetland elevation either to keep pace with SLR or to restore sediments after storms is an innovative, albeit expensive, approach to create higher elevations quickly (42).
Our results suggest that mitigating wetland loss from SLR may be limited in some regions of the Pacific coast due to urban development and steep topography (fig. S1). Therefore, innovative ideas and the public and political support for future land-use planning and, possibly, land reallocation for wetland expansion may be needed if these systems are to persist. Our results suggest that, in the absence of these actions, more than 86% of all our wetland study sites and 100% of study sites in California and Oregon could be submerged by the end of the century, with little opportunity for upland migration. Wetland restoration and conservation efforts in estuaries with relatively high initial elevations, high sediment supply, or potential upland migration space may promote long-term persistence and mitigate net loss of important wetland habitats in selected locales. At sites where hard infrastructure and steep natural topography limit migration, opportunities for nature-based adaptation solutions may be applicable early in the century. In many cases, however, low accretion rates and low migration potential may necessitate applying costly, hard engineering solutions or accepting tidal wetland loss later in the century.
MATERIALS AND METHODS
We investigated the temporal and spatial dimension of tidal wetland vulnerability to SLR at 14 major estuaries along the Pacific coast of the United States. The sites spanned gradients in climate, tidal range, urbanization, and geomorphic conditions and represented a major portion of the interhemispheric Pacific Flyway for migrating birds (Fig. 1). Unlike more generalized meta-analyses of large-scale marsh vulnerability, we modeled vulnerability of these wetlands by integrating data on their site-specific topography, tidal inundation, historic accretion rates, vegetation composition, and underlying sediment properties. On the basis of long-term water level data and detailed surveys of wetland surface elevation, each wetland was subdivided into low, middle, and high marsh, and unvegetated intertidal mudflats. Field data and digital elevation models (DEM) were then integrated into a one-dimensional (1D) soil elevation models (19) that were calibrated with wetland accretion rates obtained from new 137Cs-dated sediment cores at each site or from the literature (table S1).
The potential in situ vertical accretion response and the horizontal migration potential into adjacent low-lying areas for each marsh were assessed with SLR projections for the Pacific coast of North America (6). Vertical accretion was assessed at low (+12 cm), moderate (+63 cm), and high (+142 cm) SLR scenarios for the Pacific Northwest by 2110, whereas the scenarios used for California south of Cape Mendocino were +44 cm (low), +93 cm (moderate), and +166 cm (high) by 2110 (6). SLR rates used were not linear through time but were determined by the shape and rate of the projections shown in fig. S2.
Wetland elevation and spatial interpolation
To assess the current elevation profile of tidal wetlands at each study site, we conducted Global Positioning System (GPS) surveys between 2009 and 2014 using a Leica RX1200 real-time kinematic rover (±1 cm horizontal, ±2 cm vertical precision; Leica Geosystems Inc.; table S2). Although Light Detection and Ranging (LiDAR) data exist, the vertical bias due to dense wetland vegetation makes it unsuitable as the baseline condition for predictive modeling at the centimeter scale (43). We used the World Geodetic System 1984 ellipsoid model for vertical positioning on the earth surface and checked measurement accuracy on nearby stable benchmarks. Average measured vertical errors at benchmarks were 1 to 9 cm throughout the study (23, 24). We then generated DEMs of initial elevation conditions by ordinary kriging interpolation of the elevation data obtained at each site using the ArcGIS 10.3.1 Spatial Analyst (Environmental Systems Research Institute Inc.). We used a 5 × 5–m cell size after adjusting model parameters to minimize the root-mean-square error.
We conducted elevation and model analyses in z*, a unitless measure of relative elevation, which accounts for variation in tidal range and allows direct comparison of SLR impacts across estuaries [z* = North American Vertical Datum 1988 (NAVD88) − MTL]/[MHHW − MTL); table S3). We used a combination of National Oceanic and Atmospheric Administration (NOAA) tidal data and water level monitoring at our sites to obtain local tidal datums. We deployed water level loggers (model 3001, Solinst Canada Ltd.) in tidal channels adjacent to the sites to estimate local mean high water (MHW) and MHHW following the tidal computation methods of NOAA (44). We deployed one to four water level loggers at all sites over 12 months. Water level loggers were deployed in major tidal channels connecting the marshes to the estuary. Water level data were collected every 6 min and used to develop local hydrographs and inundation rates. Loggers were surveyed by real-time kinematic GPS at least once during the period of deployment. We corrected all raw water level data with local time series of barometric pressure using Solinst barometric loggers (model 3001, Solinst Canada Ltd.), using additional HOBO loggers (Model U-20-001-01-Ti, Onset Computer Corporation), or from local airports (distance, <16 km). We estimated MTL for each site by using the NOAA VDATUM model (v.3.4; http://vdatum.noaa.gov/).
To consistently delineate habitat elevation zones for analyses and mapping across all study sites, we used long-term NOAA tide gauge data on high-tide inundation patterns and low marsh vegetation limits at the study sites. We compiled the high-tide data from 2004 to 2013 at five NOAA tidal stations along the U.S. west coast [Seattle, WA; Toke Point, Willapa Bay, WA; Charleston, OR; San Francisco, CA; and San Diego, CA; (http://tidesandcurrents.noaa.gov/)] to assess long-term frequency of high-tide inundation from low marsh to upland. We used Seattle data for all sites in Puget Sound (Port Susan, Nisqually, and Skokomish), Toke Point for outer coast Washington sites (Willapa and Grays Harbor), Charleston for all Oregon sites (Siletz, Coos Bay, and Bandon), San Francisco for sites in Central California sites (Bolinas, Petaluma, and Morro), and San Diego for Southern California sites (Newport, Sweetwater, and Tijuana).
We defined low marsh as the elevation range between the lowest vegetation plot and the elevation reached by 50% of all recorded high tides (low marsh flooded at least once daily, on average). We defined middle marsh as habitat flooded by 25 to 50% (flooding once every 2 days) of all high tides and high marsh as elevations flooded by 0.14 to 25% (flooding once per year, on average) of all high tides. Mudflat occurred between local mean lower low water (MLLW) and the lowest extent of emergent tidal marsh vegetation; subtidal habitat occurred below MLLW. Using the regional NOAA data, we determined the z* ranges that corresponded to these three marsh habitat zones at each site (table S4). We evaluated vegetation composition in each of our habitat zones with vegetation data we collected concurrently with elevation surveys at about 25% of the elevation points.
Wetland modeling
We examined the effects of SLR on tidal marsh habitat using the WARMER model (Eq. 1) (19). WARMER is a 1D model of wetland elevation change based on sediment cohorts, where cohort volume is calculated annually as a function of mineral deposition, compaction, organic matter accumulation, and decomposition rates
| (1) |
where E(0) is the initial elevation relative to MTL, SLR(t) is the sea-level at time t relative to the initial MSL, and Vi(t) is the volume per unit area, or height, at time t of the cohort formed during year i.
Model parameterization
To parameterize WARMER, we collected sediment cores in 2012 to 2014 at California study sites and used published sediment core and accretion data for the remaining sites (tables S1 and S2). Cores (1 to 3; 50 cm deep) were sampled across an elevation gradient at each study site. We sectioned the cores into 1-cm slices, determined bulk density and organic content by loss on ignition, and dated sections by quantifying 137Cs radioisotope concentration (45). Depth profiles showing 137Cs activity for the cores collected in Southern, Central, and Northern California are presented in fig. S3 and table S5. From the dated cores, we calculated average mineral and organic matter accumulation rates over the last 50 years and used additional soil core properties (proportion of refractory carbon and porosity, organic matter density of 1.14 g/cm3, and mineral density of 2.61 g/cm3) to parameterize WARMER (tables S6 and S7).
The annual mineral accretion rate is a function of inundation frequency and the mineral accumulation rates measured from 137Cs dating of soil cores sampled across each site. For each site, we developed a continuous model of water level from the major harmonic constituents of a nearby NOAA tide gauge. This allowed a more accurate characterization of the full tidal regime because our water loggers were located above MLLW. Following Swanson et al. (19), we assumed that inundation frequency was directly related to sediment mass accumulation; this simplifying assumption holds suspended sediment concentration and settling velocity constant. Sediment accretion, Ms, at a given elevation, z, is equal to
| (2) |
where f(z) is the dimensionless inundation frequency as a function of elevation (z, in MSL), and S is the annual sediment accumulation rate (in g cm−2 year−1).
We calibrated the amplitude of the inundation frequency function to the sediment accumulation rates from the soil cores. This method allowed us to estimate an annual sediment accumulation rate in g cm−2 year−1 across an elevation range for each of our study sites.
Compaction and decomposition functions in the WARMER model followed Callaway et al. (46). We determined sediment compaction using the difference in measured porosity between the top 5 cm and the bottom 5 cm of each sediment core. We estimated the rate of decrease, r, in porosity of a given cohort as a function of the density of all material above that cohort
| (3) |
where pb is the density of the material above a cohort, and k1 was a calibration constant.
Following Swanson et al. (19), we modeled decomposition as a three-stage process where the youngest organic material (less than 1 year old) decomposed at the fastest rate, 1- to 2-year-old organic matter decayed at a moderate rate, and organic matter greater than 2 years old decayed at the slowest rate. Decomposition also decreased exponentially with depth. We determined the percentage of refractory organic material by comparing the organic content in the top and bottom 5 cm of the sediment cores. We used constants to parameterize the compaction and decomposition functions from Deverel et al. (47).
We used unimodal functional relationships to quantify variability in organic matter deposition along the tidal elevation gradient at each site, based on the qualitative relationship observed for Spartina alterniflora (19, 48). To adjust the Morris et al. (48) curve for west coast marshes, we used Bezier curves to draw unimodal parabolas at each site, with the assumption that productivity minima occurred at the lowest elevation of marsh vegetation occurrence and at the high marsh boundary, defined as the elevation of maximum observed water level obtained from a nearby NOAA tide gauge. We determined the elevation where maximum productivity occurred by calculating the normalized difference vegetation index [(near infrared − red)/(near infrared + red)]) across the site from National Agriculture Imagery Program imagery (four spectral bands, 1-m resolution) (49) and our interpolated DEMs. We calibrated the amplitude of the organic matter input function using the organic matter accumulations rates from the sediment cores for each site. To partition total organic matter inputs into contributions from aboveground versus belowground fractions, we used a constant root-to-shoot ratio for organic matter production. For our sites in California, we used experimental growth data from Salicornia pacifica, a common west coast tidal marsh plant, whereas for the sites in the Pacific Northwest, we used experimental growth data for Carex lyngbyei and Juncus balticus, two common low- and high-elevation species (50). Functions for belowground organic matter distribution, soil compaction, and organic matter decomposition were unchanged from Swanson et al. (19). We used a 200-year model spin-up period to generate a soil core that had a depth equal to the initial elevation of the model run. We ran WARMER at regular elevation intervals, interpolated final elevations between those intervals, and generated final wetland DEMs of the marsh platform at each site. To facilitate interpretation of changes in elevation under different SLR scenarios, we defined three tidal marsh habitat zones and two unvegetated zones based primarily on long-term coastal inundation data, as described above. We summarized the WARMER results every 10 years as changes in the spatial extent and distribution of the habitat zones.
Validation of tidal marsh model projections is difficult because there are typically no historic high-precision elevation data available for hind-cast comparisons. However, we examined metrics that served as a form of model validation; for example, we calculated the equilibrium elevation after 2000 years at the historic SLR rate and found that marsh equilibrium occurred between MHW and MAT (maximum annual tide), which are elevations typical of mature marsh development (table S5). Four sites had accretion rates that were too low to maintain a constant marsh surface at the historic rate of SLR.
Modeling certainty
As with other coastal wetland modeling approaches (48, 51), WARMER has some simplifying assumptions based on our current understanding of how coastal wetland ecosystems function and relate to water inundation. WARMER is a model of vegetated marsh soil; thus, model behavior at unvegetated mudflat and subtidal elevations is not well represented in these modeling outputs. In addition, these modeling results do not include lateral or vertical erosion and exclude processes such as wind-driven wave erosion and scarp formation (52). Many of the wetland study sites in this study are in protected tidal bays, and observations of erosion are limited, but erosion in future model iterations could be included to provide a more comprehensive analysis. There is large uncertainty on how interannual variations of SLR will change into the future; therefore, the SLR curves implemented here do not consider interannual variations, such as from the El Niño Southern Oscillation, which can alter water levels and affect mineral deposition rates (53). The model assumes a similar sediment supply as measured in the cores, based on the cumulative estuarine and watershed conditions since 1963 (the 137Cs marker horizon). A previous study found that WARMER projections are sensitive to the mineral accumulation rate (19), which, in turn, is sensitive to the calibration elevation and accumulation rate from the soil core. Incorporating water salinity changes that will affect rates of organic production is important; however, there is much uncertainty in the projected changes of freshwater availability with climate change and salinities in estuaries. For example, the Pacific Northwest marshes currently support brackish vegetation that will likely respond negatively to increased saltwater intrusion (50, 54). Despite these simplifications, the site-specific calibration of WARMER that we used facilitates comparison of relative SLR risk to tidal wetland across the U.S. Pacific coast in a robust methodology.
Wetland transgression
We analyzed topography and land cover type on low-lying upland areas adjacent to the wetland study sites using LiDAR data and the high SLR scenario to assess opportunities and limitations to marsh migration (fig. S1). We investigated relative wetland vulnerability to SLR across the region by examining potential upslope transgression area at the landward margin. To explore migration potential for our study sites, we used LiDAR data to investigate the low-lying upland areas of each estuary within an elevation band corresponding with the high SLR scenario (1.66 m above the current high marsh boundary at California sites and 1.42 m for Oregon and Washington sites). Potential migration areas were based on suitable elevations defined by the elevation range and maximum marsh elevation for each study site. Migration areas were constrained by identifying and excluding areas that limited the ability of wetlands to migrate (for example, levees, roads, urbanization, and rivers) by using land cover type data from the National Land Cover Database. For example, we assumed that marsh migration was limited if human infrastructure (for example, roads and cities) and other large natural features (for example, rivers) would prevent it. We considered that all other land cover types below the estuary-specific elevation threshold were available for migration. We then calculated the wetland migration potential index by dividing the current marsh area in the estuary by the area of suitable upland migration area.
Supplementary Material
Acknowledgments
We thank T. Suchanek, D. Elam, K. Miles, T. Törnqvist, and two anonymous reviewers for the thoughtful and rigorous reviews and comments on this manuscript. We thank A. Goodman, K. Powelson, K. Lovett, M. Czapanskiy, K. Spragens, V. Bui, and J. Lambert for the valuable field and office assistance with this project. The U.S. Fish and Wildlife Service, NOAA’s National Estuarine Research Reserve System, Marin County Parks, Orange County Parks, Skokomish Indian Tribe, Nature Conservancy, U.S. Navy, California State Parks, California Department of Fish and Wildlife permitted access to the research sites. Funding: The project described in this publication was supported by the U.S. Department of Interior (DOI) Southwest and Northwest Climate Science Centers, the U.S. Geological Survey DOI on the Landscape program, the U.S. Fish and Wildlife Service, the U.S. Geological Survey Climate and Land Use Research and Development Program, and the U.S. Geological Survey Ecosystem Program. Author contributions: K.T., J.T., G.M., R.A., and B.D. conceived the study. K.B., C.F., and J.R. conducted the data collection, analysis, and wetland modeling. G.M., L.B., J.H., J.S., K.H., and K.B. conducted the data collection and/or laboratory analysis for accretion data. C.J. contributed to the habitat zone data analysis and writing. G.G. contributed to the methodology development and data analysis. K.T., G.G., G.M., K.B., and C.F. contributed extensively to the writing of the manuscript. All authors contributed data and analysis and reviewed and wrote the final manuscript and the Supplementary Materials. Competing interests: The authors declare that they have no competing interests. Data and materials availability: All data needed to evaluate the conclusions in the paper are present in the paper and/or the Supplementary Materials. Additional data related to this paper may be requested from the authors. All raw data are archived at the U.S. Geological Survey Science Base Catalog (http://www.sciencebase.gov/catalog/; doi:10.5066/F7SJ1HNC and doi:10.5066/F7RX99V3). Any use of trade, product, or firm names in this publication is for descriptive purposes only and does not imply endorsement by the U.S. Government.
SUPPLEMENTARY MATERIALS
Supplementary material for this article is available at http://advances.sciencemag.org/cgi/content/full/4/2/eaao3270/DC1
fig. S1. Available transgression or migration space under high SLR scenarios for the study sites.
fig. S2. Projections of future sea level used in the WARMER modeling for high, moderate, and low SLR scenarios, from the National Research Council (6).
fig. S3. 137Cs activity (in becquerel per kilogram) shown by depth with mean ± SE for sediment cores taken from sites in Southern California.
table S1. Core elevation (in centimeters; relative to MSL) and accretion rate (in millimeters per year) for soil cores used in WARMER modeling.
table S2. Sample size, mean elevation, and elevation range of real-time kinematic GPS (in meters; NAVD88) points collected at all study sites.
table S3. Equilibrium elevations from WARMER.
table S4. Elevation range of low, middle, and high marsh zones at each site.
table S5. List of sediment cores taken from California, with locations, elevations, and estimated sediment accretion rate from 137Cs dating.
table S6. WARMER model parameters for Pacific Northwest study sites.
table S7. WARMER parameters for California study sites.
REFERENCES AND NOTES
- 1.Shepard C. C., Crain C. M., Beck M. W., The protective role of coastal marshes: A systematic review and meta-analysis. PLOS ONE 6, e27374 (2011). [DOI] [PMC free article] [PubMed] [Google Scholar]
- 2.Woodruff J. D., Irish J. L., Camargo S. J., Coastal flooding by tropical cyclones and sea-level rise. Nature 504, 44–52 (2013). [DOI] [PubMed] [Google Scholar]
- 3.Costanza R., Pérez-Maqueo O., Martinez M. L., Sutton P., Anderson S. J., Mulder K., The value of coastal wetlands for hurricane protection. Ambio 37, 241–248 (2008). [DOI] [PubMed] [Google Scholar]
- 4.Barbier E. B., Hacker S. D., Kennedy C., Koch E. W., Stier A. C., Silliman B. R., The value of estuarine and coastal ecosystem services. Ecol. Monogr. 81, 169–193 (2011). [Google Scholar]
- 5.Galbraith H., Jones R., Park R., Clough J., Herrod-Julius S., Harrington B., Page G., Global climate change and sea level rise: Potential losses of intertidal habitat for shorebirds. Waterbirds 25, 173–183 (2002). [Google Scholar]
- 6.National Resource Council, Sea-Level Rise for the Coasts of California, Oregon, and Washington: Past, Present, and Future (The National Academies Press, 2012). [Google Scholar]
- 7.DeConto R. M., Pollard D., Contribution of Antarctica to past and future sea-level rise. Nature 531, 591–597 (2016). [DOI] [PubMed] [Google Scholar]
- 8.Kirwan M. L., Megonigal J. P., Tidal wetland stability in the face of human impacts and sea-level rise. Nature 504, 53–60 (2013). [DOI] [PubMed] [Google Scholar]
- 9.Nyman J. A., Walters R. J., Delaune R. D., Patrick W. H. Jr, Marsh vertical accretion via vegetative growth. Estuar. Coast. Shelf Sci. 69, 370–380 (2006). [Google Scholar]
- 10.Tessler Z. D., Vörösmarty C. J., Grossberg M., Gladkova I., Aizenman H., Syvitski J. P. M., Foufoula-Georgiou E., Profiling risk and sustainability in coastal deltas of the world. Science 349, 638–643 (2015). [DOI] [PubMed] [Google Scholar]
- 11.Day J. W., Kemp G. P., Reed D. J., Cahoon D. R., Boumans R. M., Suhayda J. M., Gambrella R., Vegetation death and rapid loss of surface elevation in two contrasting Mississippi delta salt marshes: The role of sedimentation, autocompaction and sea-level rise. Ecol. Eng. 37, 229–240 (2011). [Google Scholar]
- 12.Callaway J. C., Borgnis E. L., Turner R. E., Milan C. S., Carbon sequestration and sediment accretion in San Francisco bay tidal wetlands. Estuar. Coast 35, 1163–1181 (2012). [Google Scholar]
- 13.Cahoon D. R., Lynch J. C., Powell A. N., Marsh vertical accretion in a Southern California Estuary, U.S.A. Estuar. Coast. Shelf Sci. 43, 19–32 (1996). [Google Scholar]
- 14.Weston N. B., Declining sediments and rising seas: An unfortunate convergence for tidal wetlands. Estuar. Coast 37, 1–23 (2014). [Google Scholar]
- 15.Lovelock C. E., Cahoon D. R., Friess D. A., Guntenspergen G. R., Krauss K. W., Reef R., Rogers K., Saunders M. L., Sidik F., Swales A., Saintilan N., Thuyen L. X., Triet T., The vulnerability of Indo-Pacific mangrove forests to sea-level rise. Nature 526, 559–563 (2015). [DOI] [PubMed] [Google Scholar]
- 16.Koplin J. R., Collopy M. W., Bammann A. R., Levenson H., Energetics of two wintering raptors. Auk 97, 795–806 (1980). [Google Scholar]
- 17.Kirwan M. L., Walters D. C., Reay W. G., Carr J. A., Sea level driven marsh expansion in a coupled model of marsh erosion and migration. Geophys. Res. Lett. 43, 4366–4373 (2016). [Google Scholar]
- 18.Kirwan M. L., Temmerman S., Skeehan E. E., Guntenspergen G. R., Fagherazzi S., Overestimation of marsh vulnerability to sea level rise. Nat. Clim. Change 6, 253–260 (2016). [Google Scholar]
- 19.Swanson K. M., Drexler J. Z., Schoellhamer D. H., Thorne K. M., Casazza M. L., Overton C. T., Callaway J. C., Takekawa J. Y., Wetland Accretion Rate Model of Ecosystem Resilience (WARMER) and its application to habitat sustainability for endangered species in the San Francisco Estuary. Estuar. Coast 37, 476–492 (2013). [Google Scholar]
- 20.Kirwan M. L., Guntenspergen G. R., D’Alpaos A., Morris J. T., Mudd S. M., Temmerman S., Limits on the adaptability of coastal marshes to rising sea level. Geophys. Res. Lett. 37, L23401 (2010). [Google Scholar]
- 21.Spencer T., Schuerch M., Nicholls R. J., Hinkel J., Lincke D., Vafeidis A. T., Reef R., McFadden L., Brown S., Global coastal wetland change under sea-level rise and related stresses: The DIVA Wetland Change Model. Global Planet. Change 139, 15–30 (2016). [Google Scholar]
- 22.Ganju N. K., Defne Z., Kirwan M. L., Fagherazzi S., D’Alpaos A., Carniello L., Spatially integrative metrics reveal hidden vulnerability of microtidal salt marshes. Nat. Commun. 8, 14156 (2017). [DOI] [PMC free article] [PubMed] [Google Scholar]
- 23.K. M. Thorne, G. M. MacDonald, R. F. Ambrose, K. J. Buffington, C. M. Freeman, C. N. Janousek, L. N. Brown, J. R. Holmquist, G. R. Guntenspergen, K. W. Powelson, P. L. Barnard, J. Y. Takekawa, “Effects of climate change on tidal marshes along a latitudinal gradient in California” (Open-File Report 2016-1125, 2016).
- 24.K. M. Thorne, B. D. Dugger, K. J. Buffington, C. M. Freeman, C. N. Janousek, K. W. Powelson, G. R. Gutenspergen, J. Y. Takekawa, “Marshes to mudflats—Effects of sea-level rise on tidal marshes along a latitudinal gradient in the Pacific Northwest” (Open-File Report 2015-1204, 2015).
- 25.Parsons L. S., Zedler J. B., Factors affecting reestablishment of an endangered annual plant at a California salt marsh. Ecol. Appl. 7, 253–267 (1997). [Google Scholar]
- 26.Zembal R., Massey B. W., Fancher J. M., Movements and activity patterns of the light-footed clapper rail. J. Wildl. Manag. 53, 39–42 (1989). [Google Scholar]
- 27.Powell A. N., Nesting habitat of Belding’s Savannah sparrows in coastal salt marshes. Wetlands 13, 219–223 (1993). [Google Scholar]
- 28.Enwright N. M., Griffith K. T., Osland M. J., Barriers to and opportunities for landward migration of coastal wetlands with sea-level rise. Front. Ecol. Environ. 14, 307–316 (2016). [Google Scholar]
- 29.Jankowski K. L., Törnqvist T. E., Fernandes A. M., Vulnerability of Louisiana’s coastal wetlands to present-day rates of relative sea-level rise. Nat. Commun. 8, 14792 (2017). [DOI] [PMC free article] [PubMed] [Google Scholar]
- 30.Thorne K. M., Takekawa J. Y., Elliott-Fisk D. L., Ecological effects of climate change on salt marsh wildlife: A case study from a highly urbanized estuary. J. Coast. Res. 28, 1477–1487 (2012). [Google Scholar]
- 31.Smith K. R., Barthman-Thompson L., Gould W. R., Mabry K. E., Effects of natural and anthropogenic change on habitat use and movement of endangered salt marsh harvest mice. PLOS ONE 9, e108739 (2014). [DOI] [PMC free article] [PubMed] [Google Scholar]
- 32.Kirwan M. L., Mudd S. M., Response of salt-marsh carbon accumulation to climate change. Nature 489, 550–553 (2012). [DOI] [PubMed] [Google Scholar]
- 33.David A. T., Simenstad C. A., Cordell J. R., Toft J. D., Ellings C. S., Gray A., Berge H. B., Wetland loss, juvenile salmon foraging performance, and density dependence in Pacific Northwest Estuaries. Estuar. Coast 39, 767–780 (2016). [Google Scholar]
- 34.Rogers K., Saintilan N., Copeland C., Managed retreat of saline coastal wetlands: Challenges and opportunities identified from the Hunter River Estuary, Australia. Estuar. Coast 37, 67–78 (2014). [Google Scholar]
- 35.Titus J. G., Rising seas, coastal erosion, and the takings clause: How to save wetlands and beaches without hurting property owners. MD Law Rev. 57, 1279–1399 (1998). [Google Scholar]
- 36.Harris J. A., Hobbs R. J., Higgs E., Aronson J., Ecological restoration and global climate change. Restor. Ecol. 14, 170–176 (2006). [Google Scholar]
- 37.Temmerman S., Kirwan M. L., Building land with a rising sea. Science 349, 588–589 (2015). [DOI] [PubMed] [Google Scholar]
- 38.Simenstad C., Reed D., Ford M., When is restoration not?: Incorporating landscape-scale processes to restore self-sustaining ecosystems in coastal wetland restoration. Ecol. Eng. 26, 27–39 (2006). [Google Scholar]
- 39.C. Writing Team, R. K. Pachauri, L. Meyer, IPCC, 2014: Climate Change 2014: Synthesis Report. Contribution of Working Groups I, II and III to the Fifth Assessment Report of the Intergovernmental Panel on Climate Change (IPCC, 2014).
- 40.Titus J. G., Hudgens D. E., Trescott D. L., Craghan M., Nuckols W. H., Hershner C. H., Kassakian J. M., Linn C. J., Merritt P. G., McCue T. M., OConnell J. F., Tanski J., Wang J., State and local governments plan for development of most land vulnerable to rising sea level along the US Atlantic coast. Environ. Res. Lett. 4, 044008 (2009). [Google Scholar]
- 41.San Francisco Bay Area Wetlands Ecosystem Goals Project, The Baylands and Climate Change: What We Can Do. Baylands Ecosystem Habitat Goals. Science Update 2015 (State Coastal Conservancy, 2015). [Google Scholar]
- 42.Day J. W. Jr, Boesch D. F., Clairain E. J., Kemp G. P., Laska S. B., Mitsch W. J., Orth K., Mashriqui H., Reed D. J., Shabman L., Simenstad C. A., Streever B. J., Twilley R. R., Watson C. C., Wells J. T., Whigham D. F., Restoration of the Mississippi delta: Lessons from hurricanes Katrina and Rita. Science 315, 1679–1684 (2007). [DOI] [PubMed] [Google Scholar]
- 43.Buffington K., Dugger B. D., Thorne K. M., Takekawa J. Y., Statistical correction of lidar-derived digital elevation models with mulitpectral airborne imagery in tidal marshes. Remote Sens. Environ. 186, 616–625 (2016). [Google Scholar]
- 44.National Oceanic and Atmospheric Administration, Computational Techniques for Tidal Datums Handbook (National Oceanic and Atmospheric Administration, Special Publication NOS CO-OPS 2, 2003), 98 pp. [Google Scholar]
- 45.Ritchie J. C., McHenry J. R., Application of radioactive fallout cesium-137 for measuring soil-erosion and sediment accumulation rates and patterns: A review. J. Environ. Qual. 19, 215–233 (1990). [Google Scholar]
- 46.Callaway J. C., Nyman J. A., DeLaune R. D., Sediment accretion in coastal wetlands: A review and a simulation model of processes. Curr. Top. Wetland Biogeochem. 2, 2–23 (1996). [Google Scholar]
- 47.S. J. Deverel, J. Z. Drexler, T. Ingrum, C. Hart, “Simulated holocene, recent and future accretion in channel marsh islands and impounded marshes for subsidence mitigation, Sacramento-San Joaquin Delta, California, USA” (REPEAT Project Final Report to the CALFED Science Program of the Resources Agency of California, 2008).
- 48.Morris J. T., Sundareshwar P. V., Nietch C. T., Kjerfve B., Cahoon D. R., Responses of coastal wetlands to rising sea level. Ecology 83, 2869–2877 (2002). [Google Scholar]
- 49.Tucker C. J., Red and photographic infrared linear combinations for monitoring vegetation. Remote Sens. Environ. 8, 127–150 (1979). [Google Scholar]
- 50.Janousek C., Buffington K. J., Thorne K. M., Guntenspergen G. R., Takekawa J. Y., Dugger B. D., Potential effects of sea-level rise on plant productivity: Species-specific responses in northeast Pacific tidal marshes. Mar. Ecol. Prog. Ser. 548, 111–125 (2016). [Google Scholar]
- 51.Kirwan M. L., Murray A. B., A coupled geomorphic and ecological model of tidal marsh evolution. Proc. Natl. Acad. Sci. U.S.A. 104, 6118–6122 (2007). [DOI] [PMC free article] [PubMed] [Google Scholar]
- 52.Fagherazzi S., Mariotti G., Wiberg P. L., McGlathery K. J., Marsh collapse does not require sea level rise. Oceanography 26, 70–77 (2013). [Google Scholar]
- 53.Warrick J. A., Farnsworth K. L., Sources of sediment to the coastal waters of the Southern California Bight. Geol. Soc. Am. Spec. Paper 454, 39–52 (2009). [Google Scholar]
- 54.Sutter L. A., Chambers R. M., Perry J. E., Seawater intrusion mediates species transition in low salinity, tidal marsh vegetation. Aquat. Bot. 122, 32–39 (2015). [Google Scholar]
Associated Data
This section collects any data citations, data availability statements, or supplementary materials included in this article.
Supplementary Materials
Supplementary material for this article is available at http://advances.sciencemag.org/cgi/content/full/4/2/eaao3270/DC1
fig. S1. Available transgression or migration space under high SLR scenarios for the study sites.
fig. S2. Projections of future sea level used in the WARMER modeling for high, moderate, and low SLR scenarios, from the National Research Council (6).
fig. S3. 137Cs activity (in becquerel per kilogram) shown by depth with mean ± SE for sediment cores taken from sites in Southern California.
table S1. Core elevation (in centimeters; relative to MSL) and accretion rate (in millimeters per year) for soil cores used in WARMER modeling.
table S2. Sample size, mean elevation, and elevation range of real-time kinematic GPS (in meters; NAVD88) points collected at all study sites.
table S3. Equilibrium elevations from WARMER.
table S4. Elevation range of low, middle, and high marsh zones at each site.
table S5. List of sediment cores taken from California, with locations, elevations, and estimated sediment accretion rate from 137Cs dating.
table S6. WARMER model parameters for Pacific Northwest study sites.
table S7. WARMER parameters for California study sites.